Volume 4, Issue 4, 2017
91
Available online at www.ijiere.com
International Journal of Innovative and Emerging
Research in Engineering
e-ISSN: 2394 – 3343 p-ISSN: 2394 – 5494
Study of Different Wind Tunnel Configuration for
Performance Improvement Using Computational Fluid
Dynamics
Utpal Patela, Sudhir Chaudharib, Chandresh Patelb
aPG Student, Hansaba College of Engineering and Technology Sidhpur, Gujarat Technological University, India bAssi. Professor, Hansaba College of Engineering and Technology Sidhpur, Gujarat Technological University, India
bAssistant Professor, Sankalchand Patel College of Engineering, Sankalchand Patel University, visnagar, India.
a[email protected], b[email protected],b[email protected],
ABSTRACT:
An existing subsonic, open circuit, wind tunnel at institute laboratory for use in aerodynamic design experiments is studied and new contraction profile with differ CR is proposed. The above mentioned contraction shape is designed using a sixth order polynomial. The paper deals with the process of design optimization, using Computational Fluid Dynamics (CFD) to model the contraction. The location of the point of inflection and the contraction Ratio are the selected parameters among all affecting parameters concluded from literature were varied. The aim is to optimize flow uniformity at the working section mid-plane, prevention of flow separation in the contraction part. Experimental validation of the wind tunnel after redesigning contraction shape agreed with the value of the design results and validated the CFD predictions. Keywords: Wind Tunnel, Contraction Ratio (CR), Test Section,divergence angle, aspect ratio, CFD.
I.INTRODUCTION
Based on evidence in current literature, aerodynamic research is poised between experimental and computation techniques. The two are closely linked and as progress is made in the development of more advanced computational fluid models, more comprehensive experimental data are required to validate the models. In the present situation a wind tunnel was remodelled for the purpose of aerodynamic blade design experiments. [11]
Traditionally, the design of wind tunnel contractions has been based on a pair of cubic polynomials, and the parameter used to optimise the design for a fixed length and contraction ratio, has been the location of the joining point [1-4]. The computation of flow field within the contraction has previously utilised incompressible, inviscid flow equations and co-ordinate transformation techniques to solve the difference equations. Published, parameterised data in the form of design charts are also available to avoid the need to repeat these computations, for axisymmetric contractions.
Currently, more flexibility in the design of wind tunnel contractions can be exhibited, with the use of CFD to enable rapid testing of designs to optimise contractions of arbitrary cross-section and wall profile. The use of CFD allows for the use of higher order polynomials, and non-zero curvature or slope at inlet to the contraction. However, the performance of the contraction still requires testing after construction, as the level of CFD used for this application is typically insufficient to detect the development of longitudinal vortices through the working section such as were measured by [ 3,4,7 ].
This paper describes the design of a 2D contraction with 6th degree polynomial wall profile for a wind tunnel with a
square working section and its subsequent experimental validation.
II.LITERATURESURVEY
92 III.DESCRIPTION OF THE FACILITY
The existing wind tunnel facility presented in this work is an open circuit type driven by variable speed controlled axial fan placed at the end of diffuser section with inlet contraction of 900 X 900 mm test section is of 300 X 300 mm means CR of 9 which is varied with values 6, 7, 8 and varying match points different models are studied. The maximum velocity in the working section was 20 m/s. The original contraction length of 1.3 m was retained, but the profile definition was changed from a pair of cubic curves (square to square) to a 6th order polynomial which leads to rectangular to square. The wall curvature at inlet and the location of the point of inflection in the wall profile were chosen as design parameters.
IV.PARAMETERIZATION OF THE PROFILE
The coordinate system for the contraction profile is defined with origin on the tunnel center line at the contraction inlet plane, and x coordinate increasing in the downstream direction. The y coordinate defines the contraction profile. A sixth order polynomial was chosen to define the profile shape:
y = ax6 + bx5 + cx4 + dx3 + ex2 + fx + g
The chosen profile has 7 parameters (a-g). Five of these are specified by the inlet and outlet height, zero slope at the inlet and outlet and zero curvature at outlet. This leaves two parameters available for optimization. These are specified by the inlet curvature and the axial position of the point of inflection relative to the contraction length. The 7 conditions defining the profile are thus:
y(x=0)=h y’(𝑥 = 𝑙)=0
y”(𝑥 = 𝑖)=0
y’(𝑥 = 0)=0 y”(𝑥 = 𝑙)=0
y(𝑥 = 𝑙)=0 y”(𝑥 = 0)=α
where:
h = inlet half height – exit half height α = inlet curvature
i = axial location of inflection point l = length of contraction
The conditions specified by (2) directly provide the following constants for the polynomial
g = h; f= 0; e= α/2
The other constants are defined by the equation: Aw = B
[
30𝑖4 20𝑖3∙ 12𝑖2 6𝑖
𝑙6 𝑙5 𝑙4 𝑙3
6𝑙5 5𝑙4 4𝑙3 3𝑙2
30𝑙4 20𝑙3 12𝑙2 6𝑙
] ∙ [ 𝑎 𝑏 𝑐 𝑑 ] = [ 0 −ℎ 0 0 ]
Where, α = 0 for the standard case (with no inlet curvature).
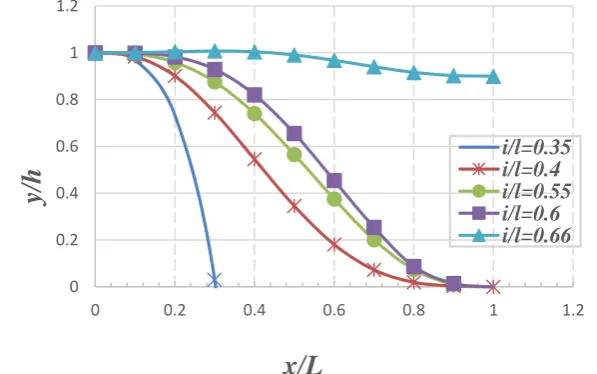
In order to optimize the shape, the optimal position of the point of inflection was determined using MatLab. The range of the variable, i, distance to the point of inflection, which gives a sensible, monotonically decreasing curve is 0.4-0.6. Figure shows that with a lower or higher value of i/l, the profile under or overshoots respectively. [11]
Figure 1 proposed Contraction profiles(6th order polynomial), variation with inflection point location. 0 0.2 0.4 0.6 0.8 1 1.2
0 0.2 0.4 0.6 0.8 1 1.2
Volume 4, Issue 4, 2017
93 The commercial CFD software package CFX was used to mesh, solve and post-process the contraction model. The contraction shape was specified by the polynomial curve, with the parameter values outlined in Table 1 below. One quarter of the contraction was modelled, using the horizontal and vertical symmetry planes to reduce the size and computational load of the model. A working section of length 0.5l was modelled at the end of the contraction to provide a model of the flow development beyond the end of the contraction.
Model 1 2 3 4 5 6 7 8 9 10 11 12
i/l 0.4 0.55 0.6 0.4 0.55 0.6 0.4 0.55 0.6 0.4 0.55 0.6
CR 9 9 9 8 8 8 7 7 7 6 6 6
Table 1: Proposed models for study.
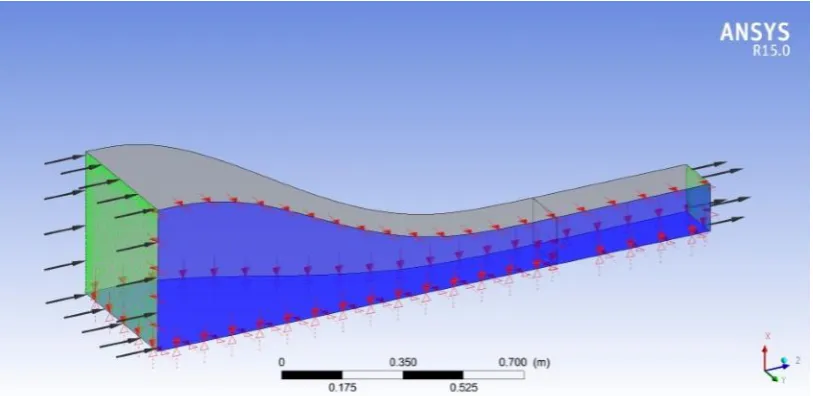
The Reynolds Shear Stress Transport (SST) model of turbulence was used with a specified turbulence level of 1%. A velocity calculated from continuity equation was used to define the inlet boundary condition, with a constant static pressure outlet boundary condition of atmospheric pressure. This generated a mainstream flow velocity of 20 m/s, which is typical of the maximum required of the facility. In the physical wind tunnel, a bell-mouth inlet section is followed by a 50 mm length of honeycomb to straighten the flow. These flow manipulators were not modelled in the CFD analysis. The model was meshed using an unstructured, tetrahedral mesh with body size 0.09 and edge size 0.01. The model geometry and mesh are shown in Figure 2 and 3.
Figure 2 Boundary conditions applied to model in ANSYS CFX.
94 V.OPTIMIZATION OF MODEL DESIGN
The contraction length and width were held fixed for this design, due to the existing facility geometry. The parameters varied in the model were the location of the point of inflection and the exit height is kept constant and inlet height is varied by lowering CR. All the models are studied under defined CFD conditions and uniformity is checked from each CR models most uniform results are selected and summarised on same graph (figure 4).
Figure 4 optimum models from all twelve models
VI. COMPUTATIONAL RESULTS
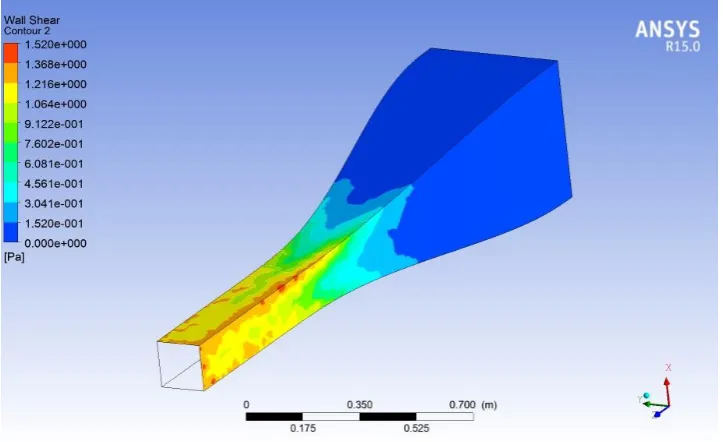
The computational models were reviewed to test for uniformity of flow in the working section, and the presence of separation. It was found that none of the models tested experienced separation. In Figure 5, a typical wall shear plot demonstrates the lack of separating flow (indicated by positive values of wall shear over the entire wall). All models demonstrated reasonably uniform flow across the wind tunnel mid plane, but models 2, 5, 9 and 10 appeared to have a more uniform velocity profile. Comparison of the flow development through the working section, demonstrated model 10 to have the most uniform flow of these four models, and hence it was selected for manufacture. This profile has i/l = 0.4, and α=0. The velocity profiles at mid-test section plane and mid of contraction plane of model 10 are shown in Figure 6 and 7.
Figure 5 Wall shear (Pa) plot 0.95
0.955 0.96 0.965 0.97 0.975 0.98 0.985 0.99 0.995 1
0 20 40 60 80 100 120 140 160
U/Um
a
x
Distance from wall (mm)
Volume 4, Issue 4, 2017
95 Figure 6 Velocity distribution at mid-test section
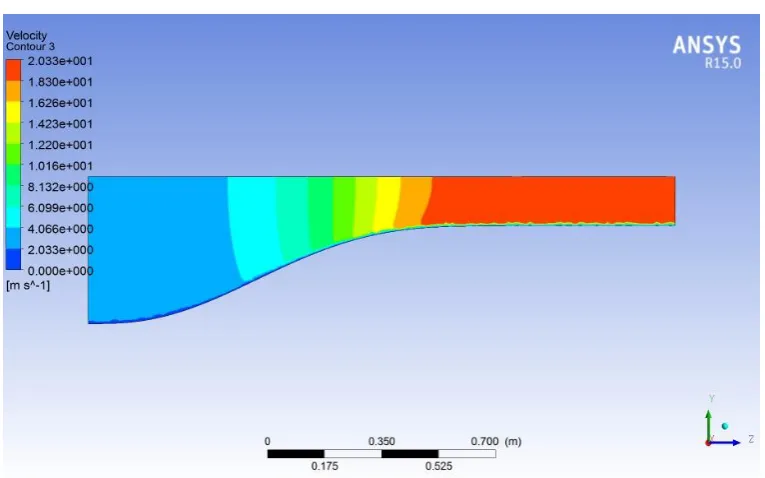
Figure 7 Velocity contour at mid-plane of contraction
VII.PHYSICAL CALIBRATION OF THE FACILITY
Following construction of the optimal design (model 10), experimental measurements were conducted to verify the CFD model and calibrate the facility. Calibration measurements included time mean flow, wall shear stress, flow direction and stream wise turbulence intensity in the working section. The mid plane of the working section was traversed with a pitot probe to determine the uniformity of the flow in the working section.
Figures 8 compares the relative velocity profile, respectively at the mid working section with the CFD model. Profile match but CFD gives same profile at higher values for each reading this is because the honeycomb upstream of the contraction were not modelled.
VIII.CONCLUSIONS
96 Figures 8 Comparison of Relative velocity (experimental and CFD) at mid-working section measured on vertical.
ACKNOWLEDGMENT
We want to wish special thanks to Prof. Sudhir Chaudhari of Mechanical Department, Hansaba College of Engineering & Technology, for their guidance and attention. I would also like to thank Prof. K. D. Parmar for their valuable comments and suggestions and supports. We have to appreciate the guidance given by other Professors as well as the panels especially in our project presentation that has improved our presentation skills thanks to their comment and advices.
REFERENCES
[1] Leifur Leifsson ,Slawomir Koziel, “Simulation-driven design of low-speed wind tunnel contraction”, Journal of Computational Science, Elsevier, Journal of Computational Science 7 (2015) 1–12.
[2] Fuh-Min Fang, J.C. Chen, Y.T. Hong,“Experimental and analytical evaluation of flow in a square-to-square wind tunnel contraction “,Elsevier, Journal of Wind Engineering and Industrial Aerodynamics 89 (2001) 247–262. [3] James H. Bell and Rabindra D. Mehta,”CONTRACTION DESIGN FOR SMALL LOW-SPEED WIND
TUNNELS”,J.H. Bell, R.D. Mehta, 1988. Contraction Design for Small Low Speed WindTunnels, NASA, Contractor, Rep. No. NASA-CR-177488, 1988.
[4] Dehghan Manshadi M., Mirzaei M., Soltani M. R., and Ghorbanian K ,”Control of Pressure Gradient in the Contraction of a Wind Tunnel”,International Journal of Mechanical, Aerospace, Industrial, Mechatronic and Manufacturing Engineering Vol:2, No:4, 2008.
[5] A.S. Abdelhamed, Y.El-S. Yassen, M.M. ElSakka, “Design optimization of three dimensional geometry of wind tunnel contraction” , Elsevier, Ain Shams Engineering Journal, 2014.
[6] E.M. Sparrow, J.P. Abraham, W.J. Minkowy, “Flow separation in a diverging conical duct: Effect of Reynolds number and divergence angle”, Elsevier, International Journal of Heat and Mass Transfer 52 (2009) 3079–3083.
[7] Majid Nabavi,”Three-dimensional asymmetric flow through a planar diffuser: Effects of divergence angle, Reynolds number and aspect ratio.”, Elsevier, International Communications in Heat and Mass Transfer 37 (2010) 17–20. [8] Ester Scotto di Perta, Maria Angela Agizza , Giancarlo Sorrentino , Lorenzo Boccia , Stefania Pindozzi, “Study of
Aerodynamic performances of different wind tunnel configurations and air inlet velocities, using CFD”, Elsevier, Computers and Electronics in Agriculture 125 (2016) 137–148.
[9] F. Fang, A design method for contractions with square end sections, ASME Journal of Fluids Engineering ·Volume.119 (june-1997).
[10] J.E. Sargison , G.J. Walker and R. Rossi, Design and calibration of a wind tunnel with a two dimensional contraction, 15th Australasian Fluid Mechanics Conference, The University of Sydney, Sydney, Australia, 13-17 December 2004. [11] Utpal Patel, Chandresh Patel and Akash M Patel , A Brief Study of Different Low-Speed Wind Tunnel Configuration
on Flow Uniformity in Test Section, IJIERE 4 (1) 185-188.
0.94 0.95 0.96 0.97 0.98 0.99 1 1.01
0 50 100 150 200 250 300 350
U/U
M
A
X