Vol. 8, No. 2, 2016 Article ID IJIM-00711, 8 pages Research Article
A cultural algorithm for data clustering
M. R. Shahriari ∗†
Received Date: 2015-03-13 Revised Date: 2015-11-03 Accepted Date: 2016-01-07
————————————————————————————————–
Abstract
Clustering is a widespread data analysis and data mining technique in many fields of study such as engineering, medicine, biology and the like. The aim of clustering is to collect data points. In this paper, a Cultural Algorithm (CA) is presented to optimize partition with N objects into K clusters. The CA is one of the effective methods for searching into the problem space in order to find a near optimal solution. This algorithm has been tested on different scale datasets and has been compared with other well-known algorithms in clustering, such as K-means, Genetic Algorithm (GA), Simulated Annealing (SA), Ant Colony Optimization (ACO) and Particle Swarm Optimization (PSO) algorithm. The results illustrate that the proposed algorithm has a good proficiency in obtaining the desired results.
Keywords: Data Clustering; Genetic Algorithm; Cultural Algorithm; Particle Swarm Optimization.
—————————————————————————————————–
1
Introduction
C
lustering is an important problem that mustoften be solved as a part of the more compli-cated tasks in image processing, anomaly detec-tion, medicine, construction management, mar-keting, data retrieval, reliability, portfolio opti-mization, selecting supplier and data envelop-ment analysis. Clustering is partitioning a set of objects into clusters, where the objects in the same cluster are more similar to each other. Hence, the clustering method is also known as hi-erarchy clustering method, mixture-model clus-tering, learning network clusclus-tering, and objec-tive function based clustering and partition-based clustering. (Po et al. 2009) [15]. K-means clustering algorithm is one of the most popular and classic clustering algorithms (Duda and Hart 1973[2]). This method is simple, efficient and∗Corresponding author. [email protected] †Faculty of Management, South Tehran Branch,
Is-lamic Azad University, Tehran, Iran.
fast with linear time complexity. However, the results of k-means highly depend on the initial state in order for them to reach the local opti-mal solution. There are a large number of re-searchers who have applied different optimization techniques to eliminate this problem. For exam-ple, Genetic Algorithm-based method to solve the clustering problem was proposed by Cowgill et al. 1999 [7]; Maulik and Bandyopadhyay 2000 [13]. Tabu search-based heuristic for clustering was de-veloped by Sung and Jin 2000) [20]. Shelokar et al. (2004) [19] have proposed an ant colony optimization based approach for optimal cluster-ing N objects into K clusters. An HBMO algo-rithm, which was inspired by the process of mar-riage in real honey-bee world, was used to solve the clustering problem by Fathian et al. (2007) [9]. Kao et al. (2008) [12] have introduced a hybrid technique that combines the PSO algo-rithm, NelderMead simplex search, and K-means algorithm. Cao and Cios (2008) [3] have pro-posed a hybrid algorithm (GAKREM) based on
the genetic algorithm, K-means and logarithmic regression expectation maximization. GAKREM has three main advantages, namely, there is no need to specify the number of clusters a priori, it avoids being trapped into a local optimum, and it requires not lengthy computations. Niknam and Amiri (2010) [14] have presented a hybrid evo-lutionary optimization algorithm according to a fuzzy adaptive PSO, ACO and K-means, called FAPSO-ACOK, to solve the clustering problem. Using the advantages of the K-means algorithm and also the output of hybrid FAPSOACO algo-rithm is considered as an initial state of k-means. Chuang et al. (2011) [5] showed the outstand-ing application of PSO in multi-dimensional space clustering performance. However, the rate of con-vergence when searching for global optima is still not sufficient (Kao et al. 2008) [12]. For this rea-son, they combined Chaotic-map Particle Swarm Optimization (CPSO) with an accelerated con-vergence rate strategy. This technique allows the ACPSO algorithm to cluster arbitrary data bet-ter than previous algorithms. Results of the con-ducted experimental trials on a variety of data sets taken from several real-life situations demon-strate that ACPSO was superior to the K-means, PSO, NM-PSO, CPSO, K-PSO and K-NM-PSO algorithms (Kao et al. 2008) [12]. Cura (2012) [8] have proposed a particle swarm optimization approach to clustering. Apart from many of the previously-proposed approaches, PSO algorithm is applicable when the number of clusters is either known or unknown.
Cultural algorithm (CA) is a branch of evolution-ary computation introduced by Reynolds in 1995 (Reynolds 1995) which has three major compo-nents as population space, belief space and com-munication protocol where the belief space is a knowledge component. In CA there is a dual evolution- dual improvement evolutionary based algorithms. This improvement can lead to a faster convergence and also a robust performance (Xie et al. 2009; Ma and Wang 2009). In this study, CA algorithm is extended for solving clus-tering problems. The performance of the algo-rithm has been tested on different scale datasets and compared with several other proposed clus-tering algorithms.
In the following, the data clustering analysis is discussed in Section 2. In Section 3, Cultural algorithm is presented. The implementation of
the CA algorithm in clustering is illustrated in Section 4. In Section 5 the performance of the proposed algorithm has been demonstrated and compared with that of the original GA, SA, PSO and K-means for different datasets, and finally, conclusions are presented in Section 6.
2
Data Clustering Analysis
The K-means algorithm (Duda and Hart 1973[2]) searches to find the cluster centers,C1, C2, ..., CK, in such a way that the sum of the squared dis-tances (i.e., objective function) of each data point (Xi) to its nearest cluster center (Ck) is min-imized, as shown in Equation (2.1), where d is a distance function. Typically, d is chosen as the Euclidean distance which is derived from Minkowski metric and can be defined as Equation (2.2).
f(X, C) = N
∑
i=1
(
min
k=1,2,...,kd(Xi−Ck)
)2
. (2.1)
d(x, y) =
( m ∑
i=1
|xi−yi|r
)1
r
(2.2)
⇒d(x, y) =
v u u t∑m
i=1
(xi−yi)2
The main procedures of the K-means algorithm are as follows.
(1) To randomly select k points as initial cen-troids.
(2) To assign each point to the nearest centroids.
(3) To update the locations of each centroid by calculating the mean value of the objects as-signed to it.
(4) To stop, if the termination criterion is met, or to go to step 2, if otherwise. This means that either the iterations reach the maximum number or no change in the location of the centroids occurs.
3
Cultural algorithm (CA)
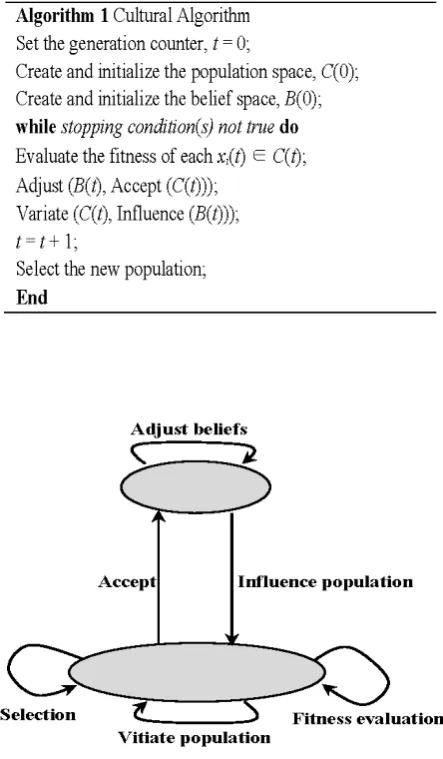
to represent a genetic component based on Dar-winian principles, and a belief space to represent a cultural component. It is the latter that distin-guishes CAs from other evolutionary algorithms (EA). The belief space models the cultural infor-mation about the population, while the popula-tion space represents the individuals on a geno-typic and/or phenogeno-typic level. Both the popu-lation and belief spaces evolve in parallel, with both influencing one another. A communication protocol therefore forms an integral part of a CA. Such a protocol defines two communication chan-nels; one for a select group of individuals to adapt the set of beliefs, and another defining the way that the beliefs influence all of the individuals in the population space. The pseudo code and general framework of the cultural algorithm are presented in Algorithm 1 and Figure 1, respec-tively. In every iteration, individuals are first
Figure 1: Framework of cultural algorithm.
evaluated using the fitness function specified for
the EA on the population level. An acceptance function is then used to determine which indi-viduals from the current population have an in-fluence on the current beliefs. The experience of the accepted individuals is then used to ad-just the beliefs. The adjusted beliefs are then used to influence the evolution of the population. The variation operators use the beliefs to con-trol the changes in individuals. This is usually achieved through self-adapting control parame-ters, as functions of the beliefs. The population space is searched using any of the standard EAs, for example an EP (Reynolds and Chung 1997 [18]) or GA (Reynolds 1991 [16]). Recently, Par-ticle Swarm Optimization (PSO) has been used on the population space level (Coelho and Mari-ani 2006 [6]).
3.1 Belief space
In general, the belief space contains at least two knowledge components (Reynolds and Chung 1997 [18]):
A situational knowledge component, which keeps track of the best solutions found at each generation
A normative knowledge component, which provides standards for individual behaviors, used as guidelines for mutational adjust-ments to individuals. In the case of function optimization, the normative knowledge com-ponent maintains a set of intervals, one for each dimension of the problem being solved. These intervals characterize the range of what is believed to be good areas to search in each dimension.
If only these two components are used, the belief space is formed as,
B(t) = (S(t), N(t)) (3.3)
Where S(t) represents the situational knowledge component, and N(t) represents the normative knowledge component. The situational compo-nent is the set of best solutions is formed as,
S(t) ={yˆl(t) :l= 1, ..., nS} (3.4)
and the normative component is represented as
where, for each dimension, the following informa-tion is stored:
Xj(t) = (Ij(t), Lj(t), Uj(t)) (3.6)
Ij denotes the closed interval, Ij(t) = [xmin,j(t), xmax,j(t)] = {x : xmin,j ≤ x ≤ xmax,j}, Lj(t) is the score for the lower bound, and Uj(t) is the score for the upper bound.
3.2 Acceptance Functions
The acceptance function determines which indi-viduals from the current population will be used to shape the beliefs for the entire population. Static methods use absolute ranking, based on fit-ness values, to select the topn% individuals. Pro-viding that the number of individuals remains the same, the acceptance function chooses individu-als who impact the creation of the current belief space. A number of different classes of acceptance functions can be employed. One class of func-tions uses only the information of top individuals in the population to renew the belief space. For example, if the top 20% rule is applied, then just the top 20% individuals impact the belief space in each generation. A second class of functions, called modified-top 20% is also static in nature but uses temporal information about the number of generations used so far to determine the num-ber of individuals accepted at time (generation number) t.
3.3 Adjusting the Belief Space
For the purpose of this part, it is assumed that the belief space maintains a situational and nor-mative knowledge component, with the number of accepted individuals, nB(t), known, the two knowledge components can be updated as follows (Coelho and Mariani, 2006 [6]):
Situational knowledge: Assuming that only one element is kept in the situational knowl-edge component,
S(t+ 1) ={y(tˆ + 1)} (3.7)
Where ˆ y(t+1) =
minl=1,2,...,nB(t){xl(t)} if
minl=1,2,...,nB(t){xl(t)} ≺y(t)ˆ
ˆ
y(t) otherwise
(3.8)
Normative knowledge: In adjusting the nor-mative knowledge component, a conservative approach is followed when narrowing inter-vals, thereby delaying too early exploration. Widening of intervals is applied more pro-gressively. The interval update rule is as fol-lows:
xmin,j(t+ 1) =
xl,j(t){xl(t)} if
xlj(t)≤xmin,j or f(xl(t))≺Lj(t) xmin,j(t) otherwise
(3.9)
xmax,j(t+1) =
xl,j(t){xl(t)} if xlj(t)≥xmax,j
or f(xl(t))≺Uj(t) xmax,j(t) otherwise
(3.10)
Lj(t+ 1) =
f(xl(t)) if xlj(t)≤xmin,j orf(xl(t))≺Lj(t)
Lj(t) otherwise (3.11)
3.4 Influence Functions
Beliefs are used to adjust individuals in the pop-ulation space to conform closer to the global be-liefs. The adjustments are realized via influence functions. The belief space is used to deter-mine the mutational step sizes, and the direction of changes. Reynolds and Chung proposed four ways in which the knowledge components can be used within the influence function. In this paper we use only one of them as follow:
The normative component is used to determine step sizes and the situational component is used to determine change directions:
x′ij(t) =
xij(t) +|σij(t)·β·Nij(0,1)| if xij(t)≺yˆj(t)∈S(t)
xij(t)− |σij(t)·β·Nij(0,1)| if
xij(t)≻yˆj(t)∈S(t)
In Equation (3.12), β is control parameter and N ij(0,1) shows a random number from a nor-mal distribution where the mean value and the standard deviation are zero and one respectively. Finally, σij is the strategy parameter associated with component j of individual i which is ob-tained as follow:
σij(t) = size(I(t)) (3.13)
4
Application of CA in
cluster-ing
To implement the CA algorithm in the clustering problem, the following steps should be taken and repeated:
Step 1: Initialize belief space, population space and parameters of algorithm.
Step 2: Evaluate the objective function value for each individual in the initial population and the individuals with less fitness value are cho-sen as the third step.
Step 3: Choosing top individuals (% n) as accep-tance function.
Step 4: Forming and updating the belief space with the individuals accepted (Adjusting).
Step 5: Update the population using belief space (In-fluence).
Step 6: Check the termination criteria. If the current iteration number reaches the predetermined maximum iteration number, stop the search procedure; otherwise, go back to Step 2.
5
Results and discussion
We test the CA on five different scale datasets and compared with other well-known algorithms. All algorithms are implemented in MATLAB software and executed on a 2GHz laptop with 6GB of RAM. Two of datasets are artificial taken from Kao et al. (2008) [12] and the three of them are well-known iris, thyroid, and wine datasets taken from Machine Learning Laboratory (Blake and Merz [1]). They have been considered by many authors to study and evaluate the performance of their algorithms, and can be described as follows:
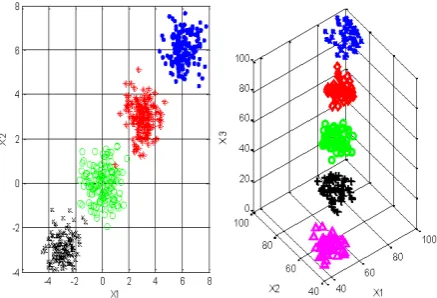
Dataset 1: Artificial data set one (n =
600, d = 2, k = 4). This is a two featured problem with four unique classes. A total of 600 patterns were drawn from four independent bivariate normal distributions, where classes were distributed according to
M2=
(
µ=
(
ωi ωi
)
,Σ
[[
0.5 0.05 0.05 0.5
]])
i= 1,2, ...,4, ω1 =−3, ω1= 0, ω1 = 3, ω1= 6
µ and Σ being mean vector and covariance matrix, respectively. The data set is illustrated in Figure 2.
Dataset 2: Artificial data set two (n =
250, d = 3, k = 5). This is a three featured problem with five classes, where every feature of the classes was distributed according to Class 1-Uniform (85, 100), Class 2-Uniform(70, 85), Class 3-Uniform(55, 70) Class 4-Uniform( 40, 55), Class 5-Uniform(25, 40). The data set is illustrated in Figure2.
Figure 2: Two artificial data sets.
Dataset 3: iris dataset. The Iris flower dataset or Fisher’s Iris dataset is a multivariate dataset introduced by Sir Ronald Fisher (1936) as an example of discriminate analysis. This dataset contains three categories of 50 objects each, where each category refers to a type of iris plant. In the iris dataset, there are 150 instances with four attributes, which are sepal length in cm, sepal width in cm, petal length in cm and petal width in cm.
the results of a chemical analysis of wines grown in the same region in Italy extracted from three different cultivars. This dataset contains 178 instances with 13 continuous numeric attributes. The attributes are alcohol, malic acid, ash, alcalinity of ash, magnesium, total phenols, fla-vanoids, nonflavanoid phenols, proanthocyanins, color intensity, hue, OD280/OD315 of diluted wines and proline. All attributes are continuous. There is no missing attribute value.
Dataset 5: Contraceptive Method Choice
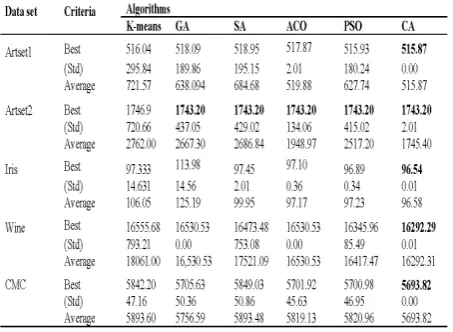
(CMC) dataset. This dataset is a subset of the1987 National Indonesia Contraceptive Prevalence Survey. The samples were married women who either were not pregnant or did not know if they were at the time of interview. The problem is to predict the current contraceptive method choice (no use of long-term methods, or short-term methods) of a woman based on her demographic and socio economic characteristics. The attributes are wife sage, wifes education, husband s education, number of children ever born, wifes religion, wifes now working, hus-bands occupation, standard-of-living index, media exposure, and contraceptive method used To evaluate the performance of the CA, we have compared it with the following clustering algorithms: K-means, GA, TS, SA, ACO and PSO which are taken from Niknam and Amiri (2010) [14]. There are four control parameters in CA, the Population Size PS, the Acceptance Function AF, the Maximum Iteration MI and control parameter µ. They are set as follows: PS = 100, AF = %30, MI = 100 and µ = 0.3. The comparison of results for each dataset is based on the best solution, obtained after more than 20 different simulations, for each algorithm. The sum of the intra-cluster distances, i.e. the distances between data vectors within a cluster and the centroid of this cluster, as defined in Equation 2.1 is used to measure the quality of a clustering. Clearly, the smaller the sum of the distances is, the higher the quality of clustering. MATLAB software is used in a 2GHz laptop with 6GB of RAM, to encode this algorithm. The results of K-means, GA, SA, ACO and PSO can be found in Niknam andAmiri (2010) [14]. Highest values are indicated in bold type.
The results of the simulations for comparing the proposed algorithm with different algorithms
Table 1: Comparison of different clustering algo-rithms.
on Artset1, Artset2, Iris, and Wine and Liver disorder datasets are represented in table1. The results obtained by CA algorithm for Artset1 dataset are equal to 515.87, which significantly is better than other algorithms. For the Artset2 dataset, CA such as GA, SA, ACO and PSO algorithm is converged to the global optimum of 1743.20. Note that the standard deviation of solution obtained by CA is lower than other algorithm. For the Iris datasets, the proposed algorithm is converged to the global optimum of 96.54, while other algorithms cannot reach this value even after more than 20 runs. For the Wine dataset, the CA algorithm has the best result. Finally, For the Liver disorder dataset, the CA algorithm achieved the optimum value of 9851.72, which is significantly better than the other algorithms.
In summary, the above statements prove that in all datasets the proposed CA algorithm is superior to the other algorithms. It can find high quality solutions and provides small standard deviation. In other words, the CA algorithm converges to global optimum in all the runs while the other algorithms may get trapped in local optimum solutions.
post hoc test, in which is used to compare the control method, against the remaining ones. For more details about classification problem, one can refer to (Garcia et al. 2010) [11]. We used ? = 0.05 as the level of confidence in all cases. Table 2 depicts the average ranking of clustering algorithms computed through the Friedmans test. The proposed CA algorithm stand alone in the first rank, followed by PSO, ACO, GA, SA and K-means, successively. Table 3 presents the p-value computed by the Friedman test and the ImanDavenport test, which confirm the existence of significant differences among the performance of all the clustering algorithms. Therefore, the
Table 2: Average ranking of clustering algorithms.
Table 3: Results of Friedmans and ImanDaven-ports tests.
Table 4: Results of Hollands method (CA is the control algorithm).
Hollands method is carried out as a post hoc test to detect effective statistical differences between the control approach, i.e., the one with the lowest Friedmans rank, and the remaining approaches, the results of which are shown in Table 4. The results of the Holms method reveal that the control algorithm (CA) is statistically better than the K-means, GA and SA. In the ACO and PSO cases there is no significant difference based on the Hollands method results. However, the results reported in Table 1 show that the CA algorithm achieved the best results among all the algorithms.
6
Conclusion
Clustering has a various range of application in many fields of study such as engineering, medicine, biology and the like. In this paper, we presented CA algorithm to clustering data vec-tors for five different scale datasets. CA algo-rithm could minimize the objective function of the clustering problem in an N-dimensional Eu-clidean space and also this algorithm can be ap-plied when the number of clusters is known and the clusters are clearly defined. Simulation re-sults clearly presented the efficiency and effec-tiveness of the proposed CA algorithm which in the future studies this algorithm can be use in a large number of fields. By combining this algo-rithm with other algoalgo-rithms, more efficiency and progress is expected.
References
[1] C. Blake, C. J. Merz, UCI Repository of Machine Learning Database, Available from: http://www.ics.uci.edu/~mlearn/ MLrepository.html.
[2] R. O. Duda, P. E. Hart, Pattern Classifica-tion and Scene Analysis, New York: Wiley (1973).
[3] D. Cao, K. J. Cios, GAKREM: a novel hy-brid clustering algorithm, Information Sci-ences 178 (2008) 42054227.
[4] D. X. Chang, X. D. Zhanga, C. W. Zheng,
A genetic algorithm with gene rearrangement for K-means clustering, Pattern Recognition 42 (2009) 1210-1222.
[5] L. Y. Chuang, C. J. Hsiao, C. H. Yang,
Chaotic particle swarm optimization for data clustering, Expert Systems with Applica-tions 38 (2011) 1455514563.
[6] L. D. S. Coelho, V. C. Mariani, An Ef-ficient Particle Swarm Optimization Ap-proach Based on Cultural Algorithm Applied to Mechanical Design, In Proceedings of the IEEE Congress on Evolutionary Computa-tion (2006) 10991104.
analy-sis, Computers & Mathematics with Appli-cations 37 (1999) 99108.
[8] T. Cura, A particle swarm optimization ap-proach to clustering, Expert Systems with Applications 39 (2012) 15821588.
[9] M. Fathian, B. Amiri, A. Maroosi, Appli-cation of honey-bee mating optimization al-gorithm on clustering, Applied Mathematics and Computation 190 (2007) 15021513.
[10] P. J. Fioole, L. Kroon, G. Maroti, A. Schri-jver, A rolling stock circulation model for combining and splitting of passenger trains, European Journal of Operation Research 174 (2006) 12811297.
[11] S. Garcia, A. Fernandez, J. Luengo, F. Her-rera,Advanced nonparametric tests for mul-tiple comparisons in the design of experi-ments in computational intelligence and data mining: experimental analysis of power, In-formation Sciences 180 (2010) 20442064.
[12] Y. T. Kao, E. Zahara, I. W. Kao, A hy-bridized approach to data clustering, Ex-pert Systems with Applications 34 (2008) 17541762.
[13] U. Maulik, S. Bandyopadhyay, Genetic algorithm-based clustering technique, Pat-tern Recognition 33 (2000) 14551465.
[14] T. Niknam, B. Amiri,An efficient hybrid ap-proach based on PSO, ACO and k-means for cluster analysis, Applied Soft Computing 10 (2010) 183197.
[15] R. W. Po, Y. Y. Guh, M. S. Yang, A new clustering approach using data envelopment analysis, European Journal of Operational Research 199 (2009) 276284.
[16] R. G. Reynolds, Version Space Controlled Genetic Algorithms, In Proceedings of the Second Annual Conference on Artificial In-telligence Simulation and Planning in High Autonomy Systems (1991) 614.
[17] R. G. Reynolds,An Introduction to Cultural Algorithms, in: Proceedings of the Third An-nual Conference on Evolutionary Program-ming (1994) 131139.
[18] R. G. Reynolds, C. Chung,Knowledge-based Self-Adaptation in Evolutionary Program-ming using Cultural Algorithms, In Proceed-ings of the IEEE Congress on Evolutionary Computation (1997) 7176.
[19] P. S. Shelokar, V. K. Jayaraman, B. D. Kulkarni, An ant colony approach for clus-tering, Analytica Chimica Acta 509 (2004) 187195.
[20] C. S. Sung, H. W. Jin, A tabu-search-based heuristic for clustering, Pattern Recognition 33 (2000) 849858.