DEMOGRAPHIC RESEARCH
VOLUME 41, ARTICLE 45, PAGES 1277
-
1288
PUBLISHED 21 NOVEMBER 2019
https://www.demographic-research.org/Volumes/Vol41/45/ DOI: 10.4054/DemRes.2019.41.45
Descriptive Finding
Is a positive association between female
employment and fertility still spurious in
developed countries?
Takashi Oshio
© 2019 Takashi Oshio.
This open-access work is published under the terms of the Creative Commons Attribution 3.0 Germany (CC BY 3.0 DE), which permits use, reproduction, and distribution in any medium, provided the original author(s) and source are given credit.
1 Background 1278
2 Methods 1279
2.1 Data 1279
2.2 Analytic strategy 1280
3 Results 1280
4 Discussion 1284
5 Conclusions 1286
6 Acknowledgments 1286
Demographic Research: Volume 41, Article 45
Descriptive Finding
Is a positive association between female employment and fertility
still spurious in developed countries?
Takashi Oshio1
Abstract
BACKGROUND
The cross-sectional association between female employment and fertility across developed countries turned from negative to positive during the mid-1980s. The conventional view is that the observed positive association is spurious owing to country-specific heterogeneity.
OBJECTIVE
We revisit the validity of this view using recent data up to 2017 from 24 countries belonging to the Organisation for Economic Co-operation and Development (OECD).
METHODS
Based on the data downloaded from the OECD database, we estimate the time-series association between the female labor force participation rate (FLFP) and total fertility rate (TFR) by fixed-effects regression models, which can control for country-specific heterogeneity.
RESULTS
The more recent the data set used, the more likely it is that the time-series correlation will be positive between FLFP and TFR, even after controlling for country-specific heterogeneity. We also observe that public spending on families, especially in the form of benefits in kind, starts increasing once FLFP becomes sufficiently high.
CONCLUSIONS
A positive correlation between female employment and fertility in developed countries is no longer attributable to country-specific heterogeneity. The results are supportive of the view that higher female employment can make socioinstitutional contexts more favorable for childbearing, leading to a positive association between FLFP and TFR.
CONTRIBUTIONS
This study underscored the need for further investigation of the association between female employment and fertility, which is likely to have changed in recent decades.
1. Background
From an economic viewpoint, the increasing role of women in the labor market is expected to raise the opportunity cost of childbearing and thereby reduce fertility (Becker 1981). If this is correct, there should be a negative association between female employment and fertility. However, the cross-sectional association across developed countries turned from negative to positive during the mid-1980s (Ahn and Mira 2002; Apps and Rees 2004; Martínez and Iza 2004; Rindfuss, Guzzo, and Morgan 2003). This change has prompted a debate about the relevance of the perceived conflict in women about choosing between work and childcare.
Some researchers explain that the change in the association between female employment and fertility is attributable to the reduced incompatibility in women between the role of mother and worker (Rindfuss, Guzzo, and Morgan 2003), thereby increasing the availability of market childcare or childcare support (Ahn and Mira 2002; Apps and Rees 2004; Martínez and Iza 2004), as well as increasing the wages of working women (Ahn and Mira 2002).
In sharp contrast to these arguments, Kögel (2004) finds no positive association between female employment and fertility when using time-series data. He argues “the reversal in the sign of the cross-country correlation is most likely due to a combination of two elements: First, the presence of unmeasured country-specific factors and, second, country-heterogeneity in the magnitude of the negative time-series association between fertility and female employment” (Kögel 2004:46). He applies fixed-effects (FE) models to country-level time-series (quinquennial) data from countries belonging to the OECD by splitting the estimation period into two: 1960–1985 and 1985–2000. He shows that the time-series association between female employment and fertility remained negative, although the magnitude and significance level of this association declined after 1985.
Kögel’s (2004) observation reminds us that we should be cautious in interpreting any causality that changes the positive association between female employment and fertility observed from cross-country data. Indeed, it has been argued that both female employment and fertility tend to move in the same direction led by the third variable, which includes social norms and socioinstitutional background (Engelhardt, Kögel, and Prskawetz 2004) and that there could even be a long-run causality from fertility to female employment (Mishra and Nielsen 2010). Meanwhile, a comprehensive survey of micro-level studies (Matysiak and Vignoli 2008) stressed a significant change in the association between female employment and fertility over time.
Demographic Research: Volume 41, Article 45
the association between female employment and fertility would also turn from negative to positive once the level of female employment becomes sufficiently high, inspiring debate on their association, including some critical views on this turnaround (Furuoka 2009; Harttgen and Vollmer 2014).
The present study investigates whether a time-series association between the FLFP and TFR is positive even after controlling for country-specific fixed effects if the statistical analysis is based on more recent data than that used by Kögel (2004), who used data up to the year 2000. It is plausible to predict that the factors that are assumed to be fixed for each country in the FE models should not stay fixed over time in reality. We cannot rule out the possibility that a positive association between female employment and fertility in developed countries is no longer spurious.
2. Methods
2.1 Data
Two key variables in the present study were FLFP and TFR, whose data was downloaded from the databases of the OECD website (OECD 2019; OECD.Stat 2019). With respect to FLFP, we consider its value for women aged between 15 and 64 years following Kögel (2004) and many other studies. We use the annual data of 24 countries listed in Table 1. Of the 36 countries in the OECD, we exclude eight transition countries (Czech Republic, Estonia, Hungary, Latvia, Lithuania, Poland, Slovak Republic, and Slovenia), considering that their socioeconomic factors and social policies may differ substantially from traditional Western countries, and that the data for their countries is available only since the 1990s or later. We obtain similar results even if we include these countries (available from the author upon request). We further exclude three middle-income countries (Chile, Mexico, and Turkey) and Israel, whose TFR (3.11) was well above the OECD average (1.67) in 2017.
2.2 Analytic strategy
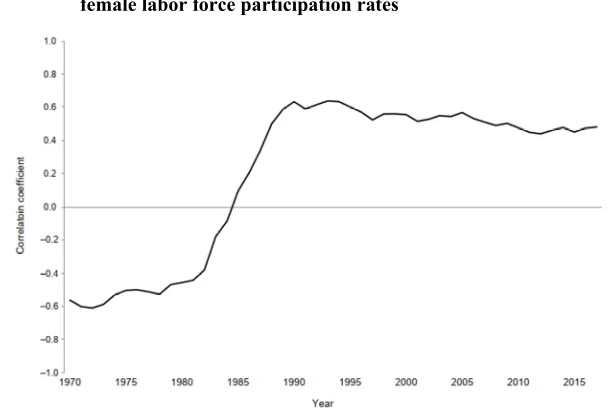
We first examine the evolution of annual cross-sectional correlations between FLFP and TFR. Then, we estimate two simple regression models to explain country-level TFR solely by FLFP: pooled ordinary least squares (OLS) and FE models.
We assume the association between FLFP and TFR is expressed as:
TFR = + FLFP + + ,
where i and t denote country and year, respectively, ui summarizes time-invariant,
country-specific effects, andεit is an error term. OLS models ignore country-specific
effects and hence cannot obtain an unbiased estimator ofβ. FE models include
country-specific effects and control for them assuming that they are correlated with FLFP, in contrast to random effects (RE) models, which assume that country-specific effects are uncorrelated with FLFP. OLS models with dummy variables for each country obtain the same results as FE models.
In the current study, the F test rejects the null hypothesis of the absence of
country-specific effects in all model specifications, confirming the preference of FE models to pooled OLS models. In addition, the Hausman test rejects the null hypothesis that country-specific effects are not correlated with FLFP, confirming the preference of FE models to RE models.
To examine how the FLFP-TFR correlation has been evolving since 1970, we
compare the estimated coefficients (β) of FLFP among six 20-year estimation periods:
1970–1989, 1975–1994, 1980–1999, 1985–2004, 1990–2009, and 1995–2017 (23 years for the last period), by sliding the starting year by five years each. We also graphically show how FLFP is associated with two types of public expenditure on families for reference: cash benefits and benefits in kind.
3. Results
Demographic Research: Volume 41, Article 45
Figure 1: Cross-sectional correlation coefficients between total fertility and female labor force participation rates
Note: Information about the countries and their numbers used to calculate the correlation coefficients are available upon request from the author.
Source: The author’s calculation is based on OECD (2019) and OECD.Stat (2019).
Table 1 summarizes TFR and FLFP in each estimation period and compares the
estimated coefficients (β) of FLFP in pooled OLS and FE models estimated to explain
TFR in each estimation period. We first observe that while FLFP has been steadily rising, TFR has remained almost flat since 1985–2004 after dropping in previous
periods. The estimatedβdemonstrates different evolutions between pooled OLS and FF
models; it turned from negative to positive in the pooled OLS model in 1980–1999, in
line with the results in Figure 1. Meanwhile, FE models reveal thatβ remained negative
until 1985–2004, with its magnitude showing a clear downtrend, and turned positive in 1990–2009.
To compare the results with those in Kögel (2004), we also estimated regression models using quinquennial data between 1960–1985 and 1985–2000 as his study did.
From 1960–1985 to 1985–2000,β turned from negative to positive (from –1.41 [0.48]
Table 1: Total fertility rate, female labor force participation rate (FLFP), and estimated coefficients (β) of FLFP in regression models to explain TFR in each estimation period
Estimation period TFR FLFP Pooled OLS Fixed effects N
M (SD) M (SD) β (SE) β (SE)
1970–1989 1.91 (0.46) 0.514 (0.124) –1.35 *** (0.20) –3.47 *** (0.33) 305
1975–1994 1.79 (0.36) 0.546 (0.124) –0.30 * (0.15) –2.16 *** (0.29) 361
1980–1999 1.70 (0.29) 0.576 (0.118) 0.42 *** (0.12) –1.71 *** (0.22) 412
1985–2004 1.65 (0.25) 0.604 (0.110) 1.00 *** (0.10) –0.67 *** (0.13) 450
1990–2009 1.65 (0.27) 0.632 (0.099) 1.40 *** (0.11) 0.29 * (0.12) 471
1995–2017 1.64 (0.26) 0.662 (0.088) 1.46 *** (0.11) 0.47 *** (0.10) 552
Notes: TFR: total fertility rate, FLFP: female labor force participation rate. ***p < 0.001, *p < 0.05
Source: The author’s calculation is based on OECD (2019) and OECD.Stat (2019).
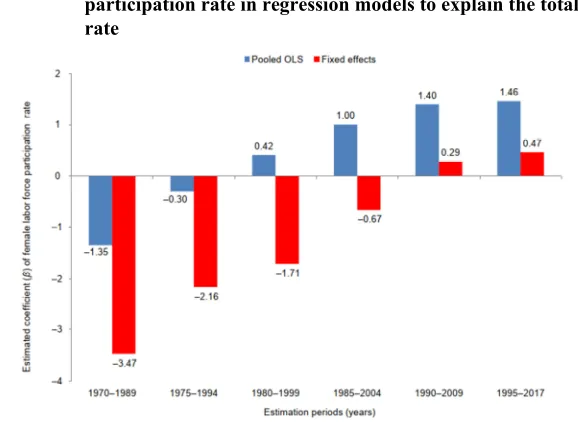
Figure 2 compares the estimated β between pooled OLS and FE models. The
estimated β shows a clear uptrend from negative to positive values in both models;
however, in 1980–1999 and 1985–2004,βwas positive in the pooled OLS model while
negative in the FE model.
Figure 2: Evolution of the estimated coefficients (β) of the female labor force participation rate in regression models to explain the total fertility rate
Note: Based on the results presented in Table 1.
Demographic Research: Volume 41, Article 45
The results presented in Table 1 and Figure 2 suggest long-term, structural changes in the relationship between FLFP and TFR. To graphically illustrate them, Figure 3 plots the dots of their combinations in each year and country using 24-country data pooled in 1970 and 2017. To roughly capture the evolution over time, we color the combinations observed in the first 35 years (1970–2004) and those observed in the remaining 13 years (2005–2017) in blue and red, respectively. The figure also includes a fitted quadratic curve, which shows a U-shaped relationship between FLFP and TFR, like the turnaround of the HDI-TFR correlation observed in Myrskylä, Kohler, and Billari (2009). The U curve bottoms out when the FLFP is around 0.6, which is the FLFP’s threshold to reverse the FLFP-TFR correlation from negative to positive.
Figure 3: Female labor force participation and total fertility rates
Notes: Data of 24 countries pooled in 1970–2017 (N = 968) are used. The fitted quadratic curve is given by TFR = 4.42 (0.19) – 9.29 (0.68) FLFP + 7.70 (0.58) FLFP2,
R2-adjusted = 0.167, and it is estimated to bottom when FLFP = 0.60 (0.06), where the figures in the parentheses are standard errors.
Source: Based on OECD (2019) and OECD Social Expenditure Database (2019).
Figure 4: Female labor force participation rate and public expenditure on families
Notes: Data of 24 countries pooled in 1980–2016 (N= 792) are used. The fitted quadratic curve is given by benefits = 0.59 (0.41) – 1.32 (1.41) FLFP + 3.02 (1.17) FLFP2,R2-adjusted = 0.125, where the figures in the parentheses are standard errors.
Source: Based on OECD Social Expenditure Database (SOCX) (2019).
4. Discussion
We examine the time-series association between FLFP and TFR in developed countries using a 24 country-level annual data from 1970 to 2017 and obtain two key findings. First, the more recent the data set used, the more likely it is that the time-series association will be positive between FLFP and TFR, even after controlling for country-specific heterogeneity. This observation differs from the results of Kögel (2004), who stresses that the time-series association between female employment and fertility remained negative. This difference can be explained by the difference in the estimation periods; he covers 1960–2000, while the current study covers a more recent period: 1970 to 2017. Thus, using the recent dataset, there is now no inconsistency between cross-country and time-series observations; both indicate a positive association between FLFP and TFR.
Demographic Research: Volume 41, Article 45
of the sign of their association obtained from the FE models highlights the importance of the change in country-specific factors that are assumed to be fixed during the estimation period. The evaluation of the observed correlation between FLFP and TFR depends heavily on the observation time and period. Consistently, the FLFP-TFR correlation observed in the pooled cross-country data in 1970–2017 reveals that it turned from negative to positive when FLFP exceeded a certain level, which is around 0.6 according to the dataset used in this study. In many countries, LFP exceeded that level during the 1980–1990s, when the FLFP-TFR correlation observed in time-series data turned from negative to positive.
This study does not identify the factors that caused the change in the relationship between FLFP and TFR. However, the results suggest that the socioinstitutional background has gradually become more favorable to women trying to balance work and childbearing. Specifically, we observe that public expenditure on families, especially in the form of benefits in kind, started increasing once FLFP reached 0.5–0.6, which is largely consistent with the upturn of the FLFP-TFR correlation. These findings are consistent with Kalwij’s (2010) finding of positive effects on TFR of expenditure on family policy programs. The observations are also supportive of the view that higher female employment, which gradually transforms socioinstitutional contexts to become more favorable for childbearing, eventually reverses the sign of the FLFP-TFR association.
It should be noted that the present study has several limitations and issues to be addressed in future studies. First, we use the period TFR mainly because of data availability in the OECD dataset and comparability with earlier research, but it may not be the most reliable indicator of fertility for this type of analysis (Bongaarts and Feeney 2010; Sobotka and Lutz 2010). It would be more convincing to examine how FLFP has been associated with cohort or tempo-adjusted TFR, if their data are available, rather than assuming the hypothetical cohort that is supposed to present current fertility conditions.
Second, our analytic methodology has much room for improvement. For example, we focus only on FLFP as a regressor to explain TFR and hence we cannot rule out the possibility that the estimation results may have biases due to omitted variables. In addition, it is up to further research to study whether time-specific fixed effects or their interaction with country-specific fixed effects confound the FLFP-TFR association, because we consider only country-specific fixed effects.
childbearing, division of labor within families, or employers’ commitment to support childcare are likely to have affected TFR (Engelhardt, Kögel, and Prskawetz 2004).
Fourth, sustainability of the positive association between FLFP and TFR remains to be investigated even if it does not indicate any causality. Partly reflecting macroeconomic conditions, TFR has apparently been leveling off in developed countries in recent years. Additionally, the average age of women giving birth has
increased ‒ from 27.4 years in 1970 to 30.6 years in 2016, the OECD average (OECD
Family Database 2019) ‒ and this may eventually limit the rise in TFR, as well as the
effects of policy measures to enhance fertility. Hence, a simple extrapolation of the recent positive association between FLFP and TFR cannot be justified for fertility projection.
5. Conclusions
The present study confirmed the positive association between female employment and fertility, even after controlling for country-specific heterogeneity. In this sense, the observed cross-country association cannot be considered spurious any longer. We cannot exclude the possibility that higher female employment can make socioinstitutional contexts more favorable for childbearing, leading to a positive association between FLFP and TFR. Overall, this study underscored the need for further investigation of the association between female employment and fertility, which is likely to have changed in recent decades.
6. Acknowledgments
Demographic Research: Volume 41, Article 45
References
Ahn, N. and Mira, P. (2002). A note on the changing relationship between fertility and
female employment rates in developed countries. Journal of Population
Economics15(4): 667–682.doi:10.1007/s001480100078.
Apps, P. and Rees, P. (2004). Fertility, taxation and family policy. Scandinavian
Journal of Economics 106(4): 745–763.doi:10.1111/j.0347-0520.2004.00386.x. Balbo, N., Billari, F.C., and Mills, M. (2013). Fertility in advanced societies: A review
of research.European Journal of Population 29(1): 1–38.
doi:10.1007/s10680-012-9277-y.
Becker, G.S. (1981).A treatise on the family. Cambridge: Harvard University Press.
Bongaarts, J. and Feeney, G. (2010). When is a tempo effect a tempo distortion?Genus
66(2): 1–15.
Engelhardt, H., Kögel, T., and Prskawetz, A. (2004). Fertility and women’s employment reconsidered: A macro-level time-series analysis for developed
countries, 1960–2000.Population Studies 58(1): 109–120.doi:10.1080/0032472
032000167715.
Furuoka, F. (2009). Looking for a J-shaped development-fertility relationship: Do
advances in development really reverse fertility declines? Economics Bulletin
29(4): 3067–3074.
Harttgen, K. and Vollmer, S. (2014). A reversal in the relationship of human
development with fertility?Demography 51(1): 173–184.
doi:10.1007/s13524-013-0252-y.
Kalwij, A. (2010). The impact of family policy expenditure on fertility in Western
Europe.Demography 47(2): 503–519.doi:10.1353/dem.0.0104.
Kögel, T. (2004). Did the association between fertility and female employment within
OECD countries really change its sign?Journal of Population Economics 17(1):
45–65.doi:10.1007/s00148-003-0180-z.
Martínez, D.F. and Iza, A. (2004). Skill premium effects on fertility and female labor
force supply. Journal of Population Economics 17(1): 1–16. doi:10.1007/s0
0148-003-0150-5.
Matysiak, A. and Vignoli, D. (2008). Fertility and women’s employment: A
meta-analysis.European Journal of Population 24(4): 363–384.
Mishra, V. and Nielsen, S.R. (2010). On the relationship between female labour force participation and fertility in G7 countries: Evidence from panel cointegration and
Granger causality. Empirical Economics 38(2): 361–372.
doi:10.1007/s00181-009-0270-1.
Myrskylä, M., Kohler, H.-P., and Billari, F.C. (2009). Advances in development reverse
fertility declines.Nature 460(7256): 741–743.doi:10.1038/nature08230.
OECD (2019). Fertility rates (indicator).https://data.oecd.org/pop/fertility-rates.htm.
OECD Family Database (2019).http://www.oecd.org/els/family/database.htm.
OECD Social Expenditure Database (SOCX) (2019). http://www.oecd.org/social/
expenditure.htm.
OECD.Stat (2019).https://stats.oecd.org/.
Rindfuss, R.R., Guzzo, K., and Morgan, S.P. (2003). The changing institutional context
of low fertility. Population Research and Policy Review 22(5–6): 411–438.
doi:10.1023/B:POPU.0000020877.96401.b3.
Sobotka T. and Lutz, W. (2010). Misleading policy messages derived from the period