Iranian Journal of Fisheries Sciences 13(1)47-57 2014
Catch per unit area of Batoid fishes in the Northern Oman
Sea
Ghotbeddin N.
1*, Javadzadeh N
1, Azhir M.T.
2Received: February 2013 Accepted: November 2013
Abstract
We report on results of a trawl survey to assess the abundance of Batoid fish resources in the Oman Sea. The catch per unit area CPUA as the main index was estimated. The objectives of this study were to determine the catch composition and distribution pattern of Batoid fishes in the study area and in different depth strata of the Oman Sea.A total of 82stations were randomly selected 2012. The comparison between 5 strata indicated that, the highest CPUA was found for strata E, Beris to Gowatr (2712.56 kg / nm2) and C, Gordim to Konarak (2079.17 kg / nm2) and the lowest one was found in stratum B, Darak to Tang (27.11 kg / nm2). Also the comparison of mean CPUA in different depth-layers revealed that the mean CPUA has a descending trend with increasing of depth, in which the CPUA values in depth layer 10-20 m were 101.38 times more than depth layer 50-100m.
Keywords: Batoids fishes, CPUA, Distribution, Oman Sea
1-Department of Fisheries, College of Natural Resources, KhouzestanScience and Research Branch, Islamic Azad University, Ahwaz, Iran
2- Coldwater Fishes Research Center, Regional Lead Center of NACA, Tonekabon, Iran. P.O:46815-467 *Corresponding author's email: Ghotbeddiny2005@gmail.com
Introduction
The Oman Sea, with an area of 94,000 km2 and a depth reaching 3,200 m, can be assumed to be oceanic in its nature as it is connected to the Indian Ocean by the Arabian Sea.The topography of the bottom is mostly flat and featureless, dominated by soft sediments, with a few rocky areas in the Oman Sea. A review of fisheries statistics based on research cruises shows an increasing trend of fishing effort in the Oman Sea during the last decade (Reynolds, 1993; Valinassab et al., 2006).
Trawl nets are the most common type of gear in the Oman Sea and are principally used for commercial fishing of demersal fishes (Valinassab et al., 2004, 2008). In this region, trawl catches are composed of a highly diversified mix of fish, cephalopods, and crustacean, since the trawls that are used are not very selective (Valinassab et al., 2004, 2008). Batoids are important fishes, which enter the nets but they are discarded to the sea. However, proper planning can help reduce them in the community's economy basket.
Although some investigations have documented the CPUA or biomass of many different fishes in the Persian Gulf and Oman
Sea (Sivasubramaniam, 1981; IFRO Experts Group, 1996; Daryanabard et al., 2004; Dehghani et al., 2004; Valinassab et al., 2003, 2004, 2006, 2011), not enough research have been conducted on the catch composition and CPUA of Batoids’ species in the Oman Sea. The objectives of this study were to determine the catch composition and distribution pattern of Batoids in the study area and in different strata and depth layers of the Oman Sea.
Materials and methods
The sampling area was restricted to the area of 58˚ 55´E to 61˚ 25´ E, 24˚ 50´ to 25˚ 15´ N, in the northern Oman Sea in which was stratified into 5 strata A, B, C, D and E (Table 1, Fig.1). Each stratum was classified into four depth layers of 10-20, 20-30, 30-50 and 50-100m. A total of 82 stations were randomly selected (Table 1) 2012. The samplings were carried out by F/V Kavian equipped with fish bottom-trawl net (mesh size of cod end 80mm and headline 72m). At each station, one-hour haul was taken at speed of 3 knots. The total catch was emptied on board and then all Batoid fishes were separated, counted and weighed.
Iranian Journal of Fisheries Sciences 13(1) 2014 49
Figure 1: Map of sampling area along the Oman Sea2012
Table 1:Coordinates of area samples
Number of
stations Area (nm2)
Longitude Sampling area
Stratum
13 115.99
55°58E- 59°25E Biahi, Meidani, Rabech, Galak
A
9 180.93
59°25E- 59°55E Darak, Makisar, Tang
B
19 235
59°55E- 60°25E Gordim, Rashedi, Pozm,
C
18 268.5
60°25E- 60°55E Konarak, Chabahar, Ramin, Lipar
D
23 363.8
60°55E- 61°25E Beris, Zarinsar, Pasabandar,
Gowatr E
The swept area (a) or the effective path swept for each hauling was estimated thus:
a= D.h.X
Where h is the length of the headline (m) and D is the towing distance. X is wingspread coefficient. The value of X varies from 0.40 to 0.66. It is suggested that X=0.65 is the best compromise value for the Oman Sea (Proposed by Valinssab et al., 2006 for the multi-species demersal group in tropical and subtropical areas).
The CPUAs were estimated for different strata and depth layers based on following equation (Sparre and Venema, 1992; Valinassab et al., 2006):
CPUA= Cw/a Where:
CPUA= Catch Per Unit Area (kg/nm2)
Cw= Catch weight (kg) and a is swept area (nm2)
Statistically, according to Kolmogorov-Smirnov test there was no normal distribution in CPUA values for bathoids, therefore the non-parametric test of Kruscal-Wallis was used to determine any significant difference between strata and depth layers; and if there was found significant differences, then Man-Whitney test was applied for comparing the mean CPUA for different strata and depth layers. The Natural log transform was applied
to normalize the CPUA data; and then One-way ANOVA and Tukey tests were used to determine any significant differences between calculated values for different strata or depth layers. Also, the Arc-GIS software (Version 9.2) was used for preparing the distribution pattern maps accompany with Inverse Distance Method.
Results
In the present study, we identified 10 species belong to 3 families of Myliobatidae,Dasyatidae and Torpedinidae as follows: Torpedo sinuspersici, Himantura
uarnak, H. gerrardi, H. walga, Pastinachus
sephen, Dasyatis bennetti, Aetobatus
narinari, Aetomylaeus maculatus, A.
nichofii, and Rhinoptera javanica. The mean
catch per unit area (CPUA) values for the strata and different depth layers are given in Tables 2, 3 and Figures 2, 3 and also the one-way analysis of variance for different depth layers and strata among the species are given in Table 4.
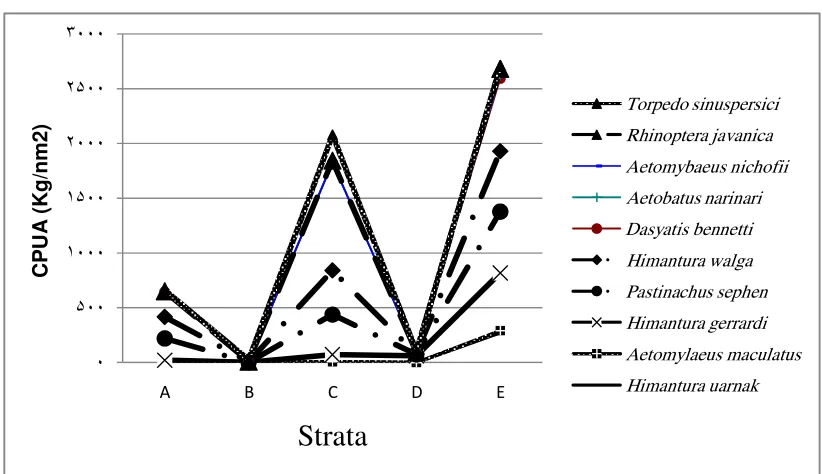
Mean CPUA for all Batoids was estimated as 5337.06 kg/nm2 (Tables 2, 3). CPUA was found in strata E (2712.56 kg/nm2) and C (2079.17 kg/nm2) and minimum value was found in stratum B (27.11 kg/nm2), respectively.
Iranian Journal of Fisheries Sciences 13(1) 2014 51
Table 2: Mean CPUA (kg/nm2) for each strata and different identified species
Species A SD B SD C SD D SD E SD Total SD
Himantura uarnak 10.51 0.00 2.00 0.00 6.26 2.85 0.06 0.00 272.47 57.85 291.3 11.82
Aetomylaeus maculatus 0.47 0.00 0.00 0.00 0.00 0.00 0.30 0.00 18.88 3.80 19.65 0.36
Himantura gerrardi 10.62 16.72 0.00 0.00 65.43 26.57 61.20 12.70 526.13 58.97 663.38 11.89
Hypolophus sephen 199.40 65.04 0.00 0.00 366.41 75.33 11.86 2.05 560.52 88.49 1138.19 35.40
Himantura walga 195.32 53.86 6.84 0.00 402.78 73.48 4.86 1.01 552.53 75.25 1162.33 45.66
Dasyatis bennetti 230.26 66.96 0.00 0.00 985.46 101.83 11.97 1.38 663.86 82.42 1891.55 21.84
Aetobatus narinari 0.00 0.00 0.00 0.00 0.48 0.00 0.00 0.00 34.42 9.17 34.90 5.34
Aetomybaeus nichofii 4.95 1.66 0.00 0.00 1.60 0.00 0.00 0.00 0.00 0.00 6.55 0.85
Rhinoptera javanica 0.00 0.00 0.00 0.00 15.20 0.00 4.51 0.00 51.84 7.38 71.55 11.88
Torpedo sinuspersici 9.59 2.97 18.27 16.20 235.55 72.63 10.00 5.71 31.92 4.20 305.33 43.96
Total 661.12 27.11 2079.17 104.76 2712.57 5337.06
Table 3: Mean CPUA (kg/nm2) for different depth layers among the species
Species 10-20m SD 20-30m SD 30-50m SD 50-100m SD Total SD
Himantura uarnak 111.92 19.10 348.24 75.06 0.09 0.00 0.00 0.0 460.25 64.15
Aetomylaeus maculatus 19.32 3.45 0.45 0.00 0.00 0.00 0.00 0.0 19.77 2.59
Himantura gerrardi 582.49 0.00 40.48 7.35 48.94 6.77 0.00 0.0 671.91 77.17
Hypolophus sephen 818.97 101.26 100.82 14.78 6.32 1.03 8.43 0.0 934.54 89.70
Himantura walga 779.02 77.30 149.72 23.53 79.34 20.52 2.73 0.0 1010.81 155.97
Dasyatis bennetti 1000.88 197.91 213.99 42.78 605.09 0.00 2.02 1.0 1821.98 122.13
Aetobatus narinari 0.27 0.00 60.50 11.69 10.08 0.00 0.00 0.0 70.85 14.91
Aetomybaeus nichofii 0.74 0.00 0.63 0.00 0.00 0.00 1.26 0.1 2.63 0.52
Rhinoptera javanica 5.54 0.83 0.00 0.00 96.93 12.70 10.54 0.3 113.01 12.99
Torpedo sinuspersici 168.22 56.74 46.63 7.37 7.05 1.12 9.38 1.9 231.28 35.80
Total 3487.37 961.46 853.84 34.36 5337.03
Iranian Journal of Fisheries Sciences 13(1) 2014 53
Table 4: One-way analysis of variance for different depth layers and strata among the species
Species Depth layers Strata Depth layers &Strata
Himantura uarnak 0.29 0.03 0.10
Aetomylaeus maculatus 0.02 0.16 0.03
Himantura gerrardi 0.06 0.03 0.34
Hypolophus sephen 0.25 0.31 0.00
Himantura walga 0.09 0.01 0.03
Dasyatis bennetti 0.04 1.00 0.1
Aetobatus narinari 0.00 0.10 0.00
Aetomybaeus nichofii 0.03 0.21 0.02
Rhinoptera javanica 0.17 0.00 0.61
Torpedo sinuspersici 0.01 0.00 0.27
Figure 2: Mean CPUA (kg/nm2) of batoid species in proportion of different strata
٠ ٠٠ ١٠٠٠ ١٠٠ ٢٠٠٠ ٢٠٠ ٣٠٠٠
A B C D E
C
P
U
A
(
K
g
/n
m
2
)
Strata
Torpedo sinuspersici Rhinoptera javanica Aetomybaeus nichofii Aetobatus narinari Dasyatis bennetti Himantura walga Pastinachus sephen Himantura gerrardi Aetomylaeus maculatus Himantura uarnak
\
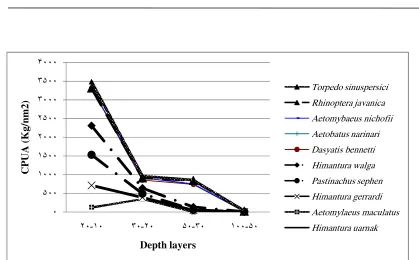
Figure 3: Mean CPUA (kg/nm2) of Batoid species in proportion of different depth layers
The CPUA was relatively high (3487.37 kg/nm2) in 10-20m depth layer and markedly lower in the deepest study layer (50-100m, 34.38 kg/nm2) (Table 3).The meanCPUA in depthlayerrepresentsa declinewith increasing the depth. The rate of it in 10-20m depth layer is 101.44 times higher than that in the depth of 50-100m.
Monitoring the demersal resources of the Oman Sea in the present study showed the highest rates in strata E (Beris, Zarinsar, Pasabandar, Gowatr) and C (Gordim, Rashedi, Pozm, Konarak) and with the lowest values in stratum B (Darak, Makisar, Tang).
Amongst all identified species in the bottom trawl catches (Tables 2, 3), Dasyatis bennetti showed the highest CPUA (1821.99 kg/nm2) with 31.73% in all depth and (1891.54kg/nm2) with 33.87% in all strata.
Discussion
Sustainability, in both ecological and socio-economic senses, is now recognized as the essential feature of the exploitation of living marine resources. A rational and long-term approach to management is necessary to achieve sustainable and successful exploitation (Jennings et al., 2001). For this to be achieved it is essential to monitor the status of the resource, including the collection of biological data. Biomass and CPUA estimates are commonly used as stock indices for management of demersal resource species (Sparre and Venema, 1992).
In this study, 10 species belongs to 3 families were identified. In recent years, all of the species in the current study have also been reported by Dehghani et al. (1996). Among the species, Dasyatis bennetti had the highest
٠ ٠٠ ١٠٠٠ ١٠٠ ٢٠٠٠ ٢٠٠ ٣٠٠٠ ٣٠٠ ٠٠٠ ١٠ -٢٠ ٣٠ -٢٠ ٠ -٣٠ ١٠٠ -٠ C P U A ( K g /n m 2 ) Depth layers Torpedo sinuspersici Rhinoptera javanica Aetomybaeus nichofii Aetobatus narinari Dasyatis bennetti Himantura walga Pastinachus sephen Himantura gerrardi Aetomylaeus maculatus Himantura uarnak
Iranian Journal of Fisheries Sciences 13(1) 2014 55
catch rate (31.73%) in different depth layers and (33.87%) in strata.
Monitoring of demersal resources of the Oman Sea in this study demonstrated the highest values in strata E (Beris, Zarinsar, Pasabandar, Gowatr) and C (Gordim, Rashedi, Pozm, Konarak) and the lowest rates in stratum B (Darak, Makisar, Tang, Meidani) . The results of CPUA of rays during 2003-2008 revealed that the value of this index in the Oman Sea, excluding 2005, remained constant in most years (Valinassab et al., 2011). Their study also indicated that the strata K and Q (located on the extreme eastern and western basins) showed the maximum density of the fish in most years, and stratum N (Darak, Makisar, Tang and Meidani) and stratum L (from Jask to Meidani) respectively in 2004 and 2008 were in good condition from the rays (Valinassab et al., 2011). Sivasubramaniam (1981) reported the great increase in abundance of groups such as rays and catfish over the last two decades in the Persian Gulf and Oman Sea. Possible reasons for the occurrence of such differences are given below:
(a)The effect of previous climate changes and occurrence of Gonu Typhoon in the region
happened in2010
(www.meinsurancereview.com).
(b)Haul number: in the present study, the number of hauls considered (n=82) was much lower than in the (Valinassab et al., 2011) surveys (n=117).
(c) Different stations: in the Valinassab et al. (2011) surveys, they covered all of the Oman Sea, but in the present study, we did
not have any sampling in strata K (from Sirik to Jask) and L (from Jask to Meidani). The maximum CPUA are found in the shallow waters of 10-20m, with a descending trend with increasing the depth. The comparison between CPUA of rays in the deep layers of the Oman Sea clear that the deep layer of 20-30m in 2003 and 2006 and the deep layer of 30-50m in 2004 and 2007 were the highest CPUA of rays (Valinassab et al., 2011). In 2002, the maximum density of rays showed in 10-20m deep layer (Valinasab et al., 2004) and also in 2003, the maximum biomass of demersal resources showed in 10-20m deep layer in Oman Sea (Daryanabard et al., 2004; Dehghani et al., 2004). In general, it can be mentioned that the depth of 10-50m of the Oman Sea was always in good condition of the rays and the minimum density of them have been observed in deep layers of 50-100m.
In the current study, hyper stability was not detected. Thus, the catch per unit area in 5 strata by species can be considered to be an indication of stock abundance. In order to achieve sustainable exploitation of this marine resource, these stocks should be regularly monitored, as well as the predator-prey relationships, The spawning and nursery grounds, growth and mortality parameters should be determined to gain sufficient knowledge to manage these stocks effectively. Thus, it is necessary to study these factors for planning an effective management strategy the can be recommended to the executive organizations.
Acknowledgments
This article was extracted from research project as “A survey on diversity, distribution and frequency of ray fishes in the Iranian waters of the Oman Sea”. Its budget was provided by Science and Research Branch, Islamic Azad University, Khuzestan, Iran. In this way, we appreciate them. Also we would appreciate for all cooperation and advice of Prof. T. Valinassab.
Reference
Dayanabard, G., Hosseini, A. and Valinassab, T.,
2003.Biomass estimation of demersal resources in Oman Sea (Sistan-o- Balochestan Province) by Swept Area Method.Iranian Fisheries Research Organization, 161P. (in Persian) Dehghani, R., Kamali, E., Darvishi, M., Behzadi,
S. and Valinassab. T., 1996. Stock assessment of Demersal Resources in the Persian Gulf. Iranian Fisheries Research Organization, 98P. (in Persian).
Dehghani, R., Valinassab, T., Kamali, A.,
Darvish, M., Behzadi, S., Asadi, H. and
Akbari, H., 2003. Monitoring of demersal resources by swept area method in Hormuzgan Province. Persian Gulf and Oman Sea Ecological Research Center, 89P. (in Persian)
Jennings, S., Kaiser, M. J. and Reynolds, J. D.,
2001.Marine fisheries ecology. Oxford: Fishing News Books, 391P.
IFRO Experts Group, 1996. Biomass estimation of demersal resources within the Persian Gulf waters. Final Report, Tehran, Iran:Iranian Fisheries Research Organization, 72P. (in Persian)
Reynolds, R. M., 1993. Physical oceanography of the Gulf, Strait of Hormuz, and the Gulf of
Oman: results from the Mitchell Expedition. Marine Pollution Bulletin, 27, 35-60.
Sivasubramaniam, K., 1981. Demersal Resources of the Gulf and Gulf of Oman. Regional Fishery Survey and Development Project. Rome: UNDP/FAO, 122P.
Sparre, P. and Venema, S. C., 1992.Introduction to tropical fish stock assessment. Part: 1, manual FAO Fisheries Technical Paper, 376P.
Valinassab, T., Daryanabard, R. and Dehghani,
R., 2003. Monitoring of demersal resources by swept area method in the Oman Seawaters. Final Report. Tehran, Iran: Iranian Fisheries Research Organization, 105P. (in Persian) Valinassab, T., Dehghani, R., Kamali, A. and
Khorshidian, K., 2004.Monitoring of demersal resources by swept area method in the Oman Seawaters (2002). Final Report. Tehran, Iran:
Iranian Fisheries Research Organization, 121P.(in Persian)
Valinassab, T., Azhir, M. T., Momeni, M.,
Mobarezi, A., Safikhani, H. and
Daryanabard, R., 2008. Biomass estimation of demersal resources in the Persian Gulf and Oman Sea by Swept Area Method (2004-2008). Iranian Fisheries Research Organization, 332P. (in Persian)
Valinassab, T. Daryanabard, R., Dehghani, R.
and Pierce, G. J., 2006. Abundance of demersal fish resources in the Persian Gulf and Oman Sea.Journal of Marine Biological Association of the United Kingdom, 86, 1455-1462.
Valinassab, T., Dehghani, R. Kamali,
A.Khorshidian, K. Behzadi, S. Darvishi, M.
and Salarpouri, A., 2011. Monitoring of demersal resources by swept area method in the Persian Gulf and Oman Seawaters. Final
Iranian Journal of Fisheries Sciences 13(1) 2014 57
Report. Tehran, Iran: Iranian Fisheries Research Organization, 349P. (in Persian)
www.meinsurancereview.com