Volume 57, 2018, Pages 26–35
LPAR-22. 22nd International Conference on Logic for Programming, Artificial Intelligence and Reasoning
Wayeb: a Tool for Complex Event Forecasting
Elias Alevizos
13, Alexander Artikis
21, and Georgios Paliouras
11
NCSR Demokritos, Athens, Greece
{alevizos.elias,a.artikis,paliourg}@iit.demokritos.gr
2
University of Piraeus, Piraeus, Greece
3 National Kapodistrian University of Athens, Athens, Greece
Abstract
Complex Event Processing (CEP) systems have appeared in abundance during the last two decades. Their purpose is to detect in real–time interesting patterns upon a stream of events and to inform an analyst for the occurrence of such patterns in a timely manner. However, there is a lack of methods for forecasting when a pattern might occur before such an occurrence is actually detected by a CEP engine. We present Wayeb, a tool that attempts to address the issue of Complex Event Forecasting. Wayeb employs symbolic automata as a computational model for pattern detection and Markov chains for deriving a probabilistic description of a symbolic automaton.
1
Introduction
2
Forecasting with Classical Automata
In order to allow for a self–contained presentation, we begin by briefly describing how our proposed method works with classical automata (for details, see [1]). In this case, we assume that the streamS =t1, t2,· · · is sequence of symbols from a finite alphabet Σ = {e1, ..., er}, i.e., ti ∈ Σ. A pattern is defined as a (classical) regular expression R and the usual tools of standard automata theory may be employed [16]. The finite automaton used for event detection is the one corresponding to the expression Σ∗·R (·denotes concatenation and∗ Kleene–star), since it should work on streams and be able to start the detection at any point. Appending Σ∗ at the beginning allows the automaton to skip any number of events. As a next step, we construct the deterministic finite automaton (DFA) for Σ∗·R, DFAΣ∗·R. This allows us to convertDFAΣ∗·Rto a Markov chain. If we assume that the stream is composed of i.i.d. events from Σ, then the sequence Y =Y0, Y1, ..., Yi, ..., where Y0 =q0 and Yi = δ(Yi−1, ti), with q0
the automaton’s start state andδits transition function, is a 1-order Markov chain [21]. Such a Markov chain, associated with a patternR, is called a Pattern Markov Chain (PMC). The transition probability between two states connected with the symbolejis simply its occurrence probability,P(Xi=ej). If we assume that the process generating the stream is of a higher order m≥1, then we must first convertDFAΣ∗·R to anm–unambiguous DFA, i.e., to an equivalent DFA where each state can “remember” the lastmsymbols. This can be achieved by iteratively duplicating those states ofDFAΣ∗·R for which we cannot unambiguously determine the lastm symbols that can lead to them and then convert it to a PMC, denoted byPMCRm[20,21].
After constructing PMCm
R, we can estimate its time distributions. The waiting-time WR(q) for each non–final state q of DFAΣ∗·R is a random variable, defined as the number of transitions until DFAΣ∗·R visits for the first time one of its final states: WR(q)=inf{n:Y0,Y1, ...,Yn,Y0=q,q∈Q\F,Yn∈F}. We compute the distribution of WR(q) by converting each state ofPMCm
R that corresponds to a final state of the DFA into an absorbing
state and then re–organizing the transition matrix as follows:Π=
N(l−k)×(l−k) C(l−k)×k
0k×(l−k) Ik×k
,
assuming PMCm
R has a total of l states, k of which are final. N holds the probabilities for all the possible transitions between (and only between) the non-final states, whereas C
holds the transition probabilities from non-final to final states. Then, the probability for the time index n when the system first enters the set of absorbing states is given by [12]: P(Yn ∈ A, Yn−1 ∈/ A, ..., Y1 ∈/ A | ξinit) = ξTNn−1(I−N)1 , where A denotes the set of absorbing states,ξinit is the initial distribution on the states andξ consists of the l−k ele-ments of ξinit corresponding to non-absorbing states. Since, in our case, the current state of DFAΣ∗·R is known, the vectorξT
init would have 1.0 as the value for the element corresponding to the current state (and 0 elsewhere). ξchanges dynamically as the DFA/PMC moves among its various states and every state has its ownξ, denoted byξq:
ξq(i) = (
1.0 if row iofN corresponds to stateq
0 otherwise
The probability ofWR(q) is then given by: P(WR(q) =n) =ξqTNn−1(I−N)1
The transition matrix Π is learnt using the maximum-likelihood estimators for its elements [3]: ˆπi,j =
ni,j
P
k∈Qni,k =
ni,j
ni whereni denotes the number of visits to state i, ni,j the number
0
start a 1 b 2 b 3 b 4
a a
a
b
b a
(a) DFA.
1 2 3 4 5 6 7 8 9 10 11 12
Number of future events
0 0.2 0.4 0.6 0.8 1
Completion Probability
state:0 state:1 interval:3,8 state:2 state:3
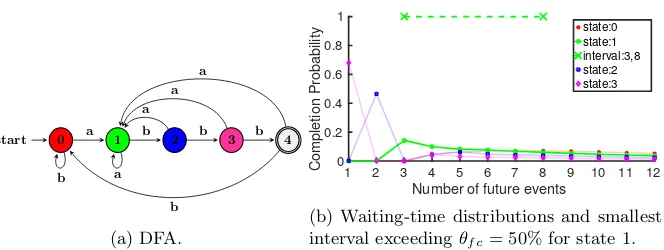
(b) Waiting-time distributions and smallest interval exceedingθf c= 50% for state 1.
Figure 1: DFA and waiting-time distributions forR=a·b·b·b, Σ ={a, b},m= 0.
its meaning is the following: given that the DFA is in a certain state, we forecast that it will have reached one of its final states at some future point betweenstartandend, with probability at leastθfc. The calculation of this interval is done by using the waiting-time distribution that corresponds to each state and the thresholdθfcis set beforehand by the user. We use a single-pass algorithm in order to scan the distribution of each state and find the smallest interval whose probability, i.e., the sum of probabilities of points included in the interval, exceedsθfc. In this paper, we assume stationarity, thus waiting–time distributions are computed once, after matrix estimation. An example of how forecasts are produced is shown in Figure1. Figure1a
shows a simple DFA that can detect the patternR =a·b·b·b on a stream composed of a andb events. For its four non-final states, Figure1bshows their corresponding waiting–time distributions. For state 1, this figure also shows the forecast interval produced by scanning the corresponding (green and highlighted) distribution, whenθf c= 50%. If the DFA moves to another state, then another distribution will be activated and a different forecast interval will be produced (these other intervals are not shown to avoid cluttering).
3
Forecasting with Symbolic Automata
One limitation of the method presented above is that it requires a finite alphabet, i.e., the input stream may be composed only of a finite set of symbols; on the other hand, events in a stream are in the form of tuples and look more like data words. Their attributes might be real–valued, taking values from an infinite set, and thus cannot be directly handled by DFA. In order to overcome this limitation, we have extended our method so that symbolic automata are employed [26,10]. Symbolic automata, instead of having symbols from a finite set on their transitions, are equipped with predicates from a Boolean algebra, acting as transition guards. Such predicates can reference any event attribute, thus allowing for more expressive patterns.
We now present a formal definition of symbolic automata (for details, see [10]).
Definition 1 (Symbolic Automaton). A symbolic finite automaton (SFA) is a tuple M =(A,Q,q0,F,∆), whereAis an effective Boolean algebra, Qis a finite set of states,q0∈Q is the initial state, F ⊆ Q is the set of final states and ∆ ⊆ Q×ΨA×Q is a finite set of
transitions, withΨAbeing s set of predicates closed under the Boolean connectives.
a state to have different predicates. We require that predicates on transitions from the same state are mutually exclusive, i.e., at most one may evaluate to TRUE (see again [10]). The determinization process forSFA is similar to that for classical automata and is based on the construction of the power–set of the states of the non–deterministic automaton. Due to this issue of different predicates possibly both evaluating toTRUEfor the same event/tuple, we first need to create theminterms of the predicates of aSFA, i.e., the set of maximal satisfiable Boolean combinations of such predicates. When constructing a deterministicSFA, these minterms are used as guards on the transitions, since they are mutually exclusive.
This result about SFAbeing determinizable allows us to use same technique of converting a deterministic automaton to an m–unambiguous automaton and then to a Markov chain. First, note that the set of minterms constructed from the predicates appearing in aSFA M, denoted byMinterms(Predicates(M)), induces a finite set of equivalence classes on the (possibly infinite) set of domain elements of M [10]. For example, if Predicates(M) = {ψ1, ψ2}, then
Minterms(Predicates(M)) = {ψ1∧ψ2, ψ1∧ ¬ψ2,¬ψ1∧ψ2,¬ψ1∧ ¬ψ2} and we can map each
domain element, which, in our case, is an event/tuple, to exactly one of these 4 minterms: the one that evaluates toTRUEwhen applied to the element. Similarly, the set of minterms induces a set of equivalence classes on the set strings (event streams in our case). For example, if S=t1,· · · , tnis an event stream, then it could be mapped toS
0
=a,· · · , b, withacorresponding toψ1∧ ¬ψ2ifψ1(t1)∧ ¬ψ2(t1) =TRUE,btoψ1∧ψ2, etc. We say thatS
0
is the stream induced by applyingMinterms(Predicates(M)) on the original streamS. We first give a definition for an an m–unambiguous deterministic SFA, by modifying the relevant definition for classical automata [21]:
Definition 2 (m–unambiguous deterministic SFA). A deterministic SFA (A,Q,q0,F,∆) is m–ambiguous if there exist q ∈ Q and a, b ∈ Tm such that a 6= b and δ(q, a) = δ(q, b). A deterministic SFA which is not m–ambiguous ism–unambiguous.
In other words, upon reaching a stateqof anm–unambiguousSFA, we know which lastm minterms evaluated toTRUE, i.e., we know the lastm symbols of the induced streamS0. The following proposition then follows:
Proposition 1. Let M be a deterministic m–unambiguous SFA, S = t1,· · · , tn an event stream andS0 =X1,· · · , Xn the stream induced by applyingT =Minterms(Predicates(M))on S. Assume thatS0 is am–order Markov process, i.e., P(Xi=a|X1,· · ·, Xi−1) =P(Xi=a| Xi−m,· · ·, Xi−1). Then the sequence Y =Ym,· · ·, Yn defined byY0=q0 and Yi =δ(Yi−1, ti)
(i.e., the sequence of states visited byM) is a 1–order Markov chain whose transition matrix is given by:
Π(p, q) = (
P(Xm+1=a|X1,· · · , Xm=φ(δ−m(p))) ifδ(p, a) =q
0 ifq /∈δ(p, T)
whereδ−m(q) ={a∈Tm | ∃p∈Q:δ(p, a) =q} is the set of concatenated labels of length m that can lead toq and, by definition, is a singleton form–unambiguous SFA.
theSFAM underφ, i.e., by copying/renaming the states and transitions of the originalSFAM and by replacing the label of each transition ofM by the image of this label underφ. Then, the behavior ofN (the language it accepts) is the image underφof the behavior ofM [24]. Based on these observations, we can see that the sequence of states visited by an m–unambiguous deterministicSFAis indeed a 1–order Markov chain, as a direct consequence of the fact that a deterministicSFAhas the same behavior (up to isomorphism) to that of a classical deterministic automaton, constructed through relabelling.
Therefore, after constructing a deterministic SFA we can use it to construct a PMC and learn its transition matrix. The conditional probabilities in this case are essentially probabilities of seeing an event that will satisfy a predicate, given that the previous event(s) have satisfied the same or other predicates. For example, ifm= 1 and Predicates(M) ={ψ1, ψ2}, one such
conditional probability would beP(ψ1(ti+1)∧ψ2(ti+1) =TRUE| ¬ψ1(ti)∧¬ψ2(ti) =TRUE), i.e., the probability of seeing an event that will satisfy bothψ1and ψ2 given that the current, last
seen event satisfies neither of these predicates. As with classical automata, we can then provide again forecasts based on the waiting–time distributions of the PMC derived from aSFA.
4
Experimental Results
Wayeb is a Complex Event Forecasting engine based on symbolic automata, written in the Scala programming language. It was tested against two real–world datasets coming from the field of maritime monitoring. When sailing at sea, (most) vessels emit messages relaying information about their position, heading, speed, etc.: the so-called AIS (automatic identification system) messages. Such a stream of AIS messages can then be used in order to detect interesting patterns in the behavior of vessels [22]. Two AIS datasets were used, made available in the datAcron project1: the first contains AIS kinematic messages from vessels sailing in the Atlantic Ocean
around the port of Brest, France, and span a period from 1 October 2015 to 31 March 2016 [23]; the second was provided by IMISG2and contains AIS kinematic messages from most of Europe
(the entire Mediterranean Sea and parts of the Atlantic Ocean and the Baltic Sea), spanning an one–month period from 1 January 2016 to 31 January 2016. AIS messages can be noisy, redundant and typically arrive at unspecified time intervals. We first processed our datasets in order to produce clean and compressed trajectories, consisting of critical points, i.e., important points that are a summary of the initial trajectory, but allow for an accurate reconstruction [22]. Subsequently, we sampled the compressed trajectories by interpolating between critical points in order to get trajectories where each point has a temporal distance of one minute from its previous point. After excluding points with null speed (in order to remove stopped vessels), the final streams consist of≈1.3 million points for the Brest dataset and≈2.4 million points for the IMISG dataset. The experiments were run on a machine with Intel Core i7-4770 CPU @ 3.40GHz processors and 16 GB of memory.
We have chosen to demonstrate our forecasting engine on two important patterns. The first concerns a movement pattern in which vessels approach a port and the goal is to forecast when a vessel will enter the port. This is a key target of several vessel tracking software platforms, as indicated by the 2018 challenge of the International Conference on Distributed and Event-Based Systems [15]. The second pattern concerns a fishing maneuver inside a fishing area. Forecasting when vessels are about to start fishing could be important in order to manage the pressure exerted on fishing areas [17].
1http://datacron-project.eu/
Theapproaching pattern may be defined as follows:
R1:=x·y+·z WHERE
Distance(x,PortCoords,7.0,10.0)ANDDistance(y,PortCoords,5.0,7.0)AND
WithinCircle(z,PortCoords,5.0)PARTITION BYvesselId
(1)
Concatenation is denoted by· and + stands for Kleene+. We want to start detecting a
ves-sel’s movement whenever a vessel is between 7 and 10 km away from a specific port, then it approaches the port, with its distance from it falling to the range of 5 to 7 km, stays in that range for 1 or more messages, and finally enters the port, defined as being inside a circle with a radius of 5 km around the port. We have chosen the above syntax in order to make clear what the regular part of a pattern is (before theWHERE keyword) and what its logical part is (afterWHERE), but predicates can be placed directly in the regular expression. Note also that the first argument of a predicate is the event upon which it is to be applied, but we also allow for other arguments to be passed as constants. The partition contiguity selection strategy is employed [28], i.e., for each new vessel appearing in the stream, a new automaton run is created, being responsible for this vessel. This is just a special case of parametric trace slicing typically used in runtime verification tools [7]. If we use this pattern to build a PMC, the transition probabilities will involve the three predicates that appear in it. However, it is reasonable to assume that other features of a vessel’s kinematic behavior could affect the accuracy of fore-casts, e.g., its speed. For this reason, we have also added a mechanism to our module that can incorporate in the PMC some extra features, declared by the user, but not present in the pattern itself. The extra features we decided to add concern the vessel’s speed and its head-ing: SpeedBetween(x,0,10.0),SpeedBetween(x,10.0,20.0), SpeedBetween(x,20.0,30.0) and HeadingTowards(x,PortCoords). The first three try to use the speed level of a vessel, whereas the last one uses the vessel’s heading and checks whether it is headed towards the port. Our experiments were conducted using the main Brest port as the port of reference.
Thefishing pattern may be defined as follows:
R2:=x·y∗·z WHERE
(IsFishingVessel(x)∧ ¬InArea(x,FishingArea))AND
(InArea(y,FishingArea)∧SpeedBetween(y,9.0,20.0))AND
(InArea(z,FishingArea)∧SpeedBetween(z,1.0,9.0))
PARTITION BYvesselId
(2)
This definition attempts to capture a movement of a fishing vessel, in which it is initially outside a specific fishing area, then enters the area with a traveling speed (between 9 to 20 knots), remains there for zero or more messages, and finally starts moving with a fishing speed (between 1 to 9 knots) while still in the same area. We also used the same extra features as in Pattern1, with the difference that the Heading feature now concerns the area. Note that by partitioning byvesselId we don’t have to add theIsFishingVessel predicate foryand z.
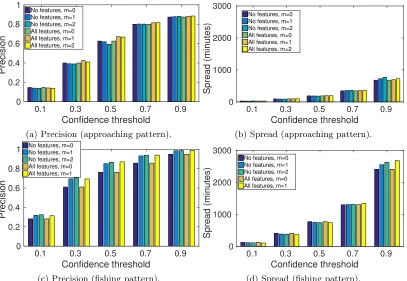
0.1 0.3 0.5 0.7 0.9 Confidence threshold 0 0.2 0.4 0.6 0.8 1 Precision
No features, m=0 No features, m=1 No features, m=2 All features, m=0 All features, m=1 All features, m=2
(a) Precision (approaching pattern).
0.1 0.3 0.5 0.7 0.9
Confidence threshold 0 1000 2000 3000 Spread (minutes)
No features, m=0 No features, m=1 No features, m=2 All features, m=0 All features, m=1 All features, m=2
(b) Spread (approaching pattern).
0.1 0.3 0.5 0.7 0.9
Confidence threshold 0 0.2 0.4 0.6 0.8 1 Precision
No features, m=0 No features, m=1 No features, m=2 All features, m=0 All features, m=1
(c) Precision (fishing pattern).
0.1 0.3 0.5 0.7 0.9
Confidence threshold 0 1000 2000 3000 Spread (minutes)
No features, m=0 No features, m=1 No features, m=2 All features, m=0 All features, m=1
(d) Spread (fishing pattern).
Figure 2: Results for approaching the Brest port and for fishing.
0.1 0.3 0.5 0.7 0.9 Confidence threshold
0 200 400 600 800 1000 1200
Throughput (events/sec)
Brest, Rec Brest, Rec+For Europe, Rec Europe, Rec+For
Figure 3: Throughput results. “Rec” denotes recongition only, with forecasting disabled. “Rec+For” denotes that both recognition and forecasting are enabled.
the case, sincemcan indeed play a significant role in other domains and/or patterns [1]. As a general comment, Figure2can help a user determine a satisfactory set of parameter values. For example, for the approaching pattern, a user could choose to setθf c= 50% andm= 0, which gives a high enough precision with relatively low spread and avoids the cost of disambiguation that accompanies any higher values ofm.
In order to assess Wayeb’s throughput, we run another series of experiments. We tested the approachingpattern on both the Brest and the Europe datasets. For the Brest dataset, all of the 222 ports of Brittany were included, each with its ownSFAand PMC. For the Europe dataset, 222 European ports were randomly selected. We tested for throughput both when forecasting is performed and when it is disabled, in which case only recognition is performed. The results are shown in Figure3. As expected, throughput is lower when forecasting is enabled. However, the overhead is not significant. We also see that throughput is higher for the Europe dataset. It is possible to achieve higher throughput because the event rate of the input stream is also higher. The throughput is higher in this case, despite the fact that it contains almost ten times as many vessels and has a higher incoming event rate, indicating that Wayeb can scale well as the number of monitored objects increases.
5
Discussion
number of forecasting methods comes from the field of temporal pattern mining, e.g., [27,18,29]. These are typically unsupervised methods with a focus on predicting what the next input event(s) in a stream might be. The same is true for the various sequence prediction methods [5]. However, predicting the next input event(s) is not of the highest priority in CEP. In fact, CEP engines typically employselection strategies that allow for ignoring input events that are not relevant for a given pattern. Most input events might thus be irrelevant for a pattern and making predictions about them is not useful. Instead, it is more important to forecast when a complex event will be detected, as can be done with our method This is the reason why we cannot compare Wayeb to these methods, since they have a different formulation of the forecasting task. Moreover, sequence prediction methods, as well as predictive CEP methods inspired by sequence prediction approaches [14], are based on the assumption of both a finite alphabet and a language of finite cardinality, basically excluding iteration. Both of these assumptions do not hold in real-world applications and our method does not require them.
Although sequence prediction methods are not suitable for complex event forecasting as they are, they employ techniques that could be useful in our case as well. For example, due to the high cost of increasing the assumed ordermof the Markov process, they employ variable–order Markov models [6]. We also intend to explore this direction, in order to avoid the combinatorial explosion on the number of states of a PMC. Another research direction is that of finding ways to compactly represent the past [25] without having to enumerate every possible combination. Finally, the predicates of symbolic automata are unary and are applied only to the last event read from the stream. This is a serious limitation for CEP where patterns are required having constraints between the last event and events seen in the past. We intend to investigate if and how our method can be extended to other automata models that provide this functionality, like extended symbolic automata [9] and quantified event automata [4].
6
Acknowledgments
This work was supported by the EU H2020 datAcron project (grant agreement No 687591).
References
[1] E. Alevizos, A. Artikis, and G. Paliouras. Event forecasting with pattern markov chains. In Proceedings of the 11th ACM International Conference on Distributed and Event-based Systems. ACM, 2017.
[2] E. Alevizos, A. Skarlatidis, A. Artikis, and G. Paliouras. Probabilistic complex event recognition:
a survey. ACM Computing Surveys (CSUR), 50(5):71, 2017.
[3] T. Anderson and L. Goodman. Statistical Inference about Markov Chains. The Annals of
Math-ematical Statistics, 1957.
[4] H. Barringer, Y. Falcone, K. Havelund, G. Reger, and D. Rydeheard. Quantified event automata:
Towards expressive and efficient runtime monitors. InInternational Symposium on Formal
Meth-ods, pages 68–84. Springer, 2012.
[5] R. Begleiter, R. El-Yaniv, and G. Yona. On prediction using variable order markov models.Journal of Artificial Intelligence Research, 22:385–421, 2004.
[6] P. B¨uhlmann, A. Wyner, et al. Variable length markov chains. The Annals of Statistics, 1999.
[7] F. Chen and G. Ro¸su. Parametric trace slicing and monitoring. InInternational Conference on
Tools and Algorithms for the Construction and Analysis of Systems. Springer, 2009.
[8] G. Cugola and A. Margara. Processing flows of information: From data stream to complex event
[9] L. D’Antoni and M. Veanes. Extended symbolic finite automata and transducers.Formal Methods in System Design, 2015.
[10] L. D’Antoni and M. Veanes. The power of symbolic automata and transducers. InInternational
Conference on Computer Aided Verification. Springer, 2017.
[11] Y. Engel and O. Etzion. Towards proactive event-driven computing. In Proceedings of the 5th
ACM international conference on Distributed event-based system, pages 125–136. ACM, 2011. [12] J. C. Fu and W. Y. W. Lou.Distribution theory of runs and patterns and its applications: a finite
Markov chain imbedding approach. World Scientific, 2003.
[13] L. F¨ul¨op, A. Besz´edes, G. T´oth, H. Demeter, L. Vid´acs, and L. Farkas. Predictive Complex Event Processing: A Conceptual Framework for Combining Complex Event Processing and Predictive Analytics. InFifth Balkan Conference in Informatics, 2012.
[14] S. Gillani, A. Kammoun, K. Singh, J. Subercaze, C. Gravier, J. Fayolle, and F. Laforest. Pi-cep:
Predictive complex event processing using range queries over historical pattern space. InData
Mining Workshops (ICDMW), 2017 IEEE International Conference on. IEEE, 2017.
[15] V. Gulisano, Z. Jerzak, P. Smirnov, M. Strohbach, H. Ziekow, and D. Zissis. The DEBS 2018
grand challenge. In Proceedings of the 12th ACM International Conference on Distributed and
Event-based Systems. ACM, 2018.
[16] J. Hopcroft, R. Motwani, and J. Ullman.Introduction to automata theory, languages, and compu-tation. Pearson/Addison Wesley, 2007.
[17] A.-L. Jousselme, C. Ray, E. Camossi, M. Hadzagic, C. Claramunt, K. Bryan, E. Reardon, and M. lteris. Deliverable D5.1: Maritime use case description. Project datAcron.
[18] S. Laxman, V. Tankasali, and R. W. White. Stream prediction using a generative model based
on frequent episodes in event sequences. InProceedings of the 14th ACM SIGKDD international
conference on Knowledge discovery and data mining. ACM, 2008.
[19] V. Muthusamy, H. Liu, and H.-A. Jacobsen. Predictive publish/subscribe matching. InProceedings of the Fourth ACM International Conference on Distributed Event-Based Systems. ACM, 2010. [20] P. Nicod`eme, B. Salvy, and P. Flajolet. Motif statistics. Theoretical Computer Science, 2002.
[21] G. Nuel. Pattern Markov Chains: Optimal Markov Chain Embedding through Deterministic
Finite Automata. Journal of Applied Probability, 2008.
[22] K. Patroumpas, E. Alevizos, A. Artikis, M. Vodas, N. Pelekis, and Y. Theodoridis. Online event recognition from moving vessel trajectories. GeoInformatica, 2017.
[23] C. Ray, R. Dreo, E. Camossi, and A. Jousselme. Heterogeneous Integrated Dataset for Maritime Intelligence, Surveillance, and Reconnaissance, 10.5281/zenodo.1167595, 2018.
[24] J. Sakarovitch. Elements of automata theory. Cambridge University Press, 2009.
[25] P. Tino and G. Dorffner. Predicting the future of discrete sequences from fractal representations of the past. Machine Learning, 2001.
[26] M. Veanes, P. De Halleux, and N. Tillmann. Rex: Symbolic regular expression explorer. In, 2010 Third International Conference on Software Testing, Verification and Validation (ICST). IEEE, 2010.
[27] R. Vilalta and S. Ma. Predicting rare events in temporal domains. InProceedings of the 2002
IEEE International Conference on Data Mining, page 474. IEEE Computer Society, 2002. [28] H. Zhang, Y. Diao, and N. Immerman. On complexity and optimization of expensive queries in
complex event processing. InProceedings of the 2014 ACM SIGMOD international conference on
Management of data. ACM, 2014.