6639 ANALYTICAL METHOD DEVELOPMENT AND VALIDATION FOR SIMULTANIOUS
ESTIMATION OF SOFOSBUVIR AND DACLATASVIR IN BULK AND PHARMACEUTICAL FORMULATION BY RP- HPLC
Dharmamoorthy G, Tasku Sravani*, Poornima B, Prashanthi C
*1Department Pharmaceutical Analysis, Krishna Teja Pharmacy College, Tirupati-517506, Andhra Pradesh, India.
*Corresponding author E-mail
:
[email protected]ARTICLE INFO
ABSTRACT
Key Words
Sofosbuvir , Daclatasvir,
RP-HPLC
A simple, Accurate, precise technique was developed for the simultaneous estimation of the Sofosbuvir and Daclatasvir in Tablet dosage form. Chromatogram was run through Std Ascentis C18 150 x 4.6 mm, 5. Mobile phase containing Acetonitrile: Water taken in the proportions 60:40 was pumped through column at a flow rate of 0.7ml/min. Temperature was kept up at 30°C. Optimized wavelength selected was 279nm. Retention time of Sofosbuvir and Daclatasvir were observed to be 2.198 min and 2.765 min. %RSD of the Sofosbuvir and Daclatasvir were and observed to be 0.4 and 0.3 respectively. %Recovery was obtained as 99.88% and 99.80% for Sofosbuvir and Daclatasvir respectively. LOD, LOQ values obtained from regression equations of Sofosbuvir and Daclatasvir were 1.73, 5.23 and 0.12, 0.36 respectively. Regression equation of Sofosbuvir is y = 9010x + 21702, and y = 10136x + 1757 of Daclatasvir Retention times were decreased and that run time was decreased, so the technique developed was simple and conservative that can be embraced in regular Quality control test in Industries.
INTRODUCTION
Sofosbuvir and daclatasvir is a direct acting antiviral medication used as a part of combination therapy to treat chronic hepatitis C. It is an infectious liver disease caused by infection with hepatisis C virus. HCV is a single standard RNA virus that is chategorised into nine distinict genotypes. Sofosbuvir and daclatasvir inhibits the HCV viral RNA replication and protein translation. Sosbuvir and other direct acting antiviral are therefore very potent options for the treatment of hepatitis C, as they exhibit high barrier to the development of resistance. Daclatasvir antiviral action by preventing RNA replication and virion assembly via binding to NS5A, a non structural phosphoprotein encoded by HCV.
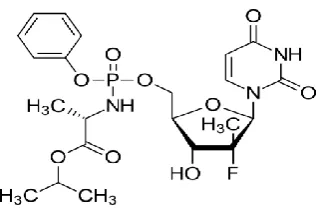
Fig 1: Structure of sofosbuvir
Fig 2: Structure of daclatasvir
Journal of Global Trends in Pharmaceutical Sciences
6640 MAREIALS AND METHODS:
Preparation of buffer:
0.1%OPA Buffer: Take 1ml of ortho phosphoric acid was diluted to 1000ml with HPLC grade water.
Preparation of mobile phase: Mix a mixture of above buffer 40ml (40%) and acetonitrile 60ml (HPLC grade 60%)and degassed in ultrasonic water bath in 5min.
Diluent: Based up on the solubility of the drugs, diluent was selected, Acetonitrile and Water taken in the ratio of 50:50.
Stock solution:
Preparation of Standard stock solutions: Accurately weighed 40 mg of Sofosbuvir, 6mg of Daclatasvir and transferred to 25ml volumetric flask and 3/4 th of diluents was added to these flask and sonicated for 10 minutes. Flask were made up with diluents and labeled as Standard stock solution. (1600µg/ml of Sofosbuvir and 240µg/ml of Daclatasvir)
Preparation of Sample stock solutions: 5 tablets were weighed and the average weight of each tablet was calculated, then the weight equivalent to tablet was transferred into a 100 ml volumetric flask, 50ml of diluents was added and sonicated for 25 min, further the volume was made up with diluent and filtered by HPLC filters (4000µg/ml of Sofosbuvir and 600µg/ml of Daclatasvir)
Working solution:
Preparation of Standard working solutions (100% solution): 1ml from each stock solution was pipetted out and taken into a 10ml volumetric flask and made up with diluent. (160µg/ml Sofosbuvir of and 24µg/ml of Daclatasvir)
Preparation of Sample working solutions (100% solution): 0.4ml of filtered sample stock solution was transferred to 10ml volumetric flask and made up with diluent. (160µg/ml of Sofosbuvir and 24µg/ml of Daclatasvir)
Procedure: 10µL of the blank, standard and sample were injected into the chromatographic system and areas for the sofosbuvir and
dalatasvir the peaks were used for calculating the % assay by using the for the formula.
Results and discussion: method validation: specificity, linearity range, accuracy, precision, repeatability, intermediate precision, limit of detection, limit of quatification, rubustness.
Specificity: The system suitability for specificity was carried out to determine whether there is an interference of any impurities in retention time of analytical peak. the specificity study was performed by injecting blank. It was found that there was no interference of impurities in retention time of analytical peak.
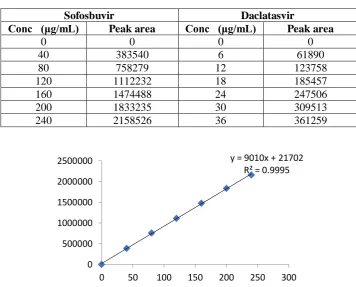
LINEARITY: To establish the linearity of the method, serial dilution were prepared to obtain the mixture of sofosbuvir and daclatasvir ranging from 40ppm to 240ppm and 6ppm to 36ppm level all the solutions were filtered through a 0.45µm Millipore filters.the final solution were injected in duplicate manner keeping the injection volume 10µl.Calibration curve was plotted between mean peak area and concentration. The correlation coefficient and slope were determined from the calibration curve. The linearity chats of sofosbuvir and daclatasvir was shown in figure no. 5&6. The correlation coefficient was found to be 0.999 for both drugs and hence the method was set to be linear .The were tabulated in table 1.
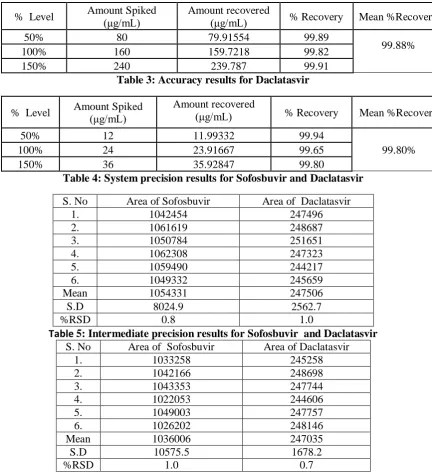
ACCURACY: Accuracy was evaluated by standard addition method of three known concentration of the drug and the spiked solution were analysed. The recovery of the added drug was determined by calculating the pre-analysed drug concentration with concentration of spiked drug. The % recovery was calculated and the result was reported in table no. 2 &3.
6641 Fig. No. 3: Chromatogram showing Blank
Fig. No. 4: Chromatogram showing optimized condition
Table 1: Linearity results for Sofosbuvir and Daclatasvir
Sofosbuvir Daclatasvir
Conc (μg/mL) Peak area Conc (μg/mL) Peak area
0 0 0 0
40 383540 6 61890
80 758279 12 123758
120 1112232 18 185457
160 1474488 24 247506
200 1833235 30 309513
240 2158526 36 361259
Fig. No. 5: Showing Calibration curve of Sofosbuvir y = 9010x + 21702
R² = 0.9995
0 500000 1000000 1500000 2000000 2500000
6642 Fig. No. 6: Showing Calibration curve of Daclatasvir
Table 2 : Accuracy results for Sofosbuvir
% Level Amount Spiked (μg/mL) Amount recovered (μg/mL) % Recovery Mean %Recovery
50% 80 79.91554 99.89
99.88%
100% 160 159.7218 99.82
150% 240 239.787 99.91
Table 3: Accuracy results for Daclatasvir
% Level Amount Spiked (μg/mL) Amount recovered (μg/mL) % Recovery Mean %Recovery
50% 12 11.99332 99.94
99.80%
100% 24 23.91667 99.65
150% 36 35.92847 99.80
Table 4: System precision results for Sofosbuvir and Daclatasvir
S. No Area of Sofosbuvir Area of Daclatasvir
1. 1042454 247496
2. 1061619 248687
3. 1050784 251651
4. 1062308 247323
5. 1059490 244217
6. 1049332 245659
Mean 1054331 247506
S.D 8024.9 2562.7
%RSD 0.8 1.0
Table 5: Intermediate precision results for Sofosbuvir and Daclatasvir S. No Area of Sofosbuvir Area of Daclatasvir
1. 1033258 245258
2. 1042166 248698
3. 1043353 247744
4. 1022053 244606
5. 1049003 247757
6. 1026202 248146
Mean 1036006 247035
S.D 10575.5 1678.2
%RSD 1.0 0.7
y = 10136x + 1757.8 R² = 0.9995
0 100000 200000 300000 400000
6643 Table 6: LOD & LOQ results for Sofosbuvir and Daclatasvir
Molecule LOD LOQ
Sofosbuvir 1.73 5.23
Daclatasvir 0.12 0.36
Table 7: Robustness data for Sofosbuvir and Daclatasvir
S.no Condition %RSD of Sofosbuvir %RSD of Daclatasvir
1 Flow rate (-) 0.55ml/min 0.8 0.8
2 Flow rate (+) 0.65ml/min 1.0 1.6
3 Mobile phase (-) 55B:45A 0.7 1.7
4 Mobile phase (+) 45B:55A 0.9 0.9
5 Temperature (-) 25°C 0.8 1.8
6 Temperature (+) 35°C 0.2 0.7
LIMIT OF DETECTION (LOD) AND LIMIT OF QUANTIFICATION (LOQ): The limit of detection (LOD) and limit of quantification (LOQ) were determined by injecting six replicates of mobile phase followed by three concentration of the drug. The LOD was defined as the concentration which yields a signal-to-noise ratio 3:1 while the LOQ was calculated to be the lowest concentration that could be measured with signal-to-noise ratio 10:1. The LOD & LOQ were calculated by measuring the standard deviation of the response and slope. The result of LOD &LOQ was tabulated in table no. 6.
ROBUSTNESS: The small deliberate changes in method like flow rate, mobile phase ratio, and temperature are made but there were no recognized change in the result and are within the range as per ICH guide lines. Robustness condition like flow minus (0.8ml/min), flow plus (1.3ml/min), mobile phase minus, mobile phase plus, temperature minus (25ºc), temperature plus (35ºc) was maintain and samples were injected in duplicate manner. System suitability parameters were not much affected and all the parameters were passed %RSD was found to be within the limits and results were tabulated in table no. 7.
CONCLUSION:
The proposed stability indicating RP-HPLC method was found to be simple, accurate, precise, robust, and rapid. This method gives good resolution between two compounds with a short analysis time. Hence this method can be used in quality control departments with respect to routine analysis
for the assay of the tablets containing sofosbuvir and daclatasvir.
Acknowledgement: The author expresses sincere thanks to the principal and head of pharmaceutical Analysis department, Krishna Teja College of pharmacy for providing facilities and grates support to carry out the research work.
REFERENCES:
1. Benzil Dudekula1, C.Ramachandraiah,
N.Devanna et al,. Analytical method development and validation for the simultaneous estimation of sofosbuvir and daclatasvir drug product by rp-hplc method indo american journal of pharmaceutical research, 2017 issn no: 2231-6876 vol 7, issue 07, 2017. 2. https://www.drugbank.ca/drugs/DB09
102
3. Shaadmin Shaikh et al,. development and validation of rp-hplc method for quantitative analysis of sofosbuvir in pure and pharmaceutical formulation world journal of pharmacy and pharmaceutical sciences 2018-7(8):2249-2258
4. Indian Pharmacopoeia, Indian Pharmacopoeial Commission, Controller of Publication, Government of India, Ministry of health and Family Welfare, Ghaziabad, India, 2 (2010) 1657-1658.
6644 6. Kaushal.C, Srivatsava.B, A Process of
Method Development: A
Chromatographic Approach. J Chem Pharm Res, Vol.2, Issue 2, 519-545, (2010)
7. Ashok Kumar, Lalith Kishore, navpreet Kaur , Anroop Nair. Method Development and Validation for Pharmaceutical Analysis. International Pharmaceutica Sciencia, Vol 2, Issue 3, Jul-Sep (2012)
8. ICH, Validation of analytical procedures: Text and Methodology. International Conference on Harmonization, IFPMA , Geneva , (1996)