4514 METHOD DEVELOPMENT AND VALIDATION FOR THE SIMULTANEOUS ESTIMATION OF TRIFLURIDINE AND TIPIRACIL IN TABLET DOSAGE FORM
BY RP-HPLC METHOD
Prathap. B1*, V. Hari Baskar1, B. Kumar1, P.S.Raghu2, S. Bharath Kumar Reddy1
1Department of Pharmaceutical Analysis, Ratnam Institute of Pharmacy, Nellore,
Andhra Pradesh, India – 524348.
2University College of Pharmaceutical Sciences, Sri Krishnadevaraya University,
Andhra Pradesh, India – 515003
*Corresponding author E-mail:[email protected]
ARTICLE INFO ABSTRACT
Key Words
Trifluridine (FTD) Tipiracil (TPI) HPLC method
A simple, specific, accurate and precise reverse phase HPLC method has been developed and validated for the simultaneous estimation of Trifluridine (FTD) and Tipiracil (TPI) in Tablet dosage form. Chromatographic separation of FTD and TPI were successfully achieved on an Agilent ODS C 18 (150 X 4.6mmX5µm) analytical column. A mixture of phosphate buffer and methanol in the ratio of 30:70 %v/v (pH 3.0) was used as the mobile phase at a flow rate of 1.0ml/min and detection wavelength at 240nm. Calibration curve showed correlation coefficient of 0.999 for both drugs. The percentage recovery was 100.15% and 100.51% respectively.FTD and TPI indicating accuracy and reliability of method. The method was found to be precise as indicating by the repeatability of the analytical procedure, showing %RSD ˂ 2%. Both drugs were eluted within 6 minutes and gave sharp peaks with high theoretical plate count and low tailing factor. The HPLC method was fully validated as per International Conference on Harmonization (ICH). The developed method can be used for routine analysis.
INTRODUCTION
Drug analysis plays an important role in the development of drugs, their manufacture and therapeutic use. The number of drugs and drug formulations introduced into the market by pharmaceutical industries is increasing at an alarming time. These drugs and formulations may be either or partial modification of the existing one or they may be novel or multicomponent dosage forms. The complexity of these dosage
forms possesses considerable challenge to the analytical chemist during the development of assay procedures. Pharmaceutical industries rely upon quantitative chemical analysis to ensure that the raw material used and the final products obtained meet the required specification. Trifluridine is a nucleoside analog antiviral fluorinated thymidine analog with potential antineoplastic activity. Trifluridine is incorporated into DNA synthesis, inhibition of protein An Elsevier Indexed Journal ISSN-2230-7346
4515 synthesis and apoptosis. Tipiracil is a drug
used to treatment of cancer and is Tipiracil help to maintain concentration of trifluridine by inhibiting the enzyme thymidine phosphorylase which metabolizes trifluridine. Trifluridine (FTD) is an antineoplastic nucleoside analog discovered by Heidelberger and others at the university of Wisconsin as a drug that inhibits thymidylate synthetase (TS) similarly to existing fluoropyrimidines but exerts a growth inhibitory effect mainly by being incorporated into DNA of tumor cells. Lonsurf is a novel oral nucleoside antitumor agent that consists of trifluridine (FTD) Figure.1. and tipiracil (TPI) Figure.2. Lonsurf is specifically indicated indicated for patients with metastatic colorectal cancer. FTD is chemically 1-[(2R, 4S, 5R) – 4-hydroxy-5-(hydroxymethyl) oxolan-2-yl]-5-(trifluoromethyl)-1, 2, 3, 4-tetrahydropyimidine-2, 4-Dione. TPI is
chemically
5-Chloro-6-[(2-iminopyrrolidin-1yl) methyl]-1, 2, 3, 4-tetrahydropyrimidine-2, 4-dione 1-10. There
are few methods reported in the literature of trifluridine and tipiracil alone or in combination with other drugs in the pure and pharmaceutical formulation by UV Spectrophotpmeter, HPLC, HPTLC and LC-MS 13-14. In view of the need for suitable, cost-effective RP-HPLC method for routine analysis of simultaneous estimation of Trifluridine and Tipiracil in pure and tablet dosage form, attempts we made to develop simple, precise, accurate and cost-effective analytical method for the estimation of Trifluridine and Tipiracil. The proposed method will be validated as per ICH guidelines.
EXPERIMENTAL
Materials
Trifluidine (FTD) and tipiracil (TPI) standard supplied by PharmaTrain Laboratories, Hyderabad, India. Lonsurf (tablet dosage form) containing 15mg of FTD and 6.14mg of TPI were purchased
from local market. The purity of the drug was evaluated and no impurities were found. The drug was used without further purification. All the reagents used in the experimental work were of analytical grade was purchased from Merk and Rankam, India. HPLC grade water and Methanol was made from Milli-Q USA. Mobile phase was used as solvent.
Chromatographic conditions (instrumentation and analytical
conditions)
An Alliance 2695 Waters, chromatographic system was used equipped with quaternary pump and water 2487 UV detector, Agilent C 18 250 X 4.6 mm, 5µ, auto sampler thermostat and degasser. Chromatographic software Empower was used for data collection and processing separations were performed using Agilent C18 analytical column, 250X4.6mm packed with 5µm particle size. Injection volume was 10µL. Separations and simultaneous determination of FTD and TPI were performed using the mixture of Methanol: buffer pH 3 (70:30%v/v) as a mobile phase. Mobile phase was filtered through a 0.45µm Millipore filter. The flow rate was 1.0mL/min and UV detection was performed at 240nm.
Method Development
Selection of Detection wavelength
The UV spectrum of diluted solutions of various concentrations of Trifluridine and Tipiracil in mobile phase
was recorded using UV
spectrophotometer. The wavelength of the maximum absorbance was observed at 240nm. This wavelength was used for detection of Trifluridine and Tipiraci.
Preparation of standard solutions
4516 volumetric flask and add about 2ml of
diluent and sonicate to dissolve it completely and make volume up to the mark with the same solvent (stock solution). Further pipette out 1ml of the above stock solution into a 10ml volumetric flask and was diluted up to the mark with diluent. The solutions were filtered through a 0.45µm membrane filter before injection into the HPLC system.
Preparation of sample solution
10 tablets were carefully weighed and powdered to get a homogenous fine powder in a mortar. An appropriate weight of this powder equivalent to one tablet content was weighed, transferred into the calibrated volumetric flask and dissolved in sufficient mobile phase in an ultrasonic bath. Further dilute 0.1ml of the above solution to 10ml with diluent. Filter through 0.45µm Nylon syringe filter to obtain the certain concentration in the linearity range of FTD and TPI for HPLC.
VALIDATION PROCEDURE11-12
Chromatographic separation was optimized in the aim to obtain a resolution above 1.5 between all components with the respect of stationary and mobile phase compositions, flow rate, sample volume, detection wavelength and temperature. The method was validated for linearity, range, accuracy, precision (repeatability and intermediated precision), specificity, limit of quantization, limit of detection and robustness.
Linearity and Range
Standard calibration curve were prepared with five calibrations over a concentration range of 25 to 125µg/ml for Trifluridine and 15 to 75µg/ml for Tipiracil. The data of peak area versus drug concentration were treated by linear least square regression analysis. The standard curves were evaluated for linearity.
Accuracy (Recovery study)
The accuracy of the method was determined by calculating the recoveries of Trifluridine and Tipiracil by the standard addition method. Known amounts of standard solutions of Trifluridine and Tipiracil were added at (50%, 100% and 150%) concentration to pre-quantified sample solutions of Trifluridine and Tipiracil and the amount of drug recovered was estimated.
Precision
The precision of the assay was studied with respect to both repeatability and intermediated precision. Repeatability was calculated from five replicate injections of freshly prepared solution in the same equipment on the same day. The experiment was repeated by assaying freshly prepared solution at the same concentration on two additionally consecutive days to determine intermediate precision. Precision was expressed by the % of the relative standard deviation (R.S.D.) of the analyte peaks.
Specificity
In an assay demonstration of specificity requires to be shown that the procedure is unaffected by the presence of impurities or excipients. In practice, this can be done by spiking the drug substance or product with appropriate levels of impurities or excipients and demonstrating that the assay results are unaffected by the presence of these extraneous materials. There should be no interference of the diluents and placebo at retention time of drug substance.
Limit of detection and Quantization
Limits of detection (LOD) and limits of quantization (LOQ) were provided and calculation was made with the following equations:
4517 LOQ = 10 σ / S
When σ was the standard deviation of the response (estimated from the standard deviation of y – intercepts or regression lines) and S was the slope of the standard curve.
Sensitivity
The sensitivity of an analytical method is defined by the minimum variation that requires to be applied to the magnitude measured in order to obtain a significant variation in the signal measured.
Robustness
Robustness of method was investigated by varying the chromatographic conditions such as change of flow rate, organic content in mobile phase. Robustness of the developed method was indicated by the overall %RSD between the data at each variable condition.
RESULTS AND DISCUSSION
Optimization of HPLC conditions
Finally HPLC conditions were optimized to obtain a desired peak with high purity and resolution. Therefore the various parameters affecting the peak shape, retention time and resolution of FTD and TPI were investigated in detail. The separation efficiency of Agilent C18 (150X4.6mm, 5µ) was compared to the Intersil ODS (150X4.6mm,5µ) for the determination of FTD and TPI under the same conditions and the proposed column was chosen for the further optimization of parameters. During our preliminary experiments the series of aqueous mobile phases containing buffer solutions with the different pH values in combination with different organic modifiers including the different ratios of acetonitrile, methanol and triethylamine were tested for obtaining the optimum separation conditions.
Methanol and phosphate buffer solution were selected as the eluents. The chromatographic analysis time of FTD and TPI was shortened with high organic solvent content and also the buffer solutions in the mobile phase ensured stable chromatographic retention times preventing broad peaks. The effect of the mobile phase pH on the retention time and peak shape of the analyte was studied especially in the acidic region. The best retention time and peak shape of FTD and TPI were achieved with phosphate buffer pH 3. The best separation was achieved with the mobile phase consisting of phosphate buffer pH 3: methanol (30:70%v/v). The retention time of Trifluridine and Tipiracil was found to be 2.262 mins and 4.260 mins respectively.
METHOD VALIDATION
4518
Figure 1: Structure of Trifluridine
Figure 2: Structure of Tipiracil
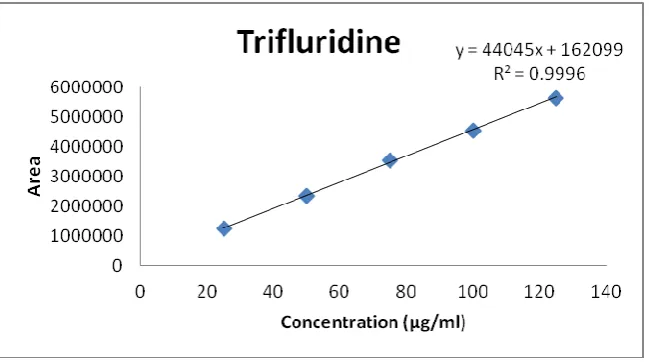
4519 Figure 4: Calibration curve of Trifluridine
Figure 5: Calibration curve of Tipiracil
Concentration (µg/ml) Area
25 1246587
50 2248079
75 3529801
100 4553376
125 5649583
Table 1: Calibration data for Trifluridine
Concentration (µg/ml) Area
15 361744
30 751959
45 1068815
60 1503717
75 1858720
Table 2: Calibration data for Tipiracil
Recovery Level
Amount added
(mg)
Amount found(mg)
Mean
Area Recovery
Mean recovery
50% 5.0 5.01 1829739 100.20%
100.15%
100% 10.0 9.96 3642243 99.60%
150% 15.0 15.1 5535371 100.66%
Table 3: Recovery Data for Trifluridine
Recovery Level
Amount added (mg)
Amount found(mg)
Mean
Area Recovery
Mean recovery
50% 5.0 4.98 564367 99.60%
100.51%
100% 10.0 10.2 1115445 102.00%
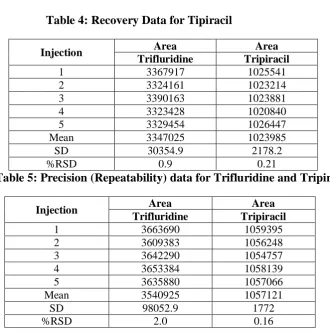
4520 Table 4: Recovery Data for Tipiracil
Injection Area Area
Trifluridine Tripiracil
1 3367917 1025541
2 3324161 1023214
3 3390163 1023881
4 3323428 1020840
5 3329454 1026447
Mean 3347025 1023985
SD 30354.9 2178.2
%RSD 0.9 0.21
Table 5: Precision (Repeatability) data for Trifluridine and Tripiracil
Injection Area Area
Trifluridine Tripiracil
1 3663690 1059395
2 3609383 1056248
3 3642290 1054757
4 3653384 1058139
5 3635880 1057066
Mean 3540925 1057121
SD 98052.9 1772
%RSD 2.0 0.16
Table – 6: Intermediate Precision data for Trifluridine and Tripiracil
The limit of detection (LOD) for FTD and TPI were found to be 3.17 and 0.1372 µg/ml calculated from related equation (S/N = 3). The similar study claimed that a narrow working range (LOQ) such as 5.60 and 0.132µg/ml for FTD and TPI were obtained at the excitation wavelength of 240nm. Robustness of the method includes small changes in chromatographic conditions such as change in flow rate (± 20%) and organic content in mobile phase (± 5%). To determine the robustness of the method for the analysis of FTD and TPI the above mentioned changes has been undertaken and the USP plate count and tailing values were found to be reliable. The chromatographic data has been shown in figure 3.
CONCLUSIONS
A highly sensitive and effective validated reversed phase HPLC method was successfully developed for FTD and
TPI assay. This method was validated for linearity, accuracy, precision and robustness of FTD and TPI drug. The RSD values for all parameters were found to be less 2 which indicates the validity of method and results obtained by this method are in fair agreement. Finally this method can be used as better analytical tool for pharmaceutical formulations for FTD and TPI.
ACKNOWLEDGMENTS
I thank God for letting me complete my work successfully and I take privilege to sincerely thanks to my professor for his extreme support and guidance all throughout my work.
REFERENCES
1. https://www.drugbank.ca/drugs/DB 00432
4521 3. https://www.accessdata.fda.gov/dru
gsatfda_docs/label/2015/207981s0 00lbl.pdf
4. Troy kish and Priyasha Uppal. Trifluridine/ Tipiracil (Lonsuf) for the treatment of metastatic colorectal cancer. Pharmacy and Therapeitics. 2016; 41(5), 314-317, 325.
5. Hong DS, Abbruzzese JL, Bogaard K, Lassere Y, Fukushima M, Mita A, Kuwara K and Hoff PM. Phase I study to determine the safety and pharmacokinetics of oral administration of TAS – 102 in patients with solid tumors. Cancer. 2006; 107 (6), 1383 – 90.
6. Temmink OH, Prins HJ, van Gelderorp E and PetersGJ. The Hollow Fibre assay as a model for in vivo pharmacodynamics of fluoropyrimidines in colon cancer cells. 2007; 15; 96 (1), 61-6.
7. Nannizzi S, Veal GJ, Giovannetti E and Mey V. Cellular and molecular mechanisms for the synergistic cytotoxicity elicited by oxaliplatin and pemetrexed in colon cancer cell lines. Cancer chemotheraphy and pharmacology. 2010-08-01. 8. Nozomu Tanna KA, Ka zuki
Sakamoto, Hir oyuki Okabe, Akio Fujioka, Keisu ke Ya mamura, Fumio Nakagawa, Hideki Nagase, Tatsushi Yokogawa, Kei O guchi, b Keiji Ishida, Akiko Osada, Hir omi Ka zun o, Yu kari Ya mada and Kenichi Mastsu. Repeated oral dosing of TAS – 102 confers high trifluridine incorpotation into DNA and sustained anti tumor activity in mouse models. Oncology Reports, 2014; 32; 2319-2326.
9. Burness CB and Duggan ST. Trifluridine/Tipiracil: A Review in metastatic colorectal cancer. Drugs, 2016; 76(14); 1393-402.
10.Breaux J and Jones K. Understanding and implementing efficient analytical method
development and validation. Journal of Pharmaceutical Technology, 2003, 5, 110-114. 11.ICH Q2A, “validation of analytical
methods, definitions and terminology”, ICH Harmonized tripartite guideline, 1999.
12.Code Q2B, Validation of
Analytical Procedures;
Methodology. ICH Harmonized Tripartite Guidelines, Geneva, Switzerland, 1996, 17 8.
13.Swapna Goday, S K Abdulrahaman and A Prameelarani. Development and validation of stability indicating RP-HPLC method for the simultaneous estimation of combination drugs trifluridine and tipiracil in bulk and pharmaceutical dosage form. International Journal of research in applied natural and social sciences. 2017; 5(2);93-104.
14.Kusuma Jogi, Mandava
Basaveswara Rao and Rundraraju Ramesh Raju. An effective and
sensitive indicating