Turkish Journal of Fisheries and Aquatic Sciences 14: 955-964 (2014)
www.trjfas.org ISSN 1303-2712 DOI: 10.4194/1303-2712-v14_4_15
© Published by Central Fisheries Research Institute (CFRI) Trabzon, Turkey in cooperation with Japan International Cooperation Agency (JICA), Japan
Microzooplankton: The Trophic Role and Involvement in the
Phytoplankton Loss and Bloom-Formation in the Black Sea
Introduction
According to current scientific notions, microzooplankton are heterotrophic and mixotrophic organisms less than 200 µm in size which, whenever necessary, can switch to phagotrophic; heterotrophic dinoflagellates and ciliates are the dominant microzooplankton (Quevedo and Anadon, 2001; Paterson et al., 2007). Two genera, Gymnodinium and Protoperidinium, prevail among dinoflagellates. This fraction comprises, along with small and large protozoans, early developmental stages of mesozooplankton–primarily nauplii of copepods– and meroplankton (Calbet, 2008). The pertinent literature beginning from the work by Landry and Hasset, 1982. They have accumulated an impressive range of scientific evidence about consumption of phytoplankton by microzooplankton. In particular, it was proved that the portion of primary production consumed by microzooplankton broadly varies both in coastal and open areas of the global oceans. For instance, in summer 1990 and in spring 1991 primary production removed by microzooplankton in the surface of the northern Gulf of Mexico ranged from 42 to 214% of daily phytoplankton production, 82%
on the average (Fahnenstiel et al., 1995). In the Gulf of California the daily consumption of primary production by microzooplankton varied from 0 to 89% (Palomares-Garcia et al., 2006). In the equatorial eastern Pacific the daily primary production available in the surface layer during the period of upwelling extenuation was completely–100%–removed by microzooplankton (Landry et al., 2000). In the Atlantic Ocean, it was estimated 44% in the subtropical northwestern part during June–July 1996, and 77% in the temperate northwestern area (Stelfox-Widdicombe et al., 2000).
Analysis of the accumulated evidence suggests that average consumption of primary production by microzooplankton amounts to 70% in the open sea and 60% and in the coastal zone (Calbet and Landry, 2004; Calbet, 2008). Therefore, in the global oceans microzooplankton is the major consumer of phytoplankton. As it has been noted (Stelmakh, 2013), microzooplankton studies conducted in the Black Sea until recently assessed only the biomass of individual microzooplankton groups without taking into consideration the associated functional aspects, in particular the rates of microzooplankton grazing on phytoplankton. For the lack of pertinent scientific
Lyudmyla Stelmakh
1,*Elena Georgieva
21,2 Southern Seas (IBSS) National Academy of Sciences of Ukraine, A.O. Kovalevsky Institute of Biology, Sevastopol, 99011,
Nakhimov Av., 2, Ukraine.
* Corresponding Author: Tel.: +380.692 550944; Fax: +380.692 550944; E-mail: [email protected]
Received 12 May 2014 Accepted 5 September 2014
Abstract
For the first time microzooplankton grazing impact on phytoplankton in the Black Sea was investigated in relation to seasonal and spatial variability. In this work we used scientific evidence obtained in the experiments conducted in the Sevastopol Bay (2006-2010) and in field during the Black Sea expeditions of the R/V "Vladimir Parshin" (September-October 2005) and the R/V "Professor Vodyanitsky" (May 2013). In the Sevastopol Bay the ratio between microzooplankton grazing impact and specific rate of phytoplankton growth (g/μ) yielded the annual average of 65% that agrees with the annual average for phytoplankton primary production consumed by microzooplankton. It was found that, irrespective of the location, with sufficient quantity of nutrients in the stratified sea water, phytoplankton blooms began to form as the ratio between microzooplankton grazing and phytoplankton growth rates (g/μ) was ≤75%; as the bloom was ceasing, the ratio was evaluated >100%. Therefore, we suppose, that initiation of phytoplankton blooms is possible when conditions are favorable for rapid phytoplankton growth and the ratio of grazing to growth (g/μ) will be <75%.
a b
evidence, we initiated research in this field which wascarried out during the international expedition of the R/V “Vladimir Parshin” to the western Black Sea in September–October 2005 (Stelmakh et al., 2009). Later the work was continued so that to cover coastal (Stelmakh et al., 2010; Stelmakh, 2013) and open seawater areas (Stelmakh et al., 2013).
The goal of this investigation was gaining insight into the trophic role and impacts that microzooplankton has on phytoplankton and on phytoplankton blooms developing in the surface of the Black Sea. For this purpose we analyzed the records about seasonal and spatial variability of the phytoplankton specific growth rate in surface layer of the Black Sea, microzooplankton grazing rates, the total biomass and dominant species of phytoplankton, and also seawater temperature and nutrient content.
Materials and Methods
As Figure 1 shows, material for the investigation was collected from the Sevastopol Bay (2006–2007), in the western Black Sea (the international expedition of the R/V “Vladimir Parshin”, September–October
2005) and at some coastal and open areas of the Black Sea (the 72nd research cruise of the R/V “Professor
Vodyanitsky”, May 2013). Samples of seawater (12~15 L) were taken from the sea surface (~0.5 m depth) by a Niskin bottle. In our work we used dilution procedure (Landry and Hasset, 1982) because this method allows specifying actual growth rate of integral phytoplankton and phytoplankton mortality due to microzooplankton grazing. Using this method, one should bear in mind three key points. Firstly, phytoplankton loss from grazing by microzooplankton linearly correlates with phytoplankton concentration and decreases with increasing dilution factor. Secondly, phytoplankton growth rate does not depend on the degree of dilution. Thirdly, specific growth rate of microalgae can be described by exponential function (Landry and Hassett, 1982; Landry et al., 1995; Dolan et al., 2000; Redden et al., 2002). In the presence of mesozooplankton the microzooplankton impact on phytoplankton sometimes decreases because many members of mesozooplankton are used to feed both on phytoplankton and microzooplankton (Saiz and Calbet, 2011). That is why scientists, before launching 24-h experiments, usually filter a sample of
32.0 32.2 32.4 32.6 32.8 33.0 33.2 33.4 33.6 33.8 34.0 Longitude E°
44.0 44.2 44.4 44.6 44.8 45.0 45.2 45.4 45.6 45.8 46.0
L
a
ti
tu
d
e
N
°
Crimea
Sevastopol
Black Sea
28 30 32 34
42 44 46
p.Varna
P1KR
0 2
5 9 10 16 20 25
35
33X
30
41X 40X 38X
52
54 55
43 G
P4KR
P6KR
30 31 32 33 34 35 36 37
43 44 45 46 47
34
21 22
18 38
39 35
7 9
13
14 16
28 26 33 O
Figure 1 The map of sampling stations in the Black Sea: a: Sevastopol Bay (one station); b: R/V “Vladimir Parshin” (September – October 2005); c: R/V “Professor Vodyanitsky” (May 2013)
sea water through 200 µm mesh to remove mesozooplankton. To have filtrate clear from suspended particles, 6–8 L of the initial sample were filtered through a fiberglass filter GF/F (47 mm in diameter) under low pressure (<0.1 atm) that prevented destruction of algal cells and their penetration into the filtrate. Initial sample was diluted with the filtrate so that to have a series of samples with reducing dilution factor (DF) of 1.0, 0.8, 0.6, 0.4, 0.2–and specially for nutrient rich water, 0.1–in two replications. Factor 1.0 was typical of the original undiluted sample whereas factor 0.1–of the tenfold dilution. After preparation the samples were poured into 1–2 L polycarbonate bottles which have been rinsed with 10% hydrochloric acid and distilled water and placed for a daily exposition into a flow-through incubator. The incubator was placed on deck to provide exposition going under natural light and the temperature 1–3°C warmer or cooler than seawater temperature. Initial samples and the samples after daily exposition were filtered through Whatman GF/F fiberglass filters or Sartorius cellulose filters (47 mm in diameter, 0.45 µm pore size). After filtration the filters were placed into 90% acetone. As soon as pigments have been extracted, chlorophyll а was measured using fluorometric method (Protocol JGOFS, 1994).
Phytoplankton growth rate was calculated from chlorophyll a daily increase observed in experimental flasks. Apparent growth rate, μ(ар,), for each dilution
was evaluated by equation:
μ (ар.) = ln (Chl(t) /Chl(0)) (1)
where Chl(0) and Chl(t) are initial and final
concentration of chlorophyll а.
Values of μ(ар.) were determined for each
experiment individually; later they have underpinned computation of linear regression equations linking apparent and actual growth rates (μ (ар.) and μ,
correspondingly) of microalgae and the rate of grazing by microzooplankton (g):
μ (ар.)= μ –g·DF (2)
Coefficient of determination (R2) for linear
regression equations in the experiment ranged from 0.55 to 0.96 and depended on chlorophyll а concentration in the plankton. Its values varied from 0.80 to 0.96 under moderate and high chlorophyll estimates (0.50–6 mg·m-3) and decreased to 0.55–0.70
when content of the pigment was low (<0.50 mg·m-3).
Anyway, coefficient of determination was estimated 0.65 or larger for 90% of the data. Reliability of the regression equation was assessed by F-criterion (Fischer criterion) and reliability of equation factors– by t-criterion (Student criterion). Factors used in equation 2.2. and representing actual growth rate (μ) of phytoplankton and specific rate of phytoplankton consumption by microzooplankton (g) showed
standard error that usually ranged from 5 to 15%, rarely increasing to 30% under dramatically low growth and mortality estimates (ca. 0.10 day-1). Our
experiments have proven that the linear model designed by the inventors of dilution technique (Landry and Hasset, 1982) works well in the coastal and open areas of the Black Sea.
To provide assessment of phytoplankton biomass and determination of species composition, 2~4 L samples of sea water were condensed through nucleopore membranes (1 μm pore size; the product of the Institute of Nuclear Researches, Dubna, Russia) in the inverse filtering Plexiglas funnel (Sorokin et al., 1975). The resulting samples were fixed with neutralized 1% formaldehyde (final concentration in the sample) and immediately processed. The numbers and linear dimensions of microalgae were measured in a 0.1-ml drop in 3~5 replications under the light microscope ZEISS Primo Star (x400). Nutrients were measured according to the already described technique (Stelmakh et al., 2009; Stelmakh et al., 2013). We applied Microsoft Office Excel 2007 and Sigma Plot 2001 software for Windows for mathematical treatment of the data.
Results
The Seasonal Dynamics of Phytoplankton Biomass, Growth Rate and the Loss from Microzooplankton Grazing
As the records dated 2006–2007 show, during this period there were three peaks of phytoplankton biomass in the Sevastopol Bay (Figure 2). Two first, one in May and the other in October 2006, yielded the estimates close to 180 and 330 mg С/m3,
correspondingly. Upper mixed layer (UML), about 5-m deep, persisted in the bay only fro5-m May to October when the sea was warmer than 17°С, in other months it was practically absent. During the year salinity of surface water varied from 17.40 to 17.80‰. The bloom in May was mainly due to small Chaetoceros spp.; in October these small diatoms contributed less than 50% to the total phytoplankton biomass and the rest were large diatoms such as Dactyliosolen fragilissimus and Cerataulina pelagica (Table 1). In February 2007 the third peak of 60 mg С/m3 was registered during the bloom caused by the
diatom Skeletonema costatum (small form). Later, in June 2007, phytoplankton biomass increased to a maximum of 250 mg С/m3 and was largely due to
Chaetoceros The surveys made in the bay indicated that during the periods of maximal phytoplankton biomass the content of nitrates in the sea water was as high as 1–6 µM and the specific growth rate of the phytoplankton increased to 2.00–2.50 day-1 in May–
June 2006–2007, to 1.00 day-1 in September 2006 and
to 0.60 day-1 in February 2007. The intensity of
02 04 06 08 10
Month 2010
0 0.2 0.4 0.6 0.8 1
0 0.2 0.4 0.6 0.8 1
,
d
a
y
-1
d
0 10 20 30 40 50
I,
E
. m
-2. d
a
y
-1
02 04 06 08 10
0 2 4 6
0 100 200 300 400
B
io
m
a
s
s
,
m
g
Ñ
. m
-3
c
5 10 15 20 25 30
T
,
oC
04 06 08 10 12 02 04 06
Month
2006 2007
0 1 2 3
g
,
d
a
y
-1
0 1 2 3 b
1 2
3
0 10 20 30 40 50
04 06 08 10 12 02 04 06
0
2 4 6
N
-N
O3
,
M
0 100 200 300 400 a
1 2
3
5 10 15 20 25 30
Figure 2. The seasonal dynamics of phytoplankton biomass (a, c, 1), nitrates (a, c, 2), temperature of water (a, c, 3), intensity of photosynthetic active radiation (b, d, 3), microzooplankton grazing rate (b, d, 1) and phytoplankton growth rate (b, d, 2), in the surface waters of the Sevastopol Bay.
Table 1. The relative biomass of the main taxonomic groups (B, %) and dominant species of phytoplankton in the surface water of the Sevastopol Bay in 2006–2007 and 2010
Season (month) BBacil, BDinoph, Bother Dominant species n
Winter (December-February) 60±37 34±34 6±4 Skeletonema costatum, Chaetoceros socialis, Thalassiosira parva, Thalassionema nitzschoides Prorocentrum cordatum
14
Spring (March-May) 47±30 47±25 6±3 Chaetoceros curvisetus,
Chaetoceros socialis,
Pseudo-nitzschia delicatissima, Prorocentrum micans,
Prorocentrum cordatum
36
Summer (June) 33±17 62±17 5±4 Chaetoceros curvisetus,
Chaetoceros socialis, Gymnodinium simplex, Prorocentrum cordatum
14
Summer (July) 27±31 68±29 4±2 Gymnodinium simplex,
Gymnodinium sp., Prorocentrum cordatum
12
Summer (August) 25±22 70±28 5±6 Gymnodinium simplex,
Prorocentrum cordatum 14
Autumn (September-November )
48±22 48±23 4±2 Pseudo-nitzschia delicatissima, Chaetoceros curvisetus, Dactyliosolen fragilissimus, Cerataulina pelagica, Prorocentrum micans, Prorocentrum cordatum
14
*Bacillariophyta (Bbacil,,), Dinophyta (Bdinoph,,) and some other (Bother)
m
g
C
.m
September and about 10 E m-2 day-1 in February.
Concurrently, as Figure 2 shows, phytoplankton consumption by microzooplankton increased to 1.50– 1.80 day-1 in May–June 2006–2007 and decreased to
0.30 day-1 in September 2006 and to 0.20 day-1 in
February 2007. Note worthily, as the bloom only started, the loss nearly always was estimated as 53– 73% of the specific growth rate of phytoplankton; as the bloom ceased, it approximated 100%. During 2010 the peaks of phytoplankton biomass–150 and 300 mg C/m3–were registered in February and in July,
correspondingly (Figure 2) when nitrate content in the sea water was 1–2 µМ.
In February the diatom S. costatum prevailed, and in July two small dinoflagellates, Gymnodinium simplex and P. cordatum, which accounted for nearly 87% of the total phytoplankton biomass. Specific growth rate of the phytoplankton was 0.60 day-1 in
February and 0.80 day-1 in July and microzooplankton
grazing rate–0.20 and 0.60 day-1, correspondingly.
The sea surface temperature was approximately 8°C in February and increased about 3 times in July. The ratios between the rates of microzooplankton grazing and phytoplankton growth observed in these months were 33% and 76%, correspondingly. In March 2010, when the winter bloom of S. costatum was approaching its final, g/µ ratio has rocketed to 250%, and in August, in the end of the bloom due to the small dinoflagellates it increased to 130%.
The Spatial Variability of Phytoplankton Biomass, Growth Rate and the Loss due to
Microzooplankton Grazing.
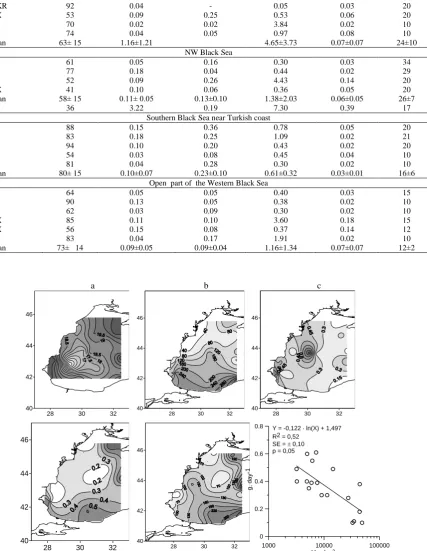
During September–October 2005, the depth of upper mixed water layer (UML) in the western Black Sea varied from 10 to 35 m (Table 2). In this region of the sea with the surface layer 14–20.5°С warm (Figure 3) and the intensity of photosynthetic active radiation (PAR) of 18–34 E·m-2·day-1 diatoms
prevailed, mainly Pseudosolenia calcar-avis, Cerataulina pelagica, Proboscia alata and Pseudonitzschia seriata. Similarly, diatoms produced the major part of phytoplankton biomass over the greater extent of the studied seawater areas (Table 2).
Small forms (Cerataulina pelagica) prevailed only near the Turkish coast whereas very large (Pseudosolenia calcar-avis and Proboscia alata) in all other locations. Dinoflagellates Prorocentrum micans, Protoperidinium sp. and Gymnodinium sp. dominated only in phytoplankton at station 35 positioned near the Danube’s mouth. Figure 3 evidences that in the coastal sea waters of Bulgaria and Turkey temperature of surface water was about 18–20°C and phytoplankton biomass was largest (≥200 mg C/m3) that conformed to the level of bloom
whereas in other seawater areas it was 2–5 times as less. The coastal sea water of Bulgaria was highly enriched with nutrients: average estimates of nitrates, silicon and phosphates were 1.16, 4.65 and 0.07 µМ,
correspondingly, whereas near the Turkish shore lowest amounts of these nutrients were registered. The specific growth rate of phytoplankton by the Turkish shore was rather low (0.10–0.20 day-1) with
the specific rate of microzooplankton grazing 3–5 times as high as the former. Therefore the g/µ ratio was greater than 200%. Near the Bulgarian shore the specific growth rate ranged from 0.45 to 1.00 day-1
and the specific grazing rate was estimated as 60– 67% of the specific growth rate of phytoplankton. From the central to the northwestern part of the sea phytoplankton biomass decreased from 160 to 40 - 80 mg C/m3 and the surface temperature increased from
17 to 20.5 °C. In these regions of the sea nitrates and phosphates were estimated as 0.10 and 0.06–0.07 µМ on the average, correspondingly, and specific growth rate of phytoplankton was as low as 0.20–0.30 day-1.
To conform to the background, specific microzooplankton grazing activity was similarly low. The exception was a seawater area influenced by the inflowing Danube (station 35) and rich with the full spectrum of nutrients (Table 2) that, however, did not stimulated an increase of the phytoplankton growth rate estimated 0.33 day-1.
The quantitative correlation showing that the increase of g to a maximum is typical of the cases when the dominant phytoplankton were relatively small diatoms, e.g., C. pelagica and P. seriata. As the portion of large unicells, such as P. alata and P. calcar-avis, increased in the phytoplankton, the microzooplankton grazing impact declined (Figure 3). In late May 2013, the temperature measured in the surface of the Black Sea was about 20°C warm, the average PAR 44 E·m-2·d -1 and the depth of UML
ranged between 4 and 19 m, ~10 m on the average. Nearly all of the inspected seawater areas were blooming of Emiliania huxleyi. The coccolithophore E. huxleyi, which dominated among Primnesiophyta that time, had the abundance varying from 1.2x10⁶ to
4.3x10⁶ cell·L-1 (Table 3) and the biomass between
60–90 % of the total phytoplankton biomass (Table 4). Low chlorophyll а estimates (0.09–0.18 mg/m3)
evidence that during the coccolithophore bloom phytoplankton biomass was low. The abundance of E. huxleyi was markedly lesser only at stations 33 and 34 located in close vicinity to the Dnieper’s mouth. The biomass of phytoplankton was largely due to diatoms, primarily Cyclotella caspia. Chlorophyll a also increased to 1.10 and 0.33 mg/m3, correspondingly.
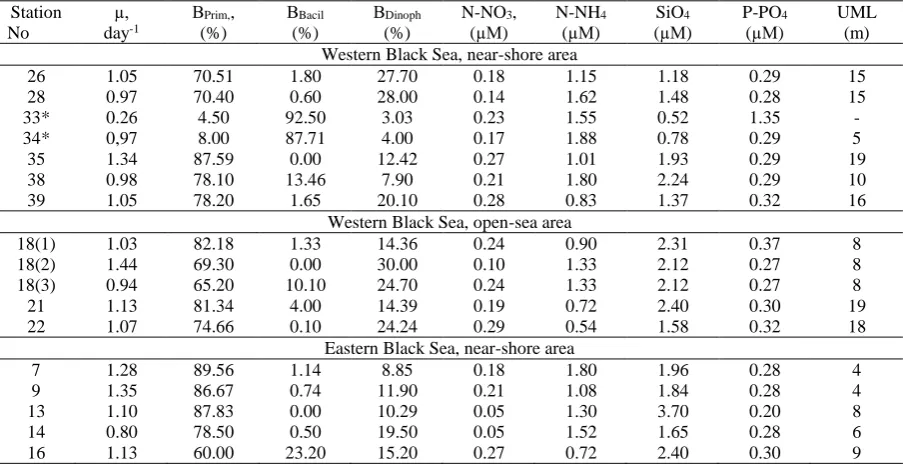
The coccolithophore bloom formed against low nitrate content–from 0.05 to 0.28 µМ–and an order of magnitude greater ammonium in the sea water; phosphates were also in abundance (≥0.20 µМ). Specific growth rates of the phytoplankton in the blooming areas varied only inconsiderably (0.80–1.44 day-1). Based on our records, the specific rate of
phytoplankton consumption by microzooplankton (g) in the surface seawater layer usually ranged from 0.04 to 0.99 day -1. The rate of microzooplankton grazing
Table 2. The relative biomass of Bacillariophyta (BBacil,, % of total phytoplankton biomass), main nutrients in the sea surface
and in the upper mixed water layer (UML) in the Black Sea in September – October 2005
Station No
BBacil
(%)
N-NO3 (µM)
N-NH4 (µM)
SiO4 (µM)
P-PO4 (µM)
UML (m) Coastal sea water by Varna (Bulgaria)
Varna 50 1.80 - 7.65 0.07 30
G 65 2.50 - 8.37 0.03 33
P1KR 58 2.55 - 8.55 0.03 35
P4KR 44 2.20 - 7.27 0.23 30
P6KR 92 0.04 - 0.05 0.03 20
38X 53 0.09 0.25 0.53 0.06 20
52 70 0.02 0.02 3.84 0.02 10
54 74 0.04 0.05 0.97 0.08 10
Mean 63± 15 1.16±1.21 4.65±3.73 0.07±0.07 24±10
NW Black Sea
16 61 0.05 0.16 0.30 0.03 34
20 77 0.18 0.04 0.44 0.02 29
25 52 0.09 0.26 4.43 0.14 20
33X 41 0.10 0.06 0.36 0.05 20
Mean 58± 15 0.11± 0.05 0.13±0.10 1.38±2.03 0.06±0.05 26±7
35* 36 3.22 0.19 7.30 0.39 17
Southern Black Sea near Turkish coast
0 88 0.15 0.36 0.78 0.05 20
0 83 0.18 0.25 1.09 0.02 21
2 94 0.10 0.20 0.43 0.02 20
5 54 0.03 0.08 0.45 0.04 10
55 81 0.04 0.28 0.30 0.02 10
Mean 80± 15 0.10±0.07 0.23±0.10 0.61±0.32 0.03±0.01 16±6
Open part of the Western Black Sea
9 64 0.05 0.05 0.40 0.03 15
10 90 0.13 0.05 0.38 0.02 10
30 62 0.03 0.09 0.30 0.02 10
40X 85 0.11 0.10 3.60 0.18 15
41X 56 0.15 0.08 0.37 0.14 12
43 83 0.04 0.17 1.91 0.02 10
Mean 73± 14 0.09±0.05 0.09±0.04 1.16±1.34 0.07±0.07 12±2
a b c
28 30 32
40 42 44 46
1000 10000 100000
V, mkm3
0 0.2 0.4 0.6 0.8
g
,
d
a
y
-1
Y = -0,122 . ln(X) + 1,497 R2 = 0,52
SE = 0,10
p = 0,05
28 30 32
40 42 44 46
28 30 32
40 42 44 46
28 30 32
40 42 44 46
28 30 32
40 42 44 46
d e f
Figure 3. The seawater temperature (a), biomass (b, mgC·m-3) and specific growth rate of phytoplankton (c, day-1),
microzooplankton grazing rate (d, day-1), ratio g/µ (%) and correlation between mean cell volume of the phytoplankton and
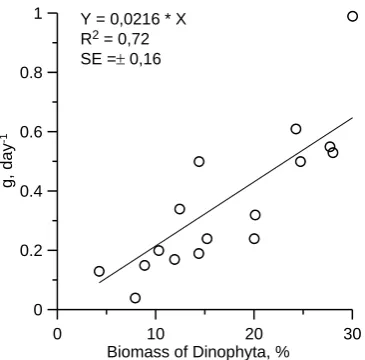
dinoflagellates in the total phytoplankton biomass (Figure 4). The minimums and maximums of phytoplankton loss from the grazing concurred with the minimal and maximal percentage of dinoflagellates in the total phytoplankton biomass. In the blooming deep-water areas the percent ratio g/µ fluctuated between 18–72%, 51% on the average, and in the shallow-water locations of the western Black Sea between 4–204%, 55% on the average. In the eastern part of the sea this ratio was minimal–19% on
the average.
Discussion
Maximums of phytoplankton biomass are regularly registered twice or thrice a year in the coastal sea water of Sevastopol often; most frequently they concentrate within stratified water depth and are due to diatom growth. Maximum that is due to summer vegetative process of dinoflagellates is a rare
Table 3. The microzooplankton grazing rate (g), net phytoplankton growth rate (µ-g), the ratio g/µ, chlorophyll-a concentration (Chl a) and E. huxleyi abundance over the Black Sea in May 2013
Station No
E. huxleyi (cell/l*106)
Chl а (mg/m3)
g (day-1)
µ - g (day-1)
g/µ (%) Western Black Sea, near-shore area
26 28 33* 34* 35 38 39 4.2 3.0 0.5 0.15 1.8 2.5 2.1 0.11 0.12 1.10 0.33 0.09 0.11 0.11 0.55 0.53 0.53 0.13 0.34 0.04 0.32 0.65 0.64 -0.27 0.84 1.00 0.94 0.73 52 55 204 13 25 4 30 Western Black Sea, open-sea area
18(1) 18(2) 18(3) 21 22 1.7 1.3 1.2 2.7 2.6 0.13 0.13 0.10 0.11 0.10 0.19 0.99 0.50 0.50 0.61 0.84 0.45 0.44 0.63 0.46 18 69 53 44 72 Eastern Black Sea, near-shore area
7 9 13 14 16 4.2 4.3 1.9 1.6 2.0 0.18 0.14 0.10 0.11 0.10 0.15 0.17 0.20 0.24 0.24 1.12 1.18 0.90 0.56 0.89 12 13 18 30 21
Table 4. The phytoplankton growth rate (µ), relative biomass of Primnesiophyta (Bprim,), Bacillariophyta (Bbacil,) and
Dinophyta (Bdinoph,) and nutrients over the Black Sea in May 2013
Station No
µ, day-1
ВPrim,,
(%)
ВBacil
(%)
ВDinoph
(%)
N-NO3,
(µМ) N-NH4 (µМ) SiO4 (µM) P-PO4 (µМ) UML (m) Western Black Sea, near-shore area
26 28 33* 34* 35 38 39 1.05 0.97 0.26 0,97 1.34 0.98 1.05 70.51 70.40 4.50 8.00 87.59 78.10 78.20 1.80 0.60 92.50 87.71 0.00 13.46 1.65 27.70 28.00 3.03 4.00 12.42 7.90 20.10 0.18 0.14 0.23 0.17 0.27 0.21 0.28 1.15 1.62 1.55 1.88 1.01 1.80 0.83 1.18 1.48 0.52 0.78 1.93 2.24 1.37 0.29 0.28 1.35 0.29 0.29 0.29 0.32 15 15 - 5 19 10 16 Western Black Sea, open-sea area
18(1) 18(2) 18(3) 21 22 1.03 1.44 0.94 1.13 1.07 82.18 69.30 65.20 81.34 74.66 1.33 0.00 10.10 4.00 0.10 14.36 30.00 24.70 14.39 24.24 0.24 0.10 0.24 0.19 0.29 0.90 1.33 1.33 0.72 0.54 2.31 2.12 2.12 2.40 1.58 0.37 0.27 0.27 0.30 0.32 8 8 8 19 18 Eastern Black Sea, near-shore area
phenomenon (Polikarpov et al., 2003; Stelmakh et al., 2010). Favourable temperature, light and nutrient availability stimulate increase of phytoplankton growth rate and, eventually, biomass of the phytoplankton. According to our records about the Sevastopol Bay, main peaks of phytoplankton biomass were usually observed from May to October, when light and temperature favoured high microalgal growth rate. Relatively large content of nitrates (over 1 µМ) during the warm period also stimulated the phytoplankton to increase specific growth rate to maximum. To trigger an increase of phytoplankton numbers and biomass and formation of algal blooms it is essential that phytoplankton growth rate were greater than loss from microzooplankton grazing impact. Our investigation has shown that in the beginning of bloom formation phytoplankton growth rate was conspicuously greater than the rate of phytoplankton loss from grazing by microzooplankton (g/µ ≤75%). As the grazing impact exceeded growth of microalgae, phytoplankton biomass decreased. Similar relationship between microzooplankton grazing impact and phytoplankton biomass was noticed during investigations conducted in two coastal areas of the Northern Pacific in 1995–1996 (Strom et al., 2001). Summer increase of phytoplankton biomass developed when g/µ ratio was not larger than 70%. In November 1986, as Halifax Bay (Canada) was blooming of large diatoms, the rate at which microzooplankton consumed phytoplankton was assessed 0.03 day-1 (Gifford, 1988). Inasmuch as only
10% of the primary production was consumed by microzooplankton that has provoked a bloom. In March g ranged from 0.72 to 1.40 day-1 and
phytoplankton loss to growth ratio was estimated 120 % thereby explaining decrease of the phytoplankton biomass. Presumably, as a bloom is fading, both microzooplankton and mesozooplankton enhance their grazing impact on the phytoplankton (Sherr and Sherr, 2007). It should be remembered that not phytoplankton alone but also microzooplankton are prey to mesozooplankton (Putland and Iverso, 2007).
As our investigation evidences, in September– October 2005 rich content of nutrients in the coastal sea water of Bulgaria favoured high phytoplankton growth. In this region, compared to other studied areas of the sea, phytoplankton showed the highest specific growth rate with g/µ ratio about 70 % and lesser that, hypothetically, could stimulate the blooming on. The bloom we observed near the shore of Turkey was, presumably, approximating the end inasmuch as the sea water was depleted of nutrients, primarily nitrogen, and the loss of phytoplankton due to microzooplankton grazing was greater than 200%.
In May 2013, the E. huxleyi bloom developed under favourable light and temperature whereas concentrations of nitrates measured in the sea water were extremely low. Nevertheless, ammonia nitrogen and phosphates which ranged from 0.54 to 1.80 µМ and 0.20–0.30 µМ, correspondingly, could have been advantageous to the intensive growth and overabundance of this coccolithophore. At the same time, in May 2013, consumption of phytoplankton by microzooplankton, as we registered everywhere over the studied areas of the Black Sea, was considerably lesser than phytoplankton growth rate that also added to bloom formation.
Two major factors involved in the regulation of microzooplankton predatory pressure were the quantity and quality of prey phytoplankton (Stelmakh, 2013). The quality, or prey selectivity, was of prime importance where the abundance of prey phytoplankton attained a satiety point. For instance, in October 2006, phytoplankton production in the Sevastopol Bay was as large as 350 mg С/m3 whereas
the grazing impact of microzooplankton was negligible. The fact that the phytoplankton biomass was composed mainly by two large-celled species, the diatom Pseudosolenia calcar-avis and the dinoflagellate Ceratium furca, explains this seeming discord. The former is not a prey appreciated by the microzooplankton (Stelmakh et al., 2009), and the latter is only an episodic prey to some heterotrophic dinoflagellates, e.g., Protoperidinium steinii (Olseng
0 10 20 30
Biomass of Dinophyta, % 0
0.2 0.4 0.6 0.8 1
g
,
d
a
y
-1
Y = 0,0216 * X R2 = 0,72
SE =0,16
et al., 2002). In September–October 2005, when a diatom bloom advanced in the western Black Sea, it was noticed that with the increase of the portion of P. calcar-avis and P. alata in the total phytoplankton biomass, the specific rate of phytoplankton loss from microzooplankton impact decreased. Another minor to ignored prey is Emiliania huxleyi: in October– November 2010, during the autumn bloom of this coccolithophore in the western Black Sea, in the locations where E. huxleyi was especially abundant (1.5–3 million cell/L) the microzooplankton grazing impact often vanished (Stelmakh et al., 2013). Yet the prey to the taste to microzooplankton is diverse, varying from long-chain diatoms (Sherr and Sherr, 2007) to large dinoflagellates (Olseng et al., 2002). Phytoplankton mortality from microzooplankton grazing was usually greatest when diatoms of genus Chaetoceros prevailed in the phytoplankton; this fact has underlain the assumption about the favorite prey for the microzooplankton. In 2010, the abnormally warm year, phytoplankton biomass in the Sevastopol Bay was largely due to dinoflagellates which had specific growth rate 2–3 times as less as diatoms (Stelmakh et al., 2010). In 2010, the average phytoplankton loss from microzooplankton grazing was about twice as less as in 2006–2007. The lower specific rate of microzooplankton grazing could have been due to the quantitatively smaller fraction of diatoms.
With phytoplankton growth rate greater than the loss from microzooplankton grazing, the bloom started. As our records show, maximal difference between the two rates is typical of the peak blooming. Near Sevastopol, the blooms began with g/µ ratio of 53-73%. In May 2013, we observed a beginning bloom of the coccolithophore E. huxley in the areas of the Black Sea where the average ratio between phytoplankton consumption by microzooplankton and specific growth rate of the phytoplankton was 51%, not greater. In September–October 2005, the g/µ ratios not above 67% suggested that the diatom bloom near the Bulgarian shore would expand, whereas the bloom near the Turkish shore has vanished as the estimates of microzooplankton grazing rate several times larger than the rate of phytoplankton growth evidenced.
It is known that expressed as percentage, g/µ ratio indicates the portion of primary production removed due to microzooplankton grazing. According to our observations, the pertinent estimates kept large throughout the year in the coastal sea of Sevastopol and over the studied regions in the western and eastern Black Sea in spring and in autumn. For instance, in the Sevastopol Bay g/µ averaged for the year was 65%. Therefore, we suppose that as a member of microplankton assemblage of the Black Sea microzooplankton performs an important trophic function by removing large or, sometimes, the major part of the phytoplankton primary production.
Acknowledgements
We are thankful to I.I. Babich (IBSS, Sevastopol) for phytoplankton biomass measurements and species identification, N.Yu. Rodionova (IBSS, Sevastopol) and S. Tugrul (METU-Institute of Marine Sciences, Erdemli, Turkey) for determination of nutrients.
References
Calbet, A. and Landry, M. R. 2004. Phytoplankton growth, microzooplankton grazing, and carbon cycling in marine systems. Limnol. Oceanogr., 40: 51-57. doi: 10.4319/lo.2004.49.1.0051
Сalbet, A. 2008. The trophic roles of microzooplankton in marine systems. ICES J. Mar. Sci., 65: 325-331.
doi: 10.1093/icesjms/fsn013
Dolan, J.R., Gallegos, C.L. and Moigis, A. 2000. Dilution effects on microzooplankton in dilution grazing experiments. Mar. Ecol. Progr. Ser., 200: 127-139. doi:10.3354/meps200127
JGOFS Protocols 1994. Protocols for the Joint Global Ocean Flux Study (JGOFS) Core Measurements, Manual and Guides, No: 29, UNESCO Scientific Comitte, Geneva, 210 pp.
Fahnenstiel, G.L., McCormick, M.J., Lang, G.A., Redalje, D.G., Lohrenz, S.E., Markowitz, M., Wagoner, B. and Carrick, H. J.1995. Taxon-specific growth and loss rates for dominant phytoplankton populations from the northen Gulf of Mexico. Mar. Ecol. Progr. Ser., 117: 229-239.
Lаndry, M.R. and Hassett, R.P. 1982. Estimating the grazing impact of marine micro-zooplankton. Marine Biology, 67: 283- 288.
Landry, M.R., Kirchtein, J. and Constantinou, J. 1995. A refined dilution technique for measuring the community grazing impact of microzooplankton with experimental tests in the central equatorial Pacific. Mar. Ecol. Progr. Ser., 120: 53-63. doi: 10.3354/meps 12005
Landry, M.R., Constantinou, J., Latasa, M., Brown, S.L., Bidigare, R.R. and Ondrusek, M. E. 2000. Biological response to iron fertilization in the eastern equatorial Pacific (IronEx II). III. Dynamics of phytoplankton growth and microzooplankton grazing. Mar. Ecol. Progr. Ser., 201: 57-72. doi: 10.3354/meps201057
Olseng, C.D., Naustvoll, L.J. and Paasche, E. 2002. Grazing by the heterotrophic dinoflagellates Protoperidinium
steinii on a Ceratium bloom. Mar. Ecol. Prog. Ser.,
225: 161-167. doi: 10.3354/meps225161
Palomares-Garcia, R., Bustillos-Guzman, J.J. and Lopez-Cortes, D. 2006. Pigment-specific rates of phytoplankton growth and microzooplankton grazing in a subtropical lagoon. J. Plankton Res., 28: 1217-1232. doi: 10.1093/plankt/fbl051
Paterson, H.L., Knott, B. and Waite, A.M. 2007. Microzooplankton community structure and grazing on phytoplankton in an eddy pair in the Indian Ocean off Western Australia. Deep-Sea Research II, 54: 1076-1093. doi: 10.1016/j.dsr2.2006.12.011
current state of coastal waters of Crimea (the Black Sea sector). Sevastopol: 65-78 (in Russian).
Putland, J.N. and Iverson, R.L. 2007. Microzooplankton: major herbivores in an estuarine planktonic food web. Mar. Ecol. Progr. Ser., 345: 63-73. doi:10.3354/meps 06841.
Quevedo, M. and Anadon, R. 2001. Protist control of phytoplankton growth in the subtropical north-east Atlantic. Mar. Ecol. Progr. Ser., 22: 29-38. doi:10.3354/meps221029
Redden, A.M., Sanderson, B.G. and Rissik, D. 2002. Extending the analysis of the dilution method to obtain the phytoplankton concentration at which microzooplankton grazing becomes saturated. Mar. Ecol. Progr. Ser., 226: 27-33. doi:10.3354/meps 226027
Saiz, E. and Calbet, A. 2011. Copepod feeding in the ocean: scaling patterns, composition of their diet and the bias of estimates due to microzooplankton grazing during incubations. Hydrobiologia, 666: 181-196.
doi: 10.1007/s10750-010-0421-6
Sherr, E.B. and Sherr, B.F. 2007. Heterotrophic dinoflagellates: a significant component of microzooplankton biomass and major grazers of diatoms in the sea. Mar. Ecol. Prog. Ser., 352: 187-197. doi: 10.3354/meps07161
Sorokin, Yu. I., Sukhanova, I.N. and Konovalova G.V. 1975. The primary production and the phytoplankton of the equatorial divergence area in the eastern Pacific Ocean. Proc. Institute of Oceanology. Ac. Sci. USSR. 102: 108-122 (in Russian).
Stelfox-Widdicombe, C.E., Edwards, E.S., Burkill, P.N. and Sleigh M.A. 2000. Microzooplankton grazing activity in the temperate and subtropical NE Atlantic: summer 1996. Mar. Ecol. Progr. Ser., 208: 1-12.
doi: 10.3354/meps208001
Stelmakh, L.V., Babich, I.I., Tugrul, S., Moncheva, S. and Stefanova, K. 2009. Phytoplankton growth rate and zooplankton grazing in the western part of the Black Sea in the autumn period. Oceanology, 49: 83-92. doi: 10.1134/S000143700901010X
Stelmakh, L.V., Akimov, A.I., Kuftarkova, E.A., Babich, I.I. and Kozhemyaka, A.B. 2010. Using a variable fluorescence in vivo to assess the functional status of phytoplankton. Environmental Systems Control. Sevastopol, 13: 263-268 (in Russian).
Stelmakh, L.V. 2013. Microzooplankton Grazing Impact on Phytoplankton Blooms in the Coastal Seawater of the Southern Crimea (Black Sea). International Journ. Mar. Science., 15(3): 121-127. doi:10.5376/ijms. 2013.03.0015
Stelmakh, L.V., Kuftarkova, E.A. and Babich, I.I. 2013. The rates of phytoplankton growth and loss due to microzooplankton grazing during an autumn bloom of Еmiliania huxleyi in the western Black Sea. Morskoi Ekologicheskyi Zhurnal, 12(2): 51-62 (in Russian). Strom, S.L., Brainard, M.A., Holmes, J.L. and Olson, L.B.