This is an open access journal, and articles are distributed under the terms of the Creative Commons Attribution-Non Commercial-ShareAlike 4.0 License, which allows others to remix, tweak, and build upon the work non-commercially, as long as appropriate credit is given and the new creations are licensed under the identical terms.
© 2018 Journal of Advanced Pharmacy Education & Research | Published by SPER Publication 9
Validation parameters of densitometric method for simultaneous
determination of Galantamine hydrobromide and Pymadine
Dobrina Tsvetkova
1*, Stefka Ivanova
11Medical University-Sofia, Faculty of Pharmacy, Department of Pharmaceutical Chemistry, 2 Dunav Str., Sofia 1000, Bulgaria
Correspondence: Dobrina Tsvetkova, Department of Pharmaceutical Chemistry, Faculty of Pharmacy, Medical University-Sofia, Dunav str. N: 2, 1000, Sofia, Bulgaria. E mail: dobrinka30 @ mail.bg
ABSTRACT
The aim of the current investigation was the development and validation as per ICH requirements of the TLC-densitometric method
with the detection at λ = 282 nm for the simultaneous determination of Galantamine hydrobromide and Pymadine in model mixtures.
The aim was in accordance to the perspectives of multi-target therapy of Alzheimer’s disease, and due to the fact that in the literature and pharmacopoeial articles the methods for simultaneous analysis of these components haven’t been described. Selectivity was confirmed by the fact that in blank solution, Rf data weren’t observed corresponding to Rf data of the active ingredients. The
regression equations obtained demonstrated the linear relationship between the peak area and concentration: y = 2.107.x + 25364
(Galantamine hydrobromide) (LOD = 1.87.10-3 g/ml; LOQ = 6.22.10-3 g/ml); y = 2.107.x + 65930 (Pymadine) (LOD = 2.5.10-3
g/ml; LOQ = 8.35.10-3 g/ml). All the experimental data for the degree of recovery were included in the corresponding confidence
interval: 93.54 % ÷ 97.32 % (Galantamine hydrobromide); 100.05 % ÷ 103.11 % (Pymadine). The results of precision suited the relevant intervals.
System suitability was confirmed by the lack of a statistically significant difference between the Rf values: 0.663 (Galantamine hydrobromide); 0.433 (Pymadine). The method was appropriate for the simultaneous determination of Galantamine hydrobromide and Pymadine in the model mixtures.
Keywords: Densitometry, Galantamine, Pymadine, validation, determination.
Introduction
Alzheimer is a neurodegenerative disease [1] associated
with plaques and tangles in the brain [2]. The conventional
therapy is with Galantamine (Fig. 1.), Donepezil and
Rivastigmine [3]. A potent inhibitory activity against
acetylcholinesterase possess the extracts of Ocimum sanctum [4]
and Cinnamon zeylanicum [5].
In Alzheimer’s disease [6], Galantamine improves the behavior [7]
by blocking the reversible enzyme acetylcholinesterase and
allosterically potentiation of α7-nicotinic acetylcholine
receptors [8], and improves learning and memory alone and in
combination with Pymadine [9].
Reactive oxygen species induce neurodegeneration in
Alzheimer's disease [10], and Galantamine is appropriate for the
treatmennt due to the antioxidant properties [11].
4-aminopyridine (Dalfampridine) (Fig. 1.), has been a drug for
the symptomatic management of the multiple sclerosis [12] and it
improves walking [13].
Figure 1. Chemical structures of Galantamine hydrobromide and 4-aminopyridine.
For the analysis of Galantamine in Nivalin, HPLC has been
applied [14]. By High Performance Thin Layer Chromatography
(HPTLC), Gallic acid, Curcumin and Quercetin are analysed
[15]. TLC is often applied for the analysis of plant extracts:
Psidium guajava [16], Nelumbo nucifera [17], Galantamine in
Access this article online
Website:www.japer.in E-ISSN: 2249-3379
How to cite this article: Dobrina Tsvetkova, Stefka Ivanova.Validation
parameters of densitometric method for simultaneous determination of Galantamine hydrobromide and Pymadine. J Adv Pharm Edu Res 2018;8(4):9-14.
Galanthus species [18]. For Galantamine in Galanthus species
extracts, Silicagel G60F254 or aluminium are used; spots are
displayed by quenching the fluorescence at λ = 254 nm, or
spraying with Dragendorf reagent or iodine vapour; and the mobile systems are: chloroform : ethylacetate : methanol = 20
: 20 : 10 v/v (Galanthus nivalis L..;Galanthus elwesii Hook. Fil.);
chloroform : methanol : 25 % ammonia = 90 : 9 : 1 v/v (Galanthus nivalis L.)[18].
HPTLC has been applied for the analysis of the extracts of
Narcissus jonquilla Pipit [19], and TLC-densitometry has been used
for the quantification of Galantamine in the extracts of Galanthus
elwesii Hook and Galanthus nivalis L [20].
TLC-extraction-spectrophotometric analysis has been
developed for Galantamine in the extracts of Galanthus nivalis L.
subsp. cilicicus Baker [21] after derivatization reaction with
tropeolin 00 [18]. 3-hydroxy-4-aminopyridine has been analysed
by TLC [22].
As a part of a new trend of multi-target drug therapy of Alzheimer’s disease, future pharmacological investigations of combination Galantamine/Pymadine would be ongoing. On the other side, the quality control of the active substances has been important. In connection with these reasons, and due to the fact that in the literature and pharmacopoeial articles, the methods for the simultaneous analysis of Galantamine and Pymadine haven’t been described, the aim of the current study was the development and validation of the TLC-densitometric method for the simultaneous identitification, and the determination of Galantamine hydrobromide and Pymadine in the mixture as per
International Conference Harmonization [23] and validation
requirements [24, 25].
Materials
I. Pharmacopoeial purity compounds investigated:
Galantamine hydrobromide (Sopharma, N: 10796132); 4-aminopyridine.
II. Reagents with the pharmacopoeial purity: distilled
water.
III. Solvents with the pharmacopoeial purity: methanol
Chromasolv (99.9 %) (Sigma Aldrich, N: SZBD063AVUN1230); chloroform (Sigma Aldrich, N: SZBC186SVUN1888); acetone (Riiedel de Haën, N: STBG5763VUN1090); ethylacetate: (98.9 %) (Sigma Aldrich, N: 270989).
IV. TLC aluminium sheets Silicagel G60F254 (20 cm × 20
cm) (Merck, Germany, N:HX73683254).
Methods: TLC-densitometry.
I. Equipment.
TLC Densitometer TR 541a, wavelength scan mode λ = 282
nm, 10 μl micropipette (Hamilton, Bonaduz, Switzerland,
N:18005701), TLC chamber (22 cm/12 cm/22 cm).
II. Chromatographic conditions.
Stationary phase: Silicagel G60F254, mobile phase: chloroform:
acetone: ethylacetate: methanol = 20:10:5:5 v/v, UV
detection at λ = 282 nm, start-front distance: 150 mm.
III. Preparation of the solutions of reference substances including Galantamine hydrobromide and 4-aminopyridine for the validation of the densitometric method with respect of the analytical parameter linearity.
The accurate weighed quantities of the reference substances included: 0.01 g, 0.02 g, 0.03 g, 0.05 g, 0.1 g, 0.15 g, 0.3 g, (Galantamine hydrobromide) and 0.025 g, 0.05 g, 0.1 g, 0.15 g, 0.2 g, 0.25 g, 0.3 g, 0.35 g, 0.4 g (4-aminopyridine) were separatelly dissolved in the distilled water in 10.0 ml volumetric flasks for obtaining the solutions with concentrations of: 1.10–3 g/ml, 2.10–3 g/ml, 3.10–3 g/ml, 5.10–3 g/ml, 1.10–2
g/ml, 1.5.10–2 g/ml, 3.10–2 g/ml (Galantamine hydrobromide)
and 2.5.10–3 g/ml, 5.10–3 g/ml, 1.10–2 g/ml, 1.5.10–2 g/ml,
2.10–2 g/ml, 2.5.10–2 g/ml, 3.10–2 g/ml, 3.5.10–2 g/ml,
4.10–2 g/ml (4-aminopyridine).
IV. The preparation of model mixtures of
Galantamine hydrobromide and 4-aminopyridine for the validation of densitometric method with respect to the analytical parameters accuracy and internal precision (repeatability).
6 model mixes were prepared by measuring 0.2 g Galantamine hydrobrimide and 0.1 g 4-aminopyridine and dissolving in 10.0 ml distilled water.
V. Root limit mean square error method (RMSE) for the determination of the limit of detection (LOD) and the limit of quantitation (LOQ).
The data were subjected to the linear regression analysis. From the regression equation of: y = a.x + b, the predictable absorbance value (Ap); the error E = |Ap-A|; E2 = [|Ap-A|]2,𝐸𝐸1 =∑ 𝐸𝐸2
𝑛𝑛−2; 𝑅𝑅𝑅𝑅𝑅𝑅𝐸𝐸 =√𝐸𝐸1; LOD = 3.RMSE/а;
LOQ = 10.RMSE/аwere calculated [26].
Results and Discussion
I. Densitometric parameters for reference
solutions of Galantamine hydrobromide and Pymadine.
The densitometric parameters for Galantamine hydrobromide
(1.10-3 g/ml ÷ 3.10-2 g/ml) (Table 1.) and 4-aminopyridine
(1.10-2 g/ml ÷ 4.10-2 g/ml) (Table 2.) were summarized.
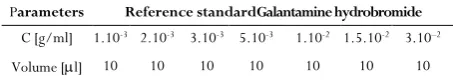
Table 1. Densitometric parameters for reference standard Galantamine hydrobromide
Parameters Reference standardGalantamine hydrobromide
C [g/ml] 1.10-3 2.10-3 3.10-3 5.10-3 1.10-2 1.5.10-2 3.10–2
Quantity
[µg/spot] 10 20 30 50 100 150 300 Rf 0.66 0.66 0.67 0.66 0.67 0.66 0.66
Diameter
(d)[cm] 0.1 0.2 0.3 0.6 1.2 1.3 1.6 Radius
(r) [cm] 0.05 0.1 0.15 0.3 0.6 0.65 0.8 Area
(S)[cm2] 0.01 0.03 0.07 0.28 1.13 1.33 2.01
Spot area
(A) 55200 83300 87600 115300 223600 336100 663000
Table 2. Densitometric parameters for reference standard 4-aminopyridine.
Parameters Reference standard 4-aminopyridine
C [g/ml] 1.10–2 1.5.10–2 2.10–2 2.5.10–2 3.10–2 3.5.10–2 4.10–2
Volume [µl] 10 10 10 10 10 10 10 Quantity
[µg/spot] 100 150 200 250 300 350 400 Rf 0.43 0.44 0.43 0.43 0.43 0.44 0.43
Diameter
(d)[cm] 1.2 1.3 1.4 1.55 1.6 1.65 1.8 Radius (r)
[cm] 0.6 0.65 0.7 0.78 0.8 0.83 0.9 Area (S)
[cm2] 1.13 1.33 1.54 1.91 2.01 2.16 2.54
Spot area
(A) 232000 370400 419000 494200 576200 633100 703100
II. Validation of densitometric method for
determination of Galantamine hydrobromide and Pymadine in model mixtures.
TLC method was validated for the analytical validation parameters’ selectivity, linearity, limit of detection, limit of quantitation, accuracy (precision) and internal precision (repeatability) according toICH [23].
1.
Selectivity
In the same manner like the reference solutions, a blank solution containing only a solvent was prepared and
chromatographed. Selectivity was confirmed by the lack of Rf
-data in the blank stolution corresponding to Rf-data of the
active ingredients: Galantamine hydrobromide (Rf =
9.9/15 = 0.663); Pymadine (Rf = 6.5/15 = 0.433).
2.
Linearity, LOD, LOQ.
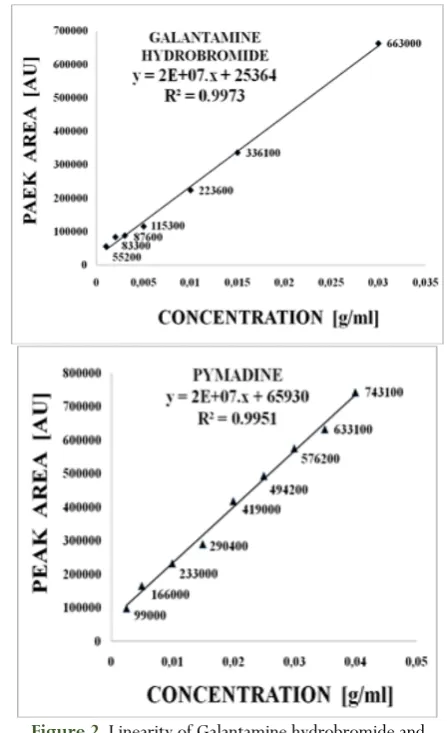
The experimental results were subjected to the linear regression analysis. The calibration curves showed the linear relationship between the peak area A, and the concentration C which were illustrated in Fig. 2.
Figure 2. Linearity of Galantamine hydrobromide and
Pymadine.
Linearity is the range within the signal from the detector that remains in the linear dependency from the concentration of the analyte [23].
For the analysis of linearity from the reference standards, a series of solutions with increasing concentrations of Galantamine
hydrobromide (1.10-3 g/ml ÷ 3.10-2 g/ml) and
4-aminopyridine (1.10-2 g/ml ÷ 4.10-2 g/ml) were prepared. The
peak areas were measured, and the results were included in Table 1. and 2.
In Table 3., the parameters of the regression equations, which demonstrated the linear relationship between the peak area and the concentration at the corresponding concentration intervals were described. Linearity was characterized by coefficients of the linear regression: R2> 0.995.
Table 3. Parameters of regression equations for Galantamine hydrobromide and Pymadine
N: Parameter Galantamine hydrobromide Pymadine 1. Linear interval [g/ml] 1.10–3÷ 3.10–2 2.5.10–3 ÷ 4.10–2
2. Regression equation y = 2.107.x + 25364 y = 2.107.x + 65930
3. Slope(a) 2.107 2.107
The results of the analysis of the standard solutions with increasing concentration of Galantamine hydrobromide (Table 4.) and 4-aminopyridine (Table 5.) for the investigation of linearity, LOD and LOQ were summarized as follows:
C [g/ml] – concentration, A – measured peak area, Ap – calculated by the calibration curve peak area.
LOD and LOQ were based on the regression equations: y =
2.107.x + 25364 (Galantamine hydrobromide) and y = 2.107.x +
65930 (Pymadine) (Тable 4.) by the application of
RMSE-method [23].
Table 4. Linearity, LOD and LOQ for Galantamine hydrobromide
N: C [g/ml] A Ap E = -A| p A | = 2 Е 2 ] | A – p A | [ 1. 1.10–3 55200 46372 8828 77933584
2. 2.10–3 83300 67381 15919 253414561
3. 3.10–3 87600 88389 789 622521
4. 5.10–3 115300 130406 15106 228191236
5. 1.10–2 223600 235448 11848 140375104
6. 1.5.10–2 336100 340490 4390 19272100
7. 3.10–2 663000 655615 7385 54538225 � 𝐸𝐸2 = 774347331 𝐸𝐸1 =𝑛𝑛 −∑ 𝐸𝐸22
= 154869466
𝑅𝑅𝑅𝑅𝑅𝑅𝐸𝐸 =√154869466 = 12444.66
= 7 2.10 / ) 12444.66 . 3 ( = LOD g/ml 3 -1.87.10 = 7 2.10 / ) 12444.66 . 10 ( = LOQ g/ml 3 -6.22.10
Table 5. Linearity, LOD and LOQ for Pymadine.
N: C [g/ml] A Ap |AЕ= p – A|
Е2=
[|Ap – A|]2
1. 2.5.10–3 99000 107856 8856 78428736
2. 5.10–3 166000 149783 16217 262991089
3. 1.10–2 233000 233636 636 404496
4. 1.5.10–2 290400 317489 27089 733813921
5. 2.10–2 419000 401342 17658 311804964
6. 2.5.10–2 494200 485195 9005 81090025
7. 3.10–2 576200 569047 7153 51165409
8. 3.5.10–2 633100 652900 19800 392040000
9. 4.10–2 743100 736753 6347 40284409 � 𝐸𝐸2
= 1952023049
𝐸𝐸1 =𝑛𝑛 −∑ 𝐸𝐸22 = 278860436
𝑅𝑅𝑅𝑅𝑅𝑅𝐸𝐸 =√278860436 = 16699.11
LOD= (3.16699.11)/2.107 = 2.5.10-3
g/ml LOQ= (10.16699.11)/2.10
7 =
8.35.10-3 g/ml III. Accuracy and internal precision (repeatability).
6 model mixtures containing 20 mg Galantamine hydrobromide (G) and 10 mg Pymadine (P) were analyzed by TLC, and the results for: peak
area (A): AG20, AP10 and Chauvenet’s criterion for peak area
(UA): UAG20, UAP10 were summarized in Table 6.
Table 6. Peak area and Chauvenet’s criterion for Galantamine hydrobromide and Pymidine in mixtures.
N: AP10 UAP10 AG20 UAG20
1. 266200 1.56 414500 0.04 2. 267500 0.86 417900 0.93 3. 269500 0.20 408700 1.69 4. 270000 0.47 416300 0.47 5. 270500 0.74 417700 0.87 6. 271000 1.01 412700 0.55
𝑋𝑋�±SD 269117±1871 414633±3516 RSD [%] 0.7 0.85
The contents of Galantamine hydrobromide [G20] and Pymadine
[P10] were calculated by the application of calibration curve
method, using the peak area of the components. The results for accuracy and repeatability were summarized in Table 7.
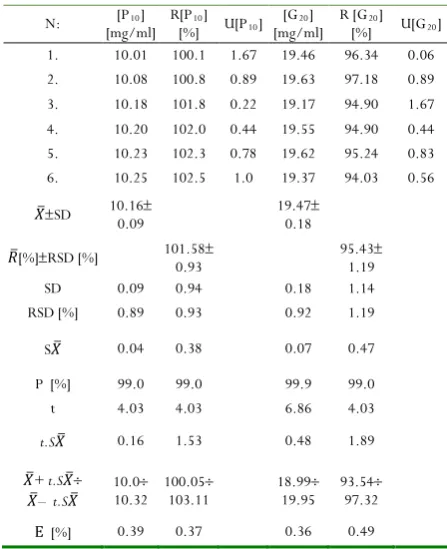
Table 7. Accuracy and repeatability for model mixtures of Galantamine hydrobromidePymadine.
N: [P10]
[mg/ml] R[P[%] 10] U[P10] [G[mg/ml] 20] R [G[%] 20] U[G20]
1. 10.01 100.1 1.67 19.46 96.34 0.06 2. 10.08 100.8 0.89 19.63 97.18 0.89 3. 10.18 101.8 0.22 19.17 94.90 1.67 4. 10.20 102.0 0.44 19.55 94.90 0.44 5. 10.23 102.3 0.78 19.62 95.24 0.83 6. 10.25 102.5 1.0 19.37 94.03 0.56
𝑋𝑋�±SD 10.160.09 ± 19.470.18 ±
𝑅𝑅�[%]±RSD [%] 101.580.93 ± 95.431.19 ± SD 0.09 0.94 0.18 1.14 RSD [%] 0.89 0.93 0.92 1.19 S𝑋𝑋� 0.04 0.38 0.07 0.47 P [%] 99.0 99.0 99.9 99.0 t 4.03 4.03 6.86 4.03
t.S𝑋𝑋� 0.16 1.53 0.48 1.89
𝑋𝑋�+ t.S𝑋𝑋�÷
𝑋𝑋�– t.S𝑋𝑋� 10.010.32 ÷ 100.05103.11 ÷ 18.9919.95 ÷ 93.5497.32 ÷
Е [%] 0.39 0.37 0.36 0.49
In Table 7., the results for: N – number of measurements
(1÷6); [G20], [P10] – quantity of components; R[G20], R[P10] –
degree of recovery [%]; U[G20], U[P10] – Chauvenet’s
criterion; 𝑋𝑋�– arithmetic mean; SD – standard deviation; RSD
[%] –related standard deviation; S𝑋𝑋�– mean square error; P –
confidence probability [%]; t – coefficient of Student; 𝑋𝑋�±t.S𝑋𝑋�– confidence interval; E – relative error [%], were summarized. Accuracy is the degree of the correspondence between the obtained average result of the repeated analysis and the actual values. For the model mixtures, accuracy was represented by
the degree of recovery R [%] ± RSD [%] as per ICH guidelines
[23]: 95.43 % ± 1.19 % (Galantamine hydrobromide); 101.58 %
± 0.93 % (Pymadine). SD and RSD were lower than 1.5, which
Repeatability is characterized by the uncertainty of the results,
which includes SD, RSD and the confidence interval [23], and in
this study, it was investigated on Galantamine hydrobromide and Pymadine content in 6 model mixtures. At the confidence level of P = 99.0 %, all the data for amounts suited the
corresponding confidence intervals: 18.99 mg ÷ 19.95 mg
(Galantamine hydrobromide);10.0 mg ÷ 10.32 mg (Pymadine).
The data for Chauvenet’s criterion were lower than the maximum permissible value (U = 1.73; N = 6), which confirmed that no statistically significant difference between the obtained quantities was observed, and this proved the repeatability of the results.
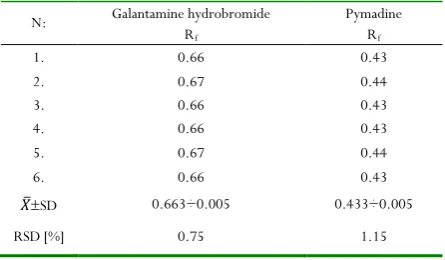
IV. System suitality test
The system suitability was confirmed by the lack of a statistically significant difference between the values for Rf:
𝑋𝑋�RRf = 0.663 (Galantamine hydrobromide);
___
XRf = 0.433
(Pymadine) (Table 8.).
Table 8. Rf for Galantamine hydrobromide and Pymadine in model mixtures.
N: Galantamine hydrobromide Pymadine
Rf Rf
1. 0.66 0.43 2. 0.67 0.44 3. 0.66 0.43 4. 0.66 0.43 5. 0.67 0.44 6. 0.66 0.43
𝑋𝑋�±SD 0.663÷0.005 0.433÷0.005 RSD [%] 0.75 1.15
Conclusion
Regression equations demonstrated a linear relationship between the peak areas and concentrations. All the experimental data for the degree of recovery and for the repeatability were included in the corresponding confidence interval. The system suitability was confirmed. The developed and validated TLC-densitometric method was appropriate for the simultaneous determination of Galantamine hydrobromide and Pymadine.
Conflicts of Interests
All authors had none to declare.
References
1. Nikolova I., Danchev N., Lamvov N., Grudeva V.
Neurodegenerative diseases in geriatry – opportunities of current pharmacotherapy. Clin. Homeopathy 2010; 1(1): 3-6.
2. Ballard C., Gauthier S., Corbett A., Brayne C., Aarsland
D., Jones E. Alzheimer's disease. Lancet 2011; 377(9770): 1019-1131.
3. Danchev N., Nikolova, I. Pharmacological treatment of
cognitive impairements in Alzheimer’s disease. Autonomic Autocoid Pharmacol. 2006; 26(1): 46-49.
4. Kandhan T.S., Thangavelu L., Roy A.
Acetylcholinesterase activity of Ocimum sanctum leaf
extract. J. Adv. Pharm. Edu. Res. 2018; 8(1): 41-44.
5. Jain P., Thangavelu L, Roy A. Acetylcholinesterase
activity of Cinnamon zeylanicum extract. J. Adv. Pharm.
Edu. Res. 2017; 7(4): 482-448.
6. Gaudig M., Richarz U., Han J., Van Baelen B., Schäuble
B. Effects of Galantamine in Alzheimer's disease: double-blind withdrawal studies evaluating sustained versus interrupted treatment. Curr. Alzheim. Res. 2011; 8(7): 771-780.
7. Marco L., Carreiras M.C. Galanthamine, a natural
product for the treatment of Alzheimer's disease. Recent. Pat. CNS Drug. Discov. 2006; 1(1): 105-111.
8. Takada-Takatori Y., Kume T., Izumi Y., Ohgi Y.,
Niidome T., Fujii T., Sugimoto H., Akaike A. Roles of nicotinic receptors in acetylcholinesterase inhibitor-induced neuroprotection and nicotinic receptor up-regulation. Biol. Pharm. Bull. 2009; 32(3): 318-324.
9. Markov M., Danchev N., Uzunov P., Higashino H.,
Suzuki A. Influence of Nivalin P on the training and memorizing processes in rats. Acta Med. Kinki. Univ. 1994; 19(2): 119-126.
10. Obreshkova D. Reactive oxygen species induced
neurodegeneration in Alzheimer's disease. Pharmacia 2013; 60(1): 71-82.
11. Tsvetkova D., Obreshkova D., Zheleva-Dimitrova D.,
Saso L. Antioxidant activity of Galanthamine and some of its derivatives. Curr. Med. Chem. 2013; 20(36): 4595-4608.
12. Espejo C., Montalban X. Dalfampridine in multiple
sclerosis: from symptomatic treatment to immunomodulation. Clin. Immunol. 2012; 142(1): 84-92.
13. Pikoulas T.E., Fuller M.A. Dalfampridine: a medication
to improve walking in patients with multiple sclerosis. Ann. Pharmacother. 2012; 46(7-8): 1010-1015.
14. Obreshkova D. Determination of Galanthamine and
related alkaloids in Nivalin. Compt. Rend. Acad. Bulg. Sci. 2000; 53(9): 51-54.
15. Thakker V.Y., Shah V.N., Shah U.D., Suthar M.P.
Simultaneous estimation of Gallic acid, Curcumin and Quercetin by HPTLC method. mice. J. Adv. Pharm. Edu. Res. 2011; 1(1): 70-80.
16. Sarkar J., Pal S., Bhattacharya S., Biswas M. Thin layer
chromatographic profiling and evaluation of analgesic activity of Psidium guajava leaf extracts in mice. J. Adv. Pharm. Edu. Res. 2011; 1(3): 177-183.
17. Bera S., Bhattacharya S., Pandey J.N., Biswas M. Thin
layer chromatographic profiling and evaluation of analgesic activity of Nelumbo nucifera leaf extracts in Swiss Mice J. Adv. Pharm. Edu. Res. 2011; 1(6): 259-265.
18. Novikova I.Y., Tulaganov A.A. Structure of chemical
Physicochemical methods for the analysis of Galanthamine. Pharm. Chem. J. 2002; 36(11): 623-627.
19. Mroczek T., Mazurek J. Pressurized liquid extraction and
anticholinesterase activity-based thin-layer
chromatography with bioautography of Amaryllidaceae alkaloids. Anal. Chim. Acta 2009; 633(2): 188-196.
20. Sidjimova B., Berkov S., Popov S., Evstatieva L.
Galanthamine distribution in Bulgarian Galanthus spp. Pharmazie 2003; 58(12): 935-936.
21. Kaya G.I., Gözler B. Quantitative and cytotoxic activity
determinations on Galanthus nivalis subsp. cilicicus. Fitoter. 2005; 76(3-4): 340-343.
22. Caggiano A., Blight A. Identification of metabolites of
Dalfampridine (4-aminopyridine) in human subjects and
reaction phenotyping of relevant cytochrome P450 pathways. J. Drug. Assess. 2013; 2(1): 117-126.
23. International Conference on Harmonization of Technical
Requirement for Registration ofPharmaceuticals for Human use, ICH harmonized tripartite Guideline, Validation of Analytical procedures Text and methodology Q2 (R1), 2005.
24. Gamil A.M. Validation as applied for pharmaceutical
processes. J. Adv. Pharm. Edu. Res. 2015; 5(2): 77-86.
25. Sudha T., Krishana K.V, Nukala P.C.S., Mishal, Saloman
R.T., Ganesan V. Method development and validation – a review. J. Adv. Pharm. Edu. Res. 2013; 2(3): 146-176.
26. Shrivastava A., Gupta V.B. Methods for the determination