Cite as
Kokacya O, Eser C, Kesiktas E, Gencel E, Tugsan Balli H, Acikalin A. Perforator artery response to tissue expan-sion: An experimental study in rabbits. Adv Clin Exp Med. 2019;28(9):1153–1159. doi:10.17219/acem/104530
DOI
10.17219/acem/104530
Copyright
© 2019 by Wroclaw Medical University This is an article distributed under the terms of the Creative Commons Attribution Non-Commercial License (http://creativecommons.org/licenses/by-nc-nd/4.0/)
Address for correspondence
Omer Kokacya
E-mail: kokacya@yahoo.com
Funding sources
The study was supported by a grant from Çukurova University Scientific Research Projects Fund (project No. TF2013LTP39).
Conflict of interest
None declared
Received on November 6, 2018 Reviewed on November 20, 2018 Accepted on February 18, 2019
Published online on August 19, 2019
Abstract
Background. The reconstruction of defects is a major area of interest in plastic surgery. Tissues are expanded to extend the tissue surface area and to prepare more reliable perforator flaps.
Objectives. Because expanded perforator flaps have become more popular, the aim of this study is to de-termine the response of the perforator artery to tissue expansion.
Material and methods. We used a rabbit S1 perforator (first perforator branch of the thoracodorsal arteries) flap model. In 12 New Zealand White rabbits, left flaps were used as the experimental group (n = 12) and right flaps were used as the control group (n = 12). Both flaps were constructed in the dorsal skin. The experimental group was further divided into 3 subgroups according to expansion volume: 150 mL (n = 4), 200 mL (n = 4) and 250 mL (n = 4). We evaluated the responses of the perforator arteries to tissue expansion using the resistivity index (RI), the pulsatility index (PI), vessel diameter (D), histopathological examinations, and angiography.
Results. After 3 weeks of expansion, the perforator artery diameter had increased (p = 0.002) and the RI had decreased (p = 0.031) in the experimental group. The perforator artery diameter (p = 0.006) and RI had increased (p = 0.003) in the control group. No significant changes were observed in the PI in either group (p > 0.05) and no significant differences in post-expansion measurements were observed between experimental subgroups (p > 0.05).
Conclusions. Suprafascial expansion of a perforator flap leads to an increase in diameter and a decrease in the RI of the perforator artery. The decrease in RI may indicate increased flap perfusion.
Key words: perforator artery, tissue expansion, experimental, rabbit, Doppler indices
Perforator artery response to tissue expansion:
An experimental study in rabbits
Omer Kokacya
1,A–F, Cengiz Eser
1,A–F, Erol Kesiktas
1,A–F, Eyuphan Gencel
1,A–F, Huseyin Tugsan Balli
2,A–F, Arbil Acikalin
3,A–F1 Department of Plastic Reconstructive and Aesthetic Surgery, Faculty of Medicine, Çukurova University, Adana, Turkey 2 Department of Radiology, Faculty of Medicine, Çukurova University, Adana, Turkey
3 Department of Pathology, Faculty of Medicine, Çukurova University, Adana, Turkey
A – research concept and design; B – collection and/or assembly of data; C – data analysis and interpretation; D – writing the article; E – critical revision of the article; F – final approval of the article
Introduction
Defect reconstruction is a major area of interest in plas-tic surgery. Tissues are expanded in this process in order to extend the surface area and to provide more reliable flaps. Although expanded free or pedicled perforator flaps have been successfully used, only a few studies have inves-tigated the effects of tissue expansion on the perforator artery.
Our search for an economical experimental animal model with well-defined perforator vessels and a reliable anatomy that enables the use of commercially available tissue expanders led us to the use of rabbits. The cranial re-gion of rabbit dorsal skin is supplied bilaterally by the first perforator branch of the thoracodorsal arteries (S1 perfo-rator).1 Guerra et al. emphasized that the fascia does not
contribute to the blood supply of the S1 perforator flap, which is a true perforator flap.2
Color Doppler ultrasound imaging, which has been used in the planning of perforator flaps,3–5 was recently
employed for the postoperative assessment of perforator flap perfusion.6 Vascular Doppler ultrasonography is used
to determine blood flow velocity, which in turn is needed to calculate parameters such as the resistivity index (RI) and the pulsatility index (PI). These indices are used to as-sess vascular resistance.
The aim of this study is to determine the response of the perforator artery to various volumes of expansion of a rabbit S1 perforator flap. The perforator artery response was evaluated using Doppler ultrasonographic measure-ments, histopathological examination and angiography.
Material and methods
The protocol for the use of rabbits in this study was approved by the local ethics committee. Twelve New Zealand White rabbits weighing 2,400–3,380 g were used. Each animal was housed in a single metal cage in a room with controlled temperature (25°C) and light (12 h day/12 h night). All animals were fed a commercial rabbit diet (23% protein) and drinking water ad libitum. Infection prophylaxis was ensured through the preopera-tive administration of 50 mg/kg of cephazoline sodium intramuscularly. Pain management was handled through the postoperative administration of 1 mg/kg of diclofenac sodium intramuscularly for 5 days.
The left S1 perforator flaps were used as the experimental group (n = 12), and the right S1 perforator flaps were used for the control group (n = 12). The experimental group was subdivided into 3 groups according to expansion volume: 150 mL (n = 4), 200 mL (n = 4) and 250 mL (n = 4). Anesthesia was provided as 40 mg/kg of ketamine and 10 mg/kg of xyla-zine, given intramuscularly. In the prone position, right and left S1 perforator arteries of each rabbit were examined with color Doppler ultrasonography using a Logiq P5 ultrasound
system and an 11L transducer (General Electric Company, Boston, USA). The quantitative data obtained with vascu-lar Doppler ultrasound include blood flow velocities (e.g., peak systolic flow velocity (PS), end diastolic flow velocity (ED) and mean flow velocity (TAMAX)). Semiquantitative Doppler data include those indices calculated on the basis of the blood flow velocities (e.g., RI and PI) using the fol-lowing equation:
RI = [PS − ED]/PS and PI = [PS − ED]/TAMAX The PS, ED, TAMAX, RI, PI, and vessel diameter (D) of the S1 perforator arteries were recorded.
Under general anesthesia, after preparing the skin with povidone iodine and closing with sterile cloths, we reached the subpannicular area through a 4-cm horizontal inci-sion at the level of the left superior iliac crest. By caudal to cranial dissection up to the left axillary area, we reached the point where the S1 perforator emerges from the la-tissimus dorsi muscle. We prepared a pouch (13 × 8 cm) with a cranial border leading to the S1 perforator artery, and then implanted a 150-milliliter elliptical smooth tissue expander (12 × 7 × 3.2 cm) with an external port (Mentor, Santa Barbara, USA) into the prepared pouch. The port was placed in a new subpannicular pouch that was prepared caudal to the incision. All of the expanders were inflated to 50 mL perioperatively. No surgical inter-vention was performed to the right side of the dorsum, with this side serving as a control. Serial expansions were made on postoperative days 7, 10, 13, 16, and 19 in incre-ments of 20 mL, 30 mL or 40 mL, leading to final volumes of 150 mL, 200 mL and 250 mL, respectively (4 rabbits each). On postoperative day 21, under general anesthesia, we repeated Doppler ultrasound examination of the S1 perforator in the experimental and control groups. After-wards, tissue expanders were extracted through the im-plantation incision. A monoblock flap consisting of the ex-perimental and control flaps was harvested on the right and left S1 perforator arteries.
The borders of the flap were as follows (Fig. 1A,B): cra-nial border – horizontal line passing through the superior angles of the scapulae; caudal border – horizontal line passing through the posterior superior iliac crests; right lateral border – right anterior axillary line; left lateral bor-der – left anterior axillary line.
(5 mL; Bayer Schering Pharma, Berlin, Germany) was giv-en slowly from the right and left catheters until radiopaque fluid was observed oozing from the distal end of the flap. Immediately after the Urografin injection, angiography was performed with X-ray (Optima XR200amx; General Electric Company) at a 68.5-centimeter source-to-image-receptor distance (50 kV, 2.00 mAs, 0°). After angiography, biopsies from the right and left S1 perforator arteries were taken from the point where they pierce the deep fascia. Specimens were Van Gieson-stained and examined under
a light microscope at ×200 magnification. The internal elastic membrane that separates the tunica intima from the tunica media and the external elastic membrane that separates the tunica media from the tunica adventitia were defined. The thickness of the tunica media and tunica adventitia layers in the experimental and control groups were compared by measuring the thicknesses in the pho-tographs taken at the same magnification (×200) using Adobe Photoshop CS6 v. 13.0 (Adobe Inc., San Jose, USA).
Statistical analysis
All analyses were performed using the SPSS Statistics for Windows v. 17.0 software package (SPSS Inc., Chicago, USA). Categorical measurements are presented as numbers and percentages. Continuous measurements were summa-rized and are presented as means ± standard deviation (SD). The Mann–Whitney U test was used if the data did not exhibit a normal distribution. The Wilcoxon test was used to compare initial and post-expansion measurements. A p-value <0.05 was considered statistically significant.
Results
No significant differences were observed in the initial Doppler measurements between the experimental and control groups (Table 1). Our comparison of the initial and post-expansion (3 weeks) measurements of the experimen-tal group revealed that D increased with expansion while RI and PS had decreased. Changes in ED, TAMAX and PI were not statistically significant. Comparing the initial and post-expansion measurements of the control group, we noted that D and RI had increased with expansion while ED decreased. The changes in PS, TAMAX and PI were not statistically significant (Table 2). The median D of the ex-perimental group increased by 31.3%, while that of the con-trol group increased by 11.8% (Table 2) (Fig. 2). With expan-sion, RI decreased in the experimental group but increased in the control group (Table 2) (Fig. 3). The changes in PI were not significant in either group (Table 2).
Subgroup comparisons revealed no significant differ-ences in post-expansion Doppler measurements between
Fig. 1. A – borders of the flap (left – experimental group, right – control group). B – a monoblock flap harvested on right and left S1 perforators. Arrows show right and left S1 perforators
Table 1. Initial Doppler measurements of experimental and control groups
Variables Experimental group Control group p-value
mean median (range) mean median (range)
PS [cm/s] 45.1 42.4 (26.4–81.0) 39.9 36.7 (29.2–67.2) 0.410
ED [cm/s] 11.1 11.7 (5.6–18.6) 8.8 8.0 (6.2–16.1) 0.060
TAMAX [cm/s] 17.4 17.4 (10.9–24.8) 15.2 15.0 (8.2–22.2) 0.319
PI 2.0 2.0 (1.4–3.0) 2.1 1.9 (1.5–3.0) 0.551
RI 0.8 0.8 (0.7–0.9) 0.8 0.8 (0.7–0.9) 0.319
D [mm] 1.7 1.6 (1.5–2.1) 1.7 1.7 (1.5–1.8) 0.347
the expansions of 150 mL, 200 mL and 250 mL (Table 3). We compared the experimental and control groups ac-cording to the angiography of the monoblock flap, which consisted of the right and left sides of the rabbit dorsal skin. Vascular arborization was more complex
in the experimental group (Fig. 4). Histopathological ex-amination of the S1 perforators in the experimental and control groups at the end of the expansion period revealed no marked changes in the thickness of the tunica media or tunica adventitia (data not shown) (Fig. 5).
Fig. 3. Initial and post-expansion resistivity index distribution in experimental and control groups
Fig. 2. Initial and post-expansion diameter distribution in experimental and control groups
Table 2. Comparison of initial and post-expansion (3 weeks) Doppler measurements of experimental and control groups
Variables
Experimental
initial post-expansionExperimental p-value Controlinitial post-expansionControl p-value median (range) median (range) median (range) median (range)
PS [cm/s] 42.4 (26.4–81.0) 35.7 (26.5–46.1) 0.015 36.7 (29.2–67.2) 33.3 (22.6–57.0) 0.272
ED [cm/s] 11.7 (5.6–18.6) 9.9 (6.9–19.8) 0.937 8.0 (6.2–16.1) 6.6 (3.6–10.0) 0.041
TAMAX [cm/s] 17.4 (10.9–24.8) 15.8 (12.6–24.0) 0.388 15.0 (8.2–22.2) 12.4 (8.8–23.8) 0.169
PI 2.0 (1.4–3.0) 1.5 (1.0–2.0) 0.055 1.9 (1.5–3.0) 2.0 (1.6–2.7) 0.875
RI 0.8 (0.7–0.9) 0.7 (0.6–0.8) 0.031 0.7 (0.7–0.9) 0.8 (0.7–0.9) 0.003
D [mm] 1.6 (1.5–2.1) 2.1 (1.9–2.4) 0.002 1.7 (1.5–1.8) 1.9 (1.5–2.2) 0.006
PS – peak systolic flow velocity; ED – end diastolic flow velocity; TAMAX – mean flow velocity; PI – pulsatility index; RI – resistivity index; D – vessel diameter.
Table 3. Post-expansion measurements of the experimental group subdivided according to volume of expansion
Variables
Expansion volume
p-value
150 mL 200 mL 250 mL
median (range) median (range) median (range) 150 vs 200 150 vs 250 200 vs 250
PS [cm/s] 37.2 (29.0–41.2) 32.9 (27–37.7) 37.5 (26.5–46.1) 0.486 1.000 0.886
ED [cm/s] 11.7 (10.2–17.5) 8.5 (6.9–9.3) 10.2 (7.1–19.8) 0.059 0.486 0.200
TAMAX [cm/s] 19.1 (12.6–20.9) 14.34 (12.8–16.3) 16.4 (13.0–24.0) 0.343 1.000 0.686
PI 1.6 (1.0–1.9) 1.6 (1.5–2.1) 1.4 (1.1–1.9) 0.486 0.886 0.200
RI 0.7 (0.56–0.7) 0.7 (0.7–0.8) 0.7 (0.6–0.8) 0.057 0.686 0.486
D [mm] 2.1 (2.0–2.2) 2.1 (1.9–2.4) 2.0 (1.9–2.4) 0.686 0.486 0.686
PS – peak systolic flow velocity; ED – end diastolic flow velocity; TAMAX – mean flow velocity; PI – pulsatility index; RI – resistivity index; D – vessel diameter.
experiment control
D initial [mm] D post-expansion [mm] 2.4
2.2
2.0
1.8
1.6
1.4
experiment control
RI initial RI post-expansion 0.9
0.8
0.7
0.6
Discussion
According to the consensus regarding perforator flap terminology: “A muscle or myocutaneous perforator is a blood vessel that traverses through muscle to pierce the outer layer of the deep fascia and to supply the over-lying skin. A skin flap that is vascularized by a muscle perforator is called a muscle perforator flap or muscu-locutaneous perforator flap.”7 Recently, perforator flaps
have become more popular in the field of surgical recon-struction. The advantages of perforator flaps over muscle or musculocutaneous flaps include decreased donor-site morbidity, less postoperative pain, faster rehabilitation, absence of postoperative muscle atrophy, and the possibil-ity of harvesting a sensate flap.8
Plastic surgery often involves the challenge of repairing a large defect with only a limited area of donor tissue. Meth-ods such as tissue expansion and surgical or chemical delay have been employed in flap surgery. Although expanded
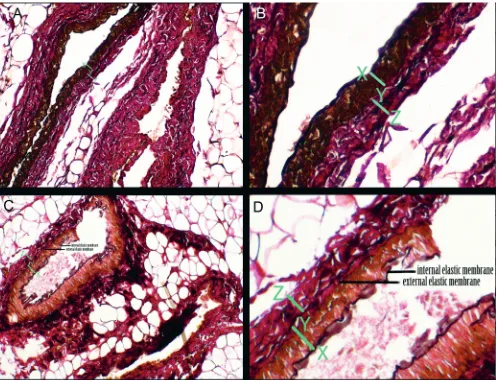
Fig. 5. A – histopathological view of an experimental S1 artery (Van Gieson’s stain; ×200 magnification). B – ×2.5 digital magnification of the vessel wall of the S1 artery shown in Fig. 5A. C – histopathological view of a control S1 artery (Van Gieson’s stain; ×200 magnification). D – ×2.5 digital magnification of the vessel wall of the S1 artery shown in Fig. 5C.
Internal and external elastic membranes are indicated in Fig. 5C,D. X-Y – thickness of tunica media; Y-Z – thickness of tunica adventitia. Fig. 4. Angiographic view of a monoblock flap. Note the more complex
free and pedicled perforator flaps have been used success-fully, only a few clinical reports have studied the effects of tissue expansion on the perforator artery. These studies evaluated the response of the perforator artery as evidenced only by changes in D.9,10 In this study, we evaluated changes
in other parameters in addition to D. To the best of our knowledge, this is the first study to evaluate the response of the perforator artery to tissue expansion using blood flow velocity, RI, PI, histopathology, and angiography.
Angel et al. described the first perforator branch of the thoracodorsal artery, naming it the S1 perforator in rabbits. They showed that it is possible to elevate a large skin flap based solely on the S1 perforator.1 Guerra et al.2
classified the S1 perforator as a type 1 or indirect muscle perforator. We chose the rabbit S1 perforator flap in our study because it is a suitable experimental model for study-ing perforator artery changes.
The measurement of blood flow velocity is operator-de-pendent, while RI and PI measurements are taken indepen-dently of the probe angle.6 High and low values of RI and PI
indicate high and low peripheral resistance. The calcula-tion accuracy of PI is inferior to that of RI because of tech-nical errors in calculating TAMAX. The RI is simply cal-culated from PS and ED with a relatively small margin of error. The reproducibility of RI is superior to that of PI.11
Effect of tissue expansion
on the perforator artery diameter
Shang et al.10 used pre-expanded, deep inferior
epi-gastric artery flaps for reconstructing burn contractures of the hand and wrist. They measured the perforator ar-tery diameter with computed tomographic angiography before and 3 months after implanting tissue expanders. They reported a 33% (±8%) increase in the mean diam-eter of the perforator vessels after expansion. Hocaoğlu et al.9 used suprafascially pre-expanded perforator flaps,
measuring the initial and post-expansion D with Dop-pler ultrasound. They reported a mean D increase from 0.48 (±0.08) mm to 0.65 (±0.1) mm, which means a 35% increase in D. We observed a 31.3% increase in the me-dian diameter of the perforator artery after tissue expan-sion in the experiment group. Our finding is comparable to those of the other 2 studies. Apart from these reports, we did not find anything in the literature on the effect of tissue expansion on perforator artery diameter.
Effect of tissue expansion on the RI and PI
of the perforator artery
Radmehr et al.12 reported that detecting a gradual
in-crease in RI and PI is an effective means of diagnosing renal allograft dysfunction in post-transplant patients in the ear-ly postoperative period. They believe that this gradual increase in RI and PI is caused by peripheral vascular re-sistance. Arya et al.6 reported that the PI of the perforator
artery gradually increases when there is venous occlusion in the free deep inferior epigastric artery perforator flaps. They stated that the increase in PI is secondary to a rise of peripheral vascular resistance caused by venous occlu-sion. While their study reports no RI data, we believe that if it had been studied, they would have found an increase in RI resulting from venous occlusion.
Our study is the first to investigate the effect of tissue expansion on the RI and PI of a perforator artery. The com-parison of the initial and post-expansion measurements of the experimental group revealed a decrease in RI with tissue expansion (Table 2). This decrease in RI indicates a decrease in the resistance of the capillary bed distal to the measurement location and an increase in tissue perfusion. The decrease in PI in the experimental group was not statistically significant in our study (Table 2). For a perforator flap model, we believe it is reasonable to use RI rather than PI to determine intra-flap resistance.
There was no statistical significance when post-ex-pansion Doppler measurements of the 3 experimental subgroups (150 mL (n = 4), 200 mL (n = 4) and 250 mL (n = 4)) were compared (Table 3). Our results show that over-expansion does not lead to a greater decrease in RI or a greater increase in D than conventional expansion. After the tissue is adequately expanded for reconstruc-tion, it does not seem reasonable to use over-expansion to increase flap perfusion and viability.
Histopathological findings
After elongating the saphenous artery and veins of rats using tissue expanders under the leg adductor muscles, Stark et al.13 reported that tissue expansion did not affect
the vessel wall thickness. Our comparison of biopsies from the experimental and control groups also revealed no change in vessel wall thickness. Moreover, we observed no changes in the thickness of the tunica media or the tu-nica adventitia (Fig. 5A–D).
Angiographic findings
Reports on angiography on a variety of expanded flaps can be found in the literature. Cherry et al.14 performed
an-giography on expanded random-pattern skin flaps in pigs. Kim et al.15 and Mutaf et al.16 performed angiography
on ex-panded gracilis muscles and exon ex-panded venous flaps in rats. In accordance with the angiographic findings of other types of expanded flaps, we observed that tissue expansion increas-es the complexity of vascular arborization in perforator flaps.
Interpretation of unpredicted Doppler
findings in the control group
and Palmer,17 “choke” anastomoses between arteries and
arterioles dilate when a skin flap is delayed, and blood flows across the choke vessels according to a pressure gradient. Tissue expansion is one type of delay. Subse-quent expansion of an angiosome will likely cause chang-es at the source of the artery of the adjacent angiosome. As Taylor and Minabe18 describe, the flaps used in our
study are composed of 2 angiosomes (the experimental and control segments) of rabbit dorsal skin that are linked via choke vessels at the vertebral line. In the experimental segment of the flap, the choke vessels dilated in response to expansion. We believe that the increased RI observed in the control segment of the flap is an adaptation that oc-curred to direct the blood flow from the control segment to the experimental segment through the choke vessels, thereby increasing perfusion of the expanded tissue.
Taylor and Palmer17 also stated that the intelligent use
of a delay will allow for the safe capture of adjacent vas-cular territory. The survival length of a skin flap depends on the diameter and length of the dominant vessel upon which the flap is based and on the diameter and span of the adjacent captured artery or arteries. In light of this information, we hypothesize that the increase in perfora-tor artery diameter of the control segments of the flaps contributed to the survival of the experimental seg-ments of the flaps. The unforeseen increases in D and RI in the control group may result from the systemic effects of vasoactive substances that were released within the ex-perimental segment secondary to expansion.16
Limitations
The placement of expanders in loose-skinned animals such as rabbits and rats may differ from their use in hu-mans, who have fixed skin. Thus, a comparison of results between such animals and humans may lead to incorrect conclusions.18
Conclusions
Suprafascial expansion of a perforator flap leads to in-creased diameter and deto in-creased RI of the perforator artery. The decrease in the RI may indicate increased flap perfu-sion. Further studies are needed to confirm our perforator artery findings in the expanded and unexpanded adjacent tissue.
ORCID iDs
Omer Kokacya https://orcid.org/0000-0002-1650-5957 Cengiz Eser https://orcid.org/0000-0002-1208-717X Eyuphan Gencel https://orcid.org/0000-0003-1929-3838
References
1. Angel MF, Khazanchi RK, O’Brien BM. The anatomy of the subscapu-lar artery and its effects on flap design in the rabbit. Ann Plast Surg. 1990;24(2):152–155.
2. Guerra AB, Gill PS, Trahan CG, et al. Comparison of bacterial inocula-tion and transcutaneous oxygen tension in the rabbit S1 perforator and latissimus dorsi musculocutaneous flaps. J Reconstr Microsurg. 2005;21(2):137–143.
3. Hallock GG. Doppler sonography and color duplex imaging for plan-ning a perforator flap. Clin Plast Surg. 2003;30(3):347–357.
4. Giunta R, Geisweid A, Feller A. The value of preoperative Doppler sonography for planning free perforator flaps. Plast Reconstr Surg. 2000;105(7):2381–2386.
5. Blondeel PN, Beyens G, Verhaeghe R, et al. Doppler flowmetry in the planning of perforator flaps. Br J Plast Surg. 1998;51(3):202–209. 6. Arya R, Griffiths L, Figus A, King D, Ramakrishnan V, Griffiths M.
Post-operative assessment of perfusion of Deep Inferior Epigastric Perfo-rator (DIEP) free flaps via Pulsatility Index (PI) using a portable colour Doppler sonogram device. J Plast Reconstr Aesthet Surg. 2013;66(7): 931–936.
7. Blondeel PN, Van Landuyt K, Hamdi M, Monstrey SJ. Perforator flap terminology: Update 2002. Clin Plast Surg. 2003;30(3):343–346. 8. Blondeel PN, Van Landuyt KH, Monstrey SJ, et al. The “Gent”
con-sensus on perforator flap terminology: Preliminary definitions. Plast Reconstr Surg. 2003;112(5):1378–1383.
9. Hocaoğlu E, Emeklı U, Çızmecı O, Uçar A. Suprafascial pre-expan-sion of perforator flaps and the effect of pre-expanpre-expan-sion on perfora-tor artery diameter. Microsurgery. 2014;34(3):188–196.
10. Shang Z, Zhao Y, Ding H, Liu B, Cao D, Wang B. Repair of hand scars by a dilated deep inferior epigastric artery perforator flap. J Plast Surg Hand Surg. 2011;45(2):102–108.
11. Ogino A, Onishi K. Vascular waveform analysis of flap-feeding ves-sels using color Doppler ultrasonography. Plast Surg Int. 2014;2014: 249670.
12. Radmehr A, Jandaghi AB, Hashemi TA, Shakiba M. Serial resistive index and pulsatility index for diagnosing renal complications in the early posttransplant phase: Improving diagnostic efficacy by con-sidering maximum values. Exp Clin Transplant. 2008;6(2):161–167. 13. Stark GB, Hong C, Futrell JW. Rapid elongation of arteries and veins
in rats with a tissue expander. Plast Reconstr Surg. 1987;80(4):570–578. 14. Cherry GW, Austad E, Pasyk K, McClatchey K, Rohrich RJ. Increased survival and vascularity of random-pattern skin flaps elevated in con-trolled, expanded skin. Plast Reconstr Surg. 1983;72(5):680–687. 15. Kim KH, Hong C, Futrell JW. Histomorphologic changes
in expand-ed skeletal muscle in rats. Plast Reconstr Surg. 1993;92(4):710–716. 16. Mutaf M, Tasaki Y, Fujii T. Expansion of venous flaps:
An experimen-tal study in rats. Br J Plast Surg. 1998;51(5):393–401.
17. Taylor GI, Palmer J. The vascular territories (angiosomes) of the body: Experimental study and clinical applications. Br J Plast Surg. 1987; 40(2):113–141.