Visual communication: a methodology for measuring
management intention and shopfloor acknowledged
meaning
SADDIQ, Sajid
Available from Sheffield Hallam University Research Archive (SHURA) at:
http://shura.shu.ac.uk/16809/
This document is the author deposited version. You are advised to consult the publisher's version if you wish to cite from it.
Published version
SADDIQ, Sajid (2017). Visual communication: a methodology for measuring management intention and shopfloor acknowledged meaning. Doctoral, Sheffield Hallam University.
Copyright and re-use policy
See http://shura.shu.ac.uk/information.html
Sheffield Hallam University Research Archive
i
Visual Communication: A Methodology for Measuring Management Intention
and Shopfloor Acknowledged Meaning.
Sajid Saddiq.
A thesis submitted in partial fulfilment of the requirements of
Sheffield Hallam University
For the Degree of Doctor of Business Administration.
ii
Abstract
The aim of this research study was to explore the management intended and subsequent acknowledged meaning of visual communication found in
organisations, specifically those used in shop-floor contexts. In doing so the intention was to generate new insights into the concept and use of visual communication.
In organisations, visual communication is said, for example, to contribute to and sustain continuous improvement (Jaca et al. 2015), but how can this be known unless it can be measured in some way? To date, due to the fragmented understanding and lack of holistic approaches to investigating visual
communication, this remains a subject that is empirically under-theorised and detached from real world professionals and contexts.
To access the intended and perceived meaning, the Shannon & Weaver (1949) Communication model has provided the necessary conceptual framework. Although originally created to depict telegraphic communication, it is said to be representative of all forms of communication and was used successfully to theoretically underpin this research. This structure, through a neo-positivist case study design, has enabled the exploration of visual communication in a manufacturing environment. Using a number of qualitative and quantitative data collection methods, based on the Repertory Grid Analysis design (George Kelly), enabled the themes that are motivating visual communication to be operationalised. These methods have put at centre stage the motivation of those involved in the acts of visual communication by empowering their voices. This has been done whilst retaining a strong focus throughout on practice based issues to ensure the utility in future for researchers and managers to make sense of the usefulness of real world visual communication.
This research has demonstrated how individual managers are bound by the overall imperatives for mass production environments, using visual
communication to affect control of issues such as capacity, inventory and customer demand. However, what has also been demonstrated is their further orientation towards specific requirements based on the contingency of their sub-environments, i.e. safety, profitability, supply chain issues, etc.
The findings of this thesis, in relation to enabling the measurement of visual communication meaning within its situated context, contributes to both
iii
Contents
1 Introduction ... 1
1.1 Research Aim and Objectives ... 1
1.2 Research Rationale ... 2
1.3 Background of Case Study Company ... 5
1.4 Contribution ... 5
1.5 Structure of the Thesis ... 7
2 Literature Review ... 9
2.1 Scope... 10
2.2 Visual Communication Definition ... 12
2.3 Communication Models ... 14
2.4 Visual Communication Frameworks – Taxonomy ... 23
2.5 Theoretical Perspective of Organisations ... 36
2.6 Organisational Characterisation ... 40
2.7 Visual Communication as a Form of Control ... 44
2.8 Performance Management Systems ... 47
2.9 Conclusion ... 52
3 Research Methodology & Design ... 56
3.1 Research Methodology – Neo Empiricist ... 56
3.2 Reflection ... 59
3.2.1 Access ... 61
3.2.2 Pre-understanding ... 62
3.2.3 Role Duality: Organisational and Researcher Roles ... 63
3.2.4 Managing Organisational Politics ... 64
3.2.5 Conclusion ... 65
3.3 Conceptual Model ... 65
iv
3.4.1 Repertory Grid Analysis - Design ... 67
3.4.2 Research Design - Case Study ... 72
3.5 Research Methods ... 74
3.5.1 Focus Groups ... 75
3.5.2 Data Collection Method One - Participant-Led-Photography ... 78
3.5.3 Data Collection Method Two – Photo-Elicitation ... 81
3.5.4 Data Collection Method Three – ECRS ... 84
3.5.5 Survey Methods ... 88
3.6 Research Data Collection ... 90
3.6.1 Elements ... 90
3.6.2 Constructs ... 92
3.7 Learning from Pilot Study ... 105
3.8 Summary ... 107
4 Findings ... 108
4.1 The Psychological Constructs of Managers ... 109
4.1.1 Manager Nos. One – Heavy Duty Railway Applications ... 110
4.1.2 Manager Nos. Two – Light Vehicle / High Volume ... 115
4.1.3 Manager Nos. Three - Light Vehicle/Medium Volume ... 119
4.1.4 Manager Nos. Four - Light Vehicle / Low Volume ... 123
4.1.5 Manager Nos. Five - Light Vehicle / High Variety ... 127
4.1.6 Manager Nos. Six – Materials Mixing Department ... 132
4.1.7 Results of Photo-Elicitation ... 136
4.2 Questionnaire – Design, Administration & Analysis ... 138
4.2.1 Creating, Administering and Analysis of the Questionnaire ... 139
4.2.2 Photograph Nos. Two – Shift Communication Board ... 146
4.2.3 Photograph Nos. Four – Production Planning Board... 152
4.2.4 Photograph Nos. One – Machine Isolation Procedure ... 154
v
4.2.6 Photograph Nos. Six – Quality Standards Board ... 159
4.2.7 Photograph Nos. Ten – Operator Work Station ... 162
4.2.8 Photograph Nos. Five – Works Order Storage Rack ... 164
4.2.9 Photograph Nos. Seven – Shadow Board ... 168
4.2.10 Photograph Nos. Three – Order Planning Board ... 171
4.2.11 Photograph Nos. Nine – Tooling Shadow Board ... 174
4.2.12 Summary of Questionnaire Analysis ... 177
4.3 Visual Communication & Hierarchy ... 179
4.4 Conclusion ... 183
5 Discussion ... 186
5.1 Organisational Imperatives. ... 187
5.2 Visual Communication - Control ... 195
5.3 Repertory Grid Analysis ... 203
5.3.1 Single Case Study – Embedded Design ... 203
5.3.2 Repertory Grid Analysis Design ... 204
5.4 Conclusion ... 208
6 Conclusion ... 210
6.1 Importance of this Research ... 210
6.2 Research Aim ... 212
6.3 Contribution to Practice... 214
6.3.1 Dissemination Strategy ... 216
6.4 Strengths & Limitations ... 217
6.5 Opportunities for Further Research ... 220
7 References ... 225
8 Appendix ... 240
8.1 Appendix A – Photograph Sequencing ... 240
8.2 Appendix B – Prepared Questions for Photo-Elicitation Interview ... 241
vi
8.4 Appendix D – Pilot Study – Photo-elicitation Interview Results ... 243
8.5 Appendix E- Consolidated Themes (from Supervisors Constructs). .. 254
8.6 Appendix F – Pilot Study - 6 Photographs used with Questionnaire .. 257
8.7 Appendix G – Pilot Study – Questionnaire Responses ... 258
8.8 Appendix H – Photographs Used for Photo-Elicitation ... 262
8.9 Appendix I – Photo-Elicitation Results from Six Managers ... 266
8.10 Appendix J – Results from ECRS Activity with the Managers ... 297
8.11 Appendix K – Consolidated Themes & Pole Questions ... 302
8.12 Appendix L – Questionnaire Design (Format)... 306
8.13 Appendix M – Ten Photographs Rated using the Questionnaire .... 308
8.14 Appendix N – Summary of Results and Fisher Exact Test ... 315
8.15 Appendix O – Visual Workplace ... 326
8.16 Appendix P – Dissemination – Research Participants ... 327
8.17 Appendix Q – Dissemination – Lean Practitioners ... 336
8.18 Appendix R – Dissemination – Newsletter ... 348
8.19 Appendix S – Dissemination – Executive Summary ... 352
vii
Tables & Figures
Figure 2-1 – Peircean Semiosis Model ... 15
Figure 2-2 – Shannon & Weaver (1949) – Communication System Model ... 18
Figure 2-3 – Shannon & Weaver Model Depicting Visual Communication ... 23
Figure 2-4 - A Visual Workplace ... 24
Figure 2-5 - Comparison of Galsworth (2004) v Greif (1991) Frameworks ... 26
Figure 2-6 Comparison of Greif (1991) v Mestre et al. (2000) Frameworks ... 27
Figure 2-7 - Synthesis of Visual Management Frameworks ... 29
Figure 2-8 - Synthesis of Literature and Jaca et al. 2014 ... 34
Figure 2-9 - Abstract Model of Cybernetic System... 38
Figure 2-10 - Abstract (Truncated) Model of Cybernetic System ... 39
Figure 2-11 – Functional Layout / Process Layout ... 42
Figure 2-12 – Factors Impacting the Viability of Different Forms of Control ... 45
Figure 2-13 - Modified (Truncated) Model of Cybernetic System ... 48
Figure 2-14 - X Matrix – Checking Consistency of Objectives. ... 50
Figure 3-1 – Modified Shannon & Weaver Model – Conceptual Structure ... 67
Figure 3-2 – Elements of Repertory Grid Analysis ... 70
Figure 3-3 - Alignment of Repertory Grid Analysis and Conceptual Model ... 70
Figure 3-4 – Alignment of Repertory Grid Analysis and Conceptual Model ... 71
Figure 3-5 - Alignment of Repertory Grid Analysis and Conceptual Model ... 72
Figure 3-6 – Product Family Layout at Automotive UK ... 73
viii
Figure 3-8 – Research Methods – Repertory Grid Design ... 75
Figure 3-9 – Four Point Approach to Sampling ... 76
Figure 3-10 – Sample Strategy for Repertory Grid Analysis – Elements & Constructs ... 77
Figure 3-11 - Research Methods – Repertory Grid Design ... 78
Figure 3-12 – Guidance for Participant-Led-Photography ... 79
Figure 3-13 – A4 Printed Format of Participants Photographs ... 80
Figure 3-14 – Research Methods – Repertory Grid Analysis Design ... 81
Figure 3-15 – Triadic Permutations of Photographs ... 82
Figure 3-16 - Triadic Sets of Elements for Photo-Elicitation ... 83
Figure 3-17 - Research Methods – Repertory Grid Design ... 84
Figure 3-18 - Research Methods – Repertory Grid Design ... 88
Figure 3-19 – Sample Strategy - Survey ... 89
Figure 3-20 – Participant-Led-Photography – Examples of Photographs ... 91
Figure 3-21 – Example of Elicited & Emergent Pole Comments ... 93
Figure 3-22 – Manager Number One - Constructs ... 95
Figure 3-23- Manager Number One - Constructs and ECRS Activity ... 98
Figure 3-24 – Emergent Themes to Questionnaire Poles ... 100
Figure 3-25 – Conversion of Themes to Questionnaire Poles ... 101
Figure 3-26 – Examples of Questions Format ... 102
Figure 4-1 – Research Methods – Repertory Grid Design ... 109
ix
Figure 4-3 - Manager Nos. One - Constructs & Themes Summary ... 112
Figure 4-4 - Manager Nos. One – Unused Photographs ... 114
Figure 4-5 - Manager Nos. Two – Photographs used for Photo-Elicitation ... 116
Figure 4-6 – Manager Nos. Two - Constructs & Themes Summary ... 117
Figure 4-7 – Manager Nos. Two – Unused Photographs ... 118
Figure 4-8 - Manager Nos. Three – Photographs used for Photo-Elicitation ... 120
Figure 4-9 – Manager Nos. Three - Constructs & Themes Summary ... 121
Figure 4-10 – Manager Nos. Three – Unused Photographs ... 122
Figure 4-11 - Manager Nos. Four – Photographs used for Photo-Elicitation ... 124
Figure 4-12 – Manager Nos. Four - Constructs & Themes Summary ... 125
Figure 4-13 – Manager Nos. Four – Unused Photographs ... 126
Figure 4-14 - Manager Nos. Five – Photographs used for Photo-Elicitation ... 128
Figure 4-15 – Manager Nos. Five - Constructs & Themes Summary ... 129
Figure 4-16 – Manager Nos. Five – Unused Photographs ... 130
Figure 4-17 - Manager Nos. Six – Photographs used for Photo-Elicitation ... 133
Figure 4-18 – Manager Nos. Six - Constructs & Themes Summary ... 134
Figure 4-19 – Manager Nos. Six – Unused Photographs ... 135
Figure 4-20 - Research Methods – Repertory Grid Design ... 138
Figure 4-21 – Theme to Questionnaire Translation ... 140
Figure 4-22 - Questionnaire Design (Format) ... 141
Figure 4-23 - Photographs for Questionnaire Rating ... 142
x
Figure 4-25 – Symmetrical Contingency Table of Questionnaire Data ... 144
Figure 4-26 – Exact Response Matches ... 145
Figure 4-27 – Communication Board (1st Highest – Average of 26% Rating) 147 Figure 4-28 – Communication Board (1st Highest – Average of 26% Rating) 148 Figure 4-29 – Contingency Table Photograph Nos. Two - ‘Communication’ ... 149
Figure 4-30 - Contingency Table Photograph Nos. Two - ‘Production Output’ 149 Figure 4-31 – Contingency Table Photograph Nos. Two –‘Workstation Quality’ ... 150
Figure 4-32 – Contingency Table Photograph Nos. Two –‘Health & Safety’ .. 150
Figure 4-33 – Shift Communication Board ... 151
Figure 4-34 – Production Planning Board (2nd Highest – Average of 17% Rating) ... 152
Figure 4-35 - Production Planning Board (2nd Highest – Average of 17% Rating) ... 153
Figure 4-36 - Contingency Table Photograph Nos. Four - ‘Manufacturing Order Sequence’ ... 153
Figure 4-37 – Machine Isolation Procedure (3rd Highest – Average of 15% Rating) ... 155
Figure 4-38 - Machine Isolation Procedure (3rd Highest – Average of 15% Rating) ... 156
Figure 4-39 – Operator Checklist (4th Highest – Average of 14% Rating) ... 157
Figure 4-40 - Operator Checklist (4th Highest – Average of 14% Rating) ... 158
Figure 4-41 - Contingency Table Photograph Nos. Eight ‘Dusty and Dirty’ ... 158
xi
Figure 4-43 - Quality Standards Board (5th Highest – Average of 11% Rating)
... 160
Figure 4-44 - Contingency Table Photograph Nos. Six – ‘Quality’ ... 161
Figure 4-45 - Contingency Table Photograph Nos. Six – ‘Communication’ .... 161
Figure 4-46 – Operator Work Station (6th Highest – Average of 9% Rating) .. 162
Figure 4-47 - Operator Work Station (6th Highest – Average of 9% Rating) ... 163
Figure 4-48 – Works Order Storage Rack (Joint 6th Highest – Average of 9% Rating) ... 165
Figure 4-49- Works Order Storage Rack (Joint 6th Highest – Average of 9% Rating) ... 166
Figure 4-50 – Contingency Tables Photograph Nos. Five – Non-Value Stream Scores ... 168
Figure 4-51 – Shadow Board (8th Highest – Average of 8.3% Rating) ... 169
Figure 4-52 - Shadow Board (8th Highest – Average of 8% Rating) ... 170
Figure 4-53 - Contingency Table Photograph Nos. Seven - ‘5s’ ... 171
Figure 4-54 – Order Planning Board (9th Highest – Average of 7.5% Rating) 172 Figure 4-55 - Order Planning Board (9th Highest – Average of 7.5% Rating) . 173 Figure 4-56 – Tooling Shadow Board (10th Highest – Average of 7% Rating)175 Figure 4-57 - Tooling Shadow Board (10th Highest - 7% Rating) ... 176
Figure 4-58 - Contingency Table Photograph Nos. Nine – ALL Themes ... 176
Figure 4-59 – Comparison of Themes - Supervisor & Managers ... 180
Figure 4-60 – (Supervisor) Photograph Nos. Six - Operator Mess Room. ... 182
xii
Figure 5-2- Modified Model of Cybernetic System ... 188
Figure 5-3 – Value Stream & Levels of Automation ... 192
Figure 5-4 – Key Themes Motivating Visual Communication at Automotive UK ... 196
Figure 6-1 – Organisational Structure at Automotive UK ... 221
Figure 8-1 Manager to Operator Communication ... 356
Figure 8-2 Alignment of Repertory Grid Analysis and Conceptual Model ... 358
Figure 8-3 Communication Board (1st Highest – Average of 26% Rating) ... 364
Figure 8-4 Tooling Shadow Board (10th Highest – Average of 7% Rating) .... 366
xiii
Candidate's Statement
Declaration: I confirm that this is my own work and the use of all material from
other sources has been properly and fully acknowledged. I would to
acknowledge the support from Alastair Bissett (Development Methods Manager
at Automotive UK), who provided invaluable help with the Fisher Exact Match
test, p-value calculations and generally with guidance about how to structure
the data analysis.
The aim and objectives of this research were:
Aim:
• To measure the level of correlation between the intended and interpreted meaning of visual communication.
The objectives to achieve the above aim were:
• To extract (elicit) psychological constructs from managers who author the visual communication utilised on the shop-floor.
• To use these psychological constructs to create a measurement instrument to enable an exploration of the intended and interpreted
meaning of visual communication.
• To conduct this research using methods which were consistent with a neo-positivist approach.
1
1 Introduction
1.1 Research Aim and Objectives
The aim of this research was to correlate the intended and interpreted meaning
of visual communication. The objectives were to do this within the
organisational setting, directly from those involved in the communication acts
themselves.
Visual communication is used in manufacturing organisations to support a
variety of needs. At the level of the manufacturing process it can be designed
to highlight problems in visual forms to enable those operating it to be aware
and take necessary actions (Wojakowski 2015, Galsworth 2004). At another
level the visual communication supports managers in their need to inform and
manage the activity of those operating the shop-floor (Jaca et al. 2014). The
stage for this research is this second level, this hierarchical communication
between those individuals (operators) that are operating the manufacturing
equipment which is producing the products that the organisation is selling and
those (managers) that are directly responsible for these operators.
What takes place here at the ‘technical core’ of the organisation (Thompson 2004) is a communication between two groups. On one side there are
managers who author visual messages. On the other side there are operators,
who are the intended audience. Within this shop-floor context this research has
specifically explored the correlation of visual communication meaning, i.e.
comparing the message as it was intended by managers, and the subsequent
interpretation of this message by the operators.
Having set the scene for this research this chapter now introduces the aims,
objectives, and research rationale from an academic, methodological and
practice based perspective followed by a short introduction to the case study
company. The final part of this chapter states the intended contribution of this
2 The aim and objectives of this research were:
Aim:
• To measure the level of correlation between the intended and interpreted meaning of visual communication.
The objectives to achieve the above aim were:
• To extract (elicit) psychological constructs from managers who author the visual communication utilised on the shop-floor.
• To use these psychological constructs to create a measurement instrument to enable an exploration of the intended and interpreted
meaning of visual communication.
• To conduct this research using methods which were consistent with a neo-positivist approach.
It is important to mention here that the scope of this research was purposely
limited to intended and interpreted meaning of visual communication. The
rationale for this is further discussed in the next chapter.
1.2 Research Rationale
This research was warranted because visual communication is used in
organisations and has been said to be important (Bititci et al. 2016, Jaca et al.
2014). However currently there does not seem to be a scientific way of
comparing and contrasting the intended and interpreted meaning. This thesis
helps to close this gap in understanding in respect of visual communication.
In organisations visual communication contributes to and sustains continuous
improvement (CI) practices (Kattman et al. 2012, Galsworth 2004, Mestre &
Strom 1998). For example, simple binary colour coding can be used to convey
the status of machines, manufacturing lines, departments or indeed whole
organisations at a glance (Parry & Turner 2006). In doing so it can make visual
what otherwise would need to be verbally communicated. However knowing
what works from a practical perspective is not the same as knowing how or why
it works from a scientific perspective. This deeper understanding can only
3
reviewed literature in an attempt to gain a deeper understanding, it was clear
that this is an area that is still relatively under explored (Bartmanski 2014, Jaca
et al. 2014).
For mass production organisations there are some key shop-floor imperatives
that help to satisfy the need for a stable, efficient and predictable work
environment (Thompson 2004). Visual communication is seen as an important
component (Fullerton et al. 2014, Liker 2003) in the overall mix for achieving
this stability as it can provide immediate, simple and clear information to those
that need it. This in turn can enable people to take timely action (Wojakowski
2015). However, despite the shop-floor having a high density of visual
communication (Jaca et al. 2014), how can we know it is actually useful? Do
we know which forms of visual communication are better at the job of
communicating than others? Which ones could be removed without
consequence, perhaps even serving to improve the clarity of what remains? If
the assertion is correct, that stability is critical for profitable mass production
(Thompson 2004) then it is important to gain more knowledge about those acts
of communication that contribute to this.
Visual communication as a technology has become increasingly available in
organisations (Bell et al. 2014). This is partly due to advances in information
technology, greater familiarity of its use, reduced cost and increased availability
(Bell et al. 2014). It is used in organisations to serve a variety of needs.
Examples relevant to this research are;
"...strategy development and implementation... performance
measurement and review…people engagement...internal and external
communication... enhance collaboration and integration... development
of a continuous improvement culture..."
(Bititci et al. 2016, p1)
Part of the reason for its widespread use is that it has the potential to be a very
powerful form of communication. Arguably "at the first look you see the most
important points…" (Mutanen 2016, p25 referring to Neurath). However, a
systematic understanding of how it can be used and particularly how it is being
4
interest in, and concern with, the use of visual communication in a
manufacturing shop-floor environment that led me to my central question “can the intended and perceived meaning of visual communication be effective?"
Trying to access the understanding between managers and operators of any
given visual communication is to ask what was intended and subsequently
understood as having been communicated through that communication. By
providing the means of establishing the correlation between the intended and
interpreted meaning of visual communication can in turn provide ways of
improving its usage by those managers who are tasked to author such
communication.
To access this 'comprehension' I have utilised the communication systems
model devised by Shannon & Weaver (1949). This model was originally based
on the transmittal of information through communication channels such as
telegraphy. According to the original interpretation of this model, issues of
communication are considered as engineering problems, independent of the
semantic aspects of that communication. However, its authors argued that their
model was applicable to all human communication and it has been used to
theoretically underpin this research.
My interest in visual communication stems from having worked in manufacturing
organisations for many years and encountering numerous examples of it in use.
I have considered the benefits of using it alongside and instead of other forms
of communication and have often thought of the possibility to measure its
communicative power. My concern was that if visual communication is used in
organisations, without considering the correlation between communicator and
those being communicated to, then the effectiveness of that visual
communication is questionable. If organisations only copy and paste what has
worked in the past, this does not guarantee that it will work in the future (Hamel
5
1.3 Background of Case Study Company
The research was conducted within a UK based organisation, established more
than 100 years ago. In this research I have referred to it as Automotive UK. At
the time of conducting the research it had +400 employees with a turnover of
c.£60m (2015). It manufactured a narrow range of products for cars, trucks,
and railway applications. The product portfolio consisted of more than 500 part
numbers that had been divided into a number of different dedicated production
areas across the site, also referred to as ‘value streams’ (Liker 2003).
I had available a choice of sites in various regions of the world including several
based in the UK. The selection of a native English speaking site was driven by
the research design and methods which I will discuss in the research methods
chapter. The reason for selecting this particular site within the UK was that it
was relatively developed along its Lean journey. My curiosity in relation to
visual communication stemmed from my involvement in the Lean development
of sites and I was particularly interested to understand how this was being used
in such a mature environment.
1.4 Contribution
The Shannon & Weaver (1949) model is depicted as a symmetrical process
model. It depicts communication as requiring an exchange between two
cognitive systems, and the intended and interpreted meanings cannot be
accessed by concentrating on just one end of these cognitive processes (Lenski
2010). Based on this conceptualisation this research has operationalised the
Shannon & Weaver (1949) model in a novel way to access the intended and
interpreted meanings within the situated socio-cultural context (Seppanen &
Valiverronen 2003) of an organisational setting. The use of this model to
underpin this research has ensured that the cognitive to cognitive system
symmetry mandated by the definition of communication is respected. I have
explored this conceptual model in the literature review and discussed in detail
how it informs the research design in the methods chapter.
This research has looked beyond the simple codification of 'best-practices' in
respect of visual communication. Instead it has explored the intended meaning
6
demonstrated a design and methodology which closes a gap in our
management and organisational practices and makes available a means of
accessing this correlation. This research is important because enabling the
measurement of this correlation, between intended and received
communication meaning, is a first step to focusing a scientific light on this
interaction. In effect it starts to treat visual communication as an organisational
technology, and in doing so it provides a means of fine tuning visual
communication for specific contexts. The identification of problems and the
proposing of improvements related to visual communication require the capacity
to be able to measure it.
Socio-technical system theory is an approach that looks at the design of
organisations (Cummings 1978). In the context of this research it considers the
manufacturing technology and the human relations as interrelated dependant
variables whereas previously technology alone would largely determine the
social conditions (Ropohl 1999). From an academic perspective it focuses on
developing a deeper understanding of the relationship between "...people,
technology, and environment…" (Cummings 1978, p625). From a management
perspective the aim of socio-technical systems is to foster improved productivity
and human enrichment by attending to the respective needs of the task as well
as the social needs of individuals and groups (Miller & Rice 1967). The
emergence of socio-technical theory was in fact initiated by these managerial
needs; to identify the "...diffusion of innovative work practices and organizational
arrangements which did not require major capital expenditure but which gave
promise of raising productivity" (Trist 1981, p7).
A number of different socio-technical models exist. Subjects as diverse as
Information systems (Lyytinen & Newman 2008, Newman & Robey 1992) to
environmental problems (Geels 2010) have been studied. Depending on the
topic, the appropriate unit of analysis can be the primary work system, the
whole organisation, or the macro social perspective (Trist 1978), whereas in
other studies it has been the national, sectoral, or regional levels (Geels 2004).
In these different studies the independent factors used to characterise the
technical or social aspects varies. Lyytinen & Newman (2008) propose a model
7
are said by them to be interrelated, resulting in any given socio-technical state.
This simple and elegant socio-technical view serves to highlight the importance
of this research. This is because visual communication is used as an interface
between people, their tasks, and the technology, all of which takes place in a
particular organisational structure.
Despite my focus on visual communication in the context of shop-floor
production environments, the use of visual communication technologies is
encouraged through continuous improvement (Murata & Katayama 2010) and
Lean thinking (Galsworth 2004) right across the organisation (Murata &
Katayama 2010). This research has identified methods that are applicable to
the measurement of visual communication across the broader organisational
areas and perhaps different organisational types (Thompson 2004).
Visual communication is still an emerging field of research and as a result there
are diverse schools of thought about how to conduct research within it (Pauwels
2006, Smith et al. 2004). The majority tend to privilege the researcher with
interpreting signs for meaning or identifying suitable taxonomies for their
classification (Jappy 2013). To remain true to my neo-positivist orientation, my
methodology was designed to measure visual communication through the
involvement of those that are creating and interpreting it. These methods were
designed for the exploration of visual communication within its situated context,
which can be used in the future as an accessing technology by practicing
managers.
1.5 Structure of the Thesis
Following this introduction, chapter two is a critical review of the current
literature related to issues of visual communication. Here I have explored
literature particularly related to mass production environments and the
imperatives driving the need for visual communication in such situations. I have
explored applicable taxonomical frameworks and their specific focus. I have
also added a justification for the scope of this research. Finally, I have looked
at the features of communication models and identified one which is suited to
8
In the research design chapter (chapter three) I have explained how a case
study approach using a Repertory Grid Analysis design (George Kelly) has
been used for accessing the intended and interpreted meanings in relation to
examples of visual communication images. The particular images used in this
research were selected by those using them, from examples they encountered
and selected on a manufacturing shop-floor. This methodology has enabled the
meaning given by individuals to visual communication to be measured, and in
turn has enabled a correlation to be made between the understanding of those
images by those authoring them and those subsequently interpreting them.
In the same chapter I have provided extensive details about the use of the
research methods to gather the data. The methodology has involved several
dependant steps which were linked together and I have explained clearly the
need for this chain of data gathering to enable the correlation to be made.
Having completed the data gathering phase, in the findings chapter (chapter
four) I have presented the results of my investigation and shown how the
methods applied were used to evaluate the correlation. I have used this to
reveal interesting findings about the use of visual communication at Automotive
UK.
In chapter five I have discussed and reflected about how the findings inform and
contribute to the current debates about the use of visual communication in
organisations. This is particularly in relation to shop-floor imperatives and how
visual communication is used in the context of control. I have also considered
the research design and methods and how these inform the use of this
approach for future research.
In the final chapter (chapter six) I have conclude with a summary of what has
been achieved through this research and how it can contribute to the wider
issues relating to visual communication. I have also highlighted the areas that
this research has contributed to in relation to organisational and management
9
2 Literature Review
I have divided this literature review into eight sections. In the first section I have
clarified the scope of this research, explaining why the autonomous work group
is an important unit of study, as well as an explanation about why I have
considered issues such as operator resistance to communication messages as
being out of scope.
In the second section I have provided a working definition for visual
communication, highlighting how it is premised on several foundational
elements. This definition is relevant to this research because it both defines
what it is that is being researched and also in establishing the relevance of the
conceptual model used in the research design.
In the third section I have looked at the generic types of communication models
to understand their usefulness to my research aims. I have then focused on
communication models based on a ‘process’ perspective, specifically the
Shannon & Weaver (1949) model that has been used to conceptually inform the
research design.
The fourth section is a focus on exploring visual communication taxonomy
models. In particular I have looked at those that are relevant to a shop-floor
environment. I have done this to see what common features exist between the
various models and what they focus on. This aids an understanding of what is
motivating the need for the use of visual communication and as will be shown
later, it supports the methods used in this research.
In the fifth section of this chapter I have explored the theoretical perspective of
organisations that has been used in this study, specifically considering the
organisation as a cybernetic system (McAuley et al. 2014). This sets the
context for the broad and important role that visual communication plays in
relation to the shop-floor and the organisation as a whole.
In the sixth section I have identified factors that define organisational
contingencies in the use of visual communication, and how the characterisation
of mass production environments helps to identify the usage of visual
10
The seventh section is an exploration about how control is affected in
organisations and how visual communication contributes to issues of control on
the shop-floor.
The eighth section is a review of the links between visual communication and
performance management systems, particularly at the shop-floor level. This
section makes the connection between visual communication, strategy
deployment (Lee & Dale 1998) and feedback (cybernetic) processes.
The final section is a summary and conclusion of what has been learnt from the
review of literature.
Note that in section five I have also developed the theme of socio-technical
systems and why it is important to temper a strictly task focused view that
emerges from the cybernetic systems. It is important to note that the
socio-technical perspective is encapsulated more broadly by the literature review as a
whole. As mentioned earlier the model proposed by Lyytinen & Newman (2008)
characterises four key socio-technical elements; structure, technology, task,
and actors, and are said by them to be interrelated. These four elements
permeate throughout the literature review. For example section five and six
explore the structure of the organisation and the role of actors within it.
However in identifying that the manufacturing equipment is structured according
to a ‘single piece process layout’, this also highlights contingent impacts on technology and tasks. Similarly section eight identifies the importance of
communication systems in the context of organisational structure, and this
cannot be considered in the absence of the organisational actors, or the object
of communication which are related to the tasks and technology.
2.1 Scope
This research looks at the technical core (Thompson 2004) of the organisation,
to understand the consistency between the management intended and operator
acknowledged meaning of visual communication. It takes visual communication
used by managers and the meaning given to these, and compares it to the
meaning given to the same visual communication by operators, i.e. comparing
the message as it was intended by managers and the subsequent interpretation
11
My research was not aimed to access what was done once any given visual
communication message had been received. For example I did not explore
issues such as resistance by the operators to the attempts by managers to
exercise control (Watson 2006). Also I did not look at issues of reflexivity on the
part of the participants, either managers or operators (Bagnoli 2009). For
several interrelated reasons which I have discussed below the scope was
purposely limited to measuring interpretation by the operators but not the
subsequent action.
I felt it was initially important to understand the interpretation of visual
communication by managers and operators before it is possible to speak about
resistance. Without checking if operators actually had interpreted a given
communication in a consistent way to its intended meaning it would be difficult
to makes claims about the basis of their subsequent action, i.e. was perceived
resistance intentional or was it in fact based on a misunderstanding.
The very use of the term resistance, referring to the operators, also highlights
an important characteristic of their respective position in the organisation, and
relationship to those whose intentions they are potentially 'resisting'.
Automotive UK had a typical mass production organisational structure (Liker
2003), and can be described as a bureaucratic hierarchy (Jaques 1990). In
such an environment the managers have a privileged position. This is in terms
of their formal authority which provides them the opportunity to craft and
implement visual communication, as well as providing other levers of control
that respectively impacts the ability of operators to resist or accede to the
exercising of that authority. The necessity to characterise this web of control to
contextualise the resistance by operators, was considered by me to be too
broad, and outside the scope of this research.
A further reason for excluding operator resistance is that my perception was
that both parties accepted the need and legitimacy of using visual
communication. The manager’s use of visual communication is driven by the
need for stability and standardisation in the relatively closed environment of a
mass production shop-floor (Thompson 2004). The slow to change nature of
this environment allows the legitimacy of visual communication to be built and
12
Gouldner (1954) where both management and workers agreed about certain
rules, which they both enforced, generally in the absence of any tension.
Probably the most important reason why resistance at an individual operator
level has been considered out of scope is related to the issue of the unit of
study. I will introduce in the research methods chapter that the focus has been
at the value stream level, i.e. work-group (Liker 2003, Cummings 1978). My
interest in the use of visual communication has stemmed from my involvement
in the deployment of Lean methods in organisations. Lean production has been
described as an integrated socio-technical system (Shah & Ward 2007). This
perspective is based on seeing production systems as a web of connections
between the social and technical parts of the organisation. "The former consists
of the equipment and methods of operations used to transform raw materials
into products or services; the latter includes the work structure that relates
people to the technology and to each other" (Cummings 1978, p625). An
important consideration when deciding the unit of study has been the
consideration of the role of visual communication within these value stream
teams. Within the socio-technical perspective, the unit of study, i.e. the building
block, is the work group (Cummings 1978), and by implication not the individual
operator level.
At Automotive UK the differentiated production areas have been designed to be
relatively autonomous. This is both in terms of manufacturing equipment, as
well as with sufficient cross functional integration that the groups can largely
self-regulate (Cummings 1978). It is the role of visual communication to enable
this self-regulation; the use of visual communication in the context of
management control, which makes it an important area of study. The purpose
of this research was not to delve into an individual, ideographic level of study
about the individual experience of operators, but consistent with socio-technical
theory, was to explore the experience of the workgroup, and at this nomothetic
level, the intended and interpreted meanings of visual communication.
2.2 Visual Communication Definition
A starting point for this research is to define what visual communication is. It is
13
this is built on a number of other elements that must be introduced. To do this it
is necessary to connect some terms together as they are all involved in the
communication as a process. These terms are knowledge, information, data
and communication (Lenski 2010).
In speaking about how knowledge is shared between individuals, Lenski (2010,
p111) stated that "... information may best be described as communicated
knowledge that is external to a cognitive system and requires an appropriation
process to accommodate it in a specific setting". Here the term ‘information’ is used to describe the shaping of knowledge so that it can be shared and
understood by others. The creation of this information is not self-referential but
equally it cannot reside outside of cognitive systems (Lenski 2010). This is
because it must be both created and interpreted by cognitive systems to be
considered information, or otherwise it remains only data. This leads to a useful
basic definition of communication. It is a process of shaping knowledge to
information by one cognitive system, the transfer through some medium and the
subsequent interpretation by a second cognitive system (Lenski 2010). It is the
very fact that two cognitive systems are involved, and there is a shaping of the
information for the benefit of information transfer that gives rise to it being
considered communication, i.e. an interaction between two people (Keeney
2009). This definition of communication recognises that the cognitive systems
of sender and receiver are separate entities from each other and from the
artefacts of communication that might be necessary in any given context.
Separation of the elements that make up communication is particularly useful as
a definition, given that this research was aimed to explore the relationship
between the intended and interpreted meanings.
Building on the ideas of communication from above, and introducing the visual
dimension, a fuller definition is provided by Keeney (2009) who stated that
visual communication is a social process. It is social because it involves the
interactions between two people, where typically one person at least cares to
communicate a message to another (Keeney 2009). It is a process because it
consists of a series of communication acts or exchanges where one person is
using symbols to send a message and the meaning of this message is
14
2009). The description of it as a process will be further explored in the next
section where I have introduced the conceptual model used in this research.
Finally the visual aspect of the communication is in relation to the way that the
communication is affected, i.e. by objects such as "...drawings, paintings,
photographs, videos, films, computer graphics, animations, and virtual reality
displays" (Keeney 2010, p1).
2.3 Communication Models
Having defined visual communication, in this next section I have provided an
overview of different types of communication theories available and have
specifically highlighted and explored the one used to underpin the conceptual
model used in this research. The introduction of the conceptual model at this
stage is relevant in that it further helps to define visual communication and sets
the scene for the review later in this chapter relating to the use of visual
communication in organisations.
Communication models vary depending on their underpinning theories and can
be characterised into two broad types. The first type are those derived from the
worlds of information technology (Kelly 2014, Baldwin & Roberts 2006), and are
referred to as Process Models. These are based on the perspective of
communication as the transfer of a message, i.e. a linear process where some
message is transferred from point A to point B (Kelly 2014, Baldwin & Roberts
2006). The second type are based on the study of linguistics, and are referred
to as Semiotics Models (Kelly 2014, Baldwin & Roberts 2006). These consider
communication as the production and exchange of meaning, recognising that a
single message can mean different things to different people; meaning is
influenced by the socio-political environment of the communication (Baldwin &
Roberts 2006).
The key difference between these two types can be regarded as the amount of
agency that they afford the recipient of the communication (Kelly 2014). I have
discussed each approach below and have explained the rationale for selecting
the particular approach that I have adopted.
Within semiotics, there are two traditions. One tradition, developed by
15
The other approach, developed by Charles Peirce, considers semiotics as a
social process (Baldwin & Roberts 2006). These two views are not
incompatible (Baldwin & Roberts 2006), and in fact have a great deal in
common. Both models accept that there is an overall lack of correspondence
between a sign (visual communication) and the effect that this can have, which
depends on social and cultural conventions and contexts. In this following
discussion I have elaborated on the Peircean view highlighting one or two
differences between this and the Saussure theory.
Peirce developed a model relating to the meaning making of signs, called the
Peircean Semiosis model. This triadic model includes the object, the sign, and
the effect of the sign on someone. See Figure 2-1 below which shows a
"...three way relation between the sign, the 'absent' entity which it represents,
termed its object and finally the effect the sign produces, its interpretant" (Jappy
2013, p2). Signs are said to be "motivated" (Jappy 2013, p6) by their respective
object in some way, shown by the arrow between the object and sign. The
object is not restricted to physical things, so in this respect it is similar to
Saussure’s theory, but in the Peircean model the object is linked to the meaning of the sign, represented by the dotted line (which is missing from the Saussure
model).
Figure 2-1 – Peircean Semiosis Model
(Jappy 2013, p6)
An important and interesting representation within this model is the solid
horizontal line across the middle, which shows the separation between the
thoughts in the minds of individuals and the real (physical) world (Jappy 2013).
The sign is the only aspect physically available for inspection, but it is
Object
(Referent)
Sign
(Representment)
16
insufficient within the theory of visual semiotics to consider only this. The object
and interpretant must also be considered, despite the fact that they are not
physically available for inspection, being within the minds of someone who
created the sign or the effect the sign has on someone (Jappy 2013). This
results in this triadic nature of object, sign and meaning (Jappy 2013).
Within semiotics theory the act of communication is viewed as a "production
and exchange of meaning" (Fiske 2011, p2) with the receiver seen as "...a
cultural and social agent in the communication" (Kelly 2014, p213), who brings
their own different cultures to bear on the interpretation of meanings within a
given communication (Fiske 2011).
Importantly, Peirce argued that all thinking is dialogic in form (Jappy 2013) and
that internal reflection of meaning, for example of visual communication, is
socially influenced. Peirce also argued that semiosis (the act of interpretation)
is not limited and the interpreter is free to successive interpretants (Jappy
2013), i.e. reinterpretation of the meaning of signs. This dialogic nature is
important if we consider the use within a group, such as a shop-floor production
team. In such a context there is clearly the opportunity for the history of prior
usage to exert an external influence on the meaning making of a given sign.
For example this could be related how certain production imperatives have
been emphasised, or the physical and social context of the production areas
have contributed to the meaning of the sign.
Within the semiotic theory perspective the focus is typically on the text (visual
communication) itself and how the reader interacts and negotiates with it to
establish meaning. By the same token the message sender and their
respective motivation for the message "declines in importance...the emphasis
shifts to the text and how it is read" (Fiske 2011, p3). This highlights an
important weakness of this type of model in the context of this research.
Semiotics is considered suitable for interpretivist, post-positivist or positivist
research (Cuncliffe 2010), but the focus is more on the message and its
interpretation and potentially misses an important element of the overall
17
My research aim was to understand the intended and interpreted meaning of
visual communication. It was important to consider the motivation and intention
in the minds of the managers in their usage of particular shop-floor visual
communication signs as well as the subsequent interpreted meanings. I wanted
to understand from those charged with the responsibility to affect control of the
shop-floor about how they consider particular signs, what is the intention of
those signs, and to then understand from the target audience of these signs
how they interpret their meaning. It was because of this lack of end to end
(intended and interpreted) communication emphasis in the semiotic theory
models that I decided against their use in this research.
In contrast the process model effectively defines communication as the
transmission of messages (Fiske 2011). This is exemplified by the Shannon &
Weaver (1949) communication systems model. As the name suggests, this
sees communication according to a systems perspective (Jones & Kovac 2003).
This model originated from theory developed to illustrate how information is
transmitted using communication channels such as telegraphy (Baldwin &
Roberts 2006). However, it is argued by its authors to be applicable to all
human communication.
In Figure 2-2 below, the linear nature of the model, moving from left to right, is
evident. All process communication models are said to consist of five basic
elements (Watson & Hill 2012). Below I have explored each of these elements
and identified how they relate to visual communication in an organisational
18
Figure 2-2 – Shannon & Weaver (1949) – Communication System Model
(Shannon & Weaver 1949, p4)
The first element is the information source (the sender) who determines the
message to be sent, and is motivated to select one particular message from all
possible messages. This point is relevant to this research because the aim was
to access the motivation behind this intentional message transmittal as opposed
to an unwitting emergence of meaning or motivation from the interaction with a
message and the recipient. This identification in the model of the information
source, as distinct from the message, recognises an agency and motivation
(Fiske 2011) for communication.
In the case of visual communication for organisational use, the identification of
the source and their role in the organisation can help to provide some
predictability about the possible messages that are being communicated. Their
agency may be limited because of organisational imperatives, departmental
policies, protocols and standards about what and how they are able to use
visual communication. This effectively means that the messages that the
information source chooses to transmit are not 100% predictable, but it is also
not totally surprising. From a research perspective these considerations help to
provide some theoretical basis for the motivation behind the message that the
visual communication is being used to convey.
The message is identified as a flow of data in the model. There is recognition
that there is a message in the mind of someone before it has been converted
into a visual communication format. This separation in the model is suggestive
that an inspection of the visual communication alone could not be thought to
faithfully contain the message that was intended. This is because by the stage
the message becomes a visual communication it has already been subjected to
Signal Information
Source Transmitter Receiver Destination
Noise Source
Message Received Message
19
translation, i.e. "...must be sampled, compressed, quantized and encoded, and
finally interleaved...to construct the signal" (Shannon & Weaver 1949, p7).
The ‘message’ behind any given visual communication can be relatively
inaccessible because of the time and place separation between the motivation
for creating a visual communication and the physically available artefact.
However, there are aspects about the nature of any particular organisational
environment that could be helpful. An example of this could be if there are
relatively few, slow to change, key imperatives dominating that particular type of
organisational environment (Schmidt 2005). The effect could be that the overall
meaning of the message behind a given visual communication would still be
accessible, because it was still relevant and had not diminished.
As mentioned, messages have a level of predictability because they are
themselves dependent. For example the core technology operating within the
organisation to a large extent determines the range and nature of issues that
have to be communicated (Perrow 1967). This predictability can make the
message more or less resilient to communication, resulting in errors and
therefore potential ineffectiveness. The organisational socio-cultural context
(Seppanen & Valiverronen 2003) alters the obligation it places on those
engaged in transcribing visual communication in that they are aware of this
environment and so the message transmission (the design of the visual
communication) is correspondingly taking place with this background
knowledge in mind. This means that the transmission process being
represented as a simple linear one-way process is over simplified. The issues
effecting the end-to-end visual communication can be better appreciated by
considering the broader operating environment. A poorly encoded message
could perhaps still result in effective communication because the actors it is
trying to connect have a broader understanding of what is likely to be
communicated (Fiske 2011). Due to the persistent nature of visual
communication in the workplace, and the time and place separation of those
that have originally motivated that communication, it is quite possible that the
managers in a given organisation have not in fact authored currently used signs
(visual communication) and that these are inherited or imposed. However, from
20
the shop-floor (Schmidt 2005), the current managers are part of the institution
and subject to the logics operating in that institution (Vardaman et al. 2012) so
in this research they will be considered as custodians of the original message.
The second element in the above model is the conversion of the message to
some form of signal ready for transmission. The transmitter codes the message
in a way that it can be transmitted. In the case of this research, this coding is
into the form of visual communication, such as the examples found on the
shop-floor. Shannon & Weaver (1949) were particularly concerned with this and the
associated process steps of message transmission, i.e. the technical issues of
the message encoding, transmission and decoding. However in the case of
visual communication in the context of this research, it is necessary to move to
the extreme ends of the model and compare the information source and the
destination to really understand the issues of message transmission. This is
because context cannot be stripped away from the intention of the message or
the recovery process (Rogoff 1990), which ultimately means that context cannot
be detached from the process of visual communication as a whole.
Communication as an end to end process is not just an engineering problem but
is linked to its social context; it is a socially embedded problem (Rogoff 1990).
Shannon & Weaver (1949) state that communication systems have their own
finite range of symbols and certain sequences (order) to these symbols that are
considered an acceptable way to use them. In the example of spoken
communication, there are words, and some predictable sequences to the usage
of these words. Similarly it can be expected that in visual communication there
are also some finite range of symbols. The taxonomy provided by Greif (1991)
and Jaca et al. (2014), which is reviewed later in this chapter, alludes to such a
finite list. However, in this research I have not explored the visual
communication directly for its design elements and will not elaborate in detail
about these issues, although some aspects are mentioned in the findings
chapter.
The third element in the Shannon & Weaver (1949) model is shown as an
empty box. This relates to the 'channel' and is the location where the visual
communication is being displayed. This is an important aspect of visual
21
operators become recipients of the message when they are able to see it. This
aspect has been considered in this research through the use of appropriate
methods and will be discussed in the Research Methodology and Design
chapter.
The fourth element, switching to the other side of the model, is for this visual
communication to be received by the operator. This is a reversal operation from
that of the transmitter "...reconstructing the message from the signal" (Shannon
& Weaver 1949, p4). An example of this would be the operator seeing the
visual communication; the eye would be considered the receiver.
The fifth element of the model is the 'destination'. In the case of visual
communication this is whoever is looking at and interpreting the visual
communication from its channel, i.e. being used as a self-service tool (Greif
1991).
Perhaps due to the engineering and mathematical background of Shannon &
Weaver (1949), their model is depicted as a one way process of transmitting
messages (McQuail & Windahl 2015). The encoding and decoding is shown
without a visible feedback mechanism to validate the meaning (Baldwin &
Roberts 2006). The focus of the authors when creating this model was on the
process effectiveness of message transmittal (Shannon & Weaver 1949), and
faulty decoding is seen as a problem with the process, i.e. a communication
failure which can be traced back to some part of the process (Fiske 2011).
Although this model may seem an over simplified explanation of
communication, I have considered it suitable for exploring the communication in
the context of this research. Shop-floor use of visual communication separates
the transmittal and receipt of the information in both time and space and is
effectively a one way process. Greif (1991) refers to this separation as a
"self-service" principle, arguing that the consumption of the message is autonomous.
Arguably this unidirectional communication is less a communication model but
instead a depiction of information flow through some medium (Al-Fedaghi
2012). I reject the argument of it lacking a feedback loop because this seems to
stem from a simplistic view of cybernetic systems, where there is an expectation
22
of the Shannon & Weaver (1949) model by first one party and then a second
would equally constitute a conversation, and the necessary feedback would be
through repetitive use of the model rather than by some additional loop within it,
for example as the one proposed by DeFleur (McQuail & Windahl 2015). I
consider the Shannon & Weaver model (1949) to be elegant and representative
of a visual communication system.
Many other communication models exist. Some like the Shannon & Weaver
model do not have an obvious visible feedback loop, whilst other do, e.g.
Osgood & Schramm 1956 Communication Model (Watson & Hill 2012). Others
highlight and focus on the importance of shared fields of experience for effective
communication, i.e. Schramm Communication Model 1956 and the Berlo
Communication Model 1960 (Watson & Hill 2012). Issues such as sender and
receiver orientations to each other and their consonance and dissonance are
raised by authors such as Theodore Newcomb in his communication model
from 1953 (Newcomb 1953). From the perspective of this research however
none of them add anything that is not already stated or implied within the
Shannon & Weaver model or add anything theoretical that has informed this
study to an alternative perspective. Therefore I have used the Shannon &
Weaver (1949) model to conceptually underpin this research.
In Figure 2-3 below is an adapted version of the original Shannon & Weaver
(1949) process model, with headings modified to suit this research. This
depicts the communication process, as it is related to the human process within
an organisation, in the context of using visual communication. I will use this
modified model in the next chapter to explain how the research design and
23
Figure 2-3 – Shannon & Weaver Model Depicting Visual Communication
(Based on the Shannon & Weaver (1949) Communication Model)
2.4 Visual Communication Frameworks
–
Taxonomy
Several authors have previously identified visual communication frameworks,
developed with shop-floor environments in mind. The approaches to
implementing visual communication that these authors have taken have
provided a useful understanding of their perspectives and assumptions. In the
following section I have compared these models against each other in an
attempt to synthesise an overall list of themes. This has been done to support
the analysis used in the research methods as well as to provide a better
understand of what is motivating the use of visual communication in shop-floor
environments.
Visual communication is seen as an emergent field of study, currently without
strong traditions or unifying theories (Pauwels 2006, Smith et al. 2004). This
lack of a single existing holistic approach (Jaca et al. 2014) has meant that I
have had to look at a number of taxonomies that were available and consider
how these might inform this research.
In Figure 2-4 below, Greif (1991) identified six broad shop-floor related themes
which he further broke down into twenty sub-elements. The overall motivation
behind these themes is seen to be related to the control of the shop-floor which
is being exercised through visual communication.
Signal
Manager Visual
Communication Operators' Eye Operator
Noise Source Shop-Floor
Message Received Message
24
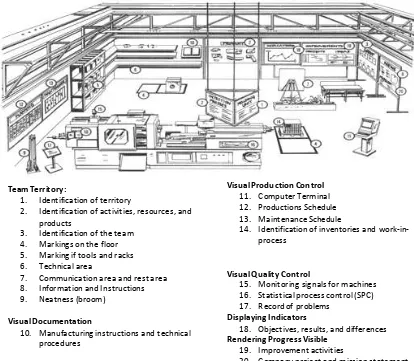
Figure 2-4 - A Visual Workplace
(Greif 1991, p20-21)
Greif (1991) describes visual communication as acting as a self-service
compass. The point he is making is that visual communication is reinforcing
control through orientating organisational members. He reiterates this point by
speaking about how visual communication supplements, but does not replace,
the normal hierarchy. He also states, in a sense repeating the same message,
that "visual communication challenges the mode of expression adopted by
hierarchical authority rather than the form of authority" (Greif 1991, p19). The
issue of management control as a motivation for using visual communication is
a theme that runs through this research.
In contrast, the potential to tailor and distribute visual communication to specific
audiences within the organisation has been argued by some authors to be for
the purpose of empowerment. Kattman et al. (2012) and Galsworth (2004)
Team Territory:
1. Identification of territory
2. Identification of activities, resources, and products
3. Identification of the team 4. Markings on the floor 5. Marking if tools and racks 6. Technical area
7. Communication area and rest area 8. Information and Instructions 9. Neatness (broom)
Visual Documentation
10. Manufacturing instructions and technical procedures
Visual Production Control 11. Computer Terminal 12. Productions Schedule 13. Maintenance Schedule
14. Identification of inventories and work-in-process
Visual Quality Control
15. Monitoring signals for machines 16. Statistical process control (SPC) 17. Record of problems
Displaying Indicators
18. Objectives, results, and differences Rendering Progress Visible
19. Improvement activities
25
have argued that the purpose of visual communication is not about perpetuating
the "command-and-control tradition..." (Galsworth 2004, p46) but instead to
drive empowerment by providing answers to operators that allow them to be
more autonomous. I partly agree that visual communication serves the purpose
of autonomy. However, this autonomy is constrained by bureaucratic controls
which define the roles and responsibilities of individuals within the organisation.
An example of this is the Tayloristic standard operating procedures based on
time and motion study principles which define the work expected of those on the
shop-floor to within second increments (Towill 2010).
My view of the autonomy offered through the interaction with visual
communication is that it is pseudo autonomy and that a relatively mechanistic
(compliant) behaviour is expected. Any empowerment is about how control is
distributed closer to the point of action, i.e. some decision making is moved
closer, in time and space, to where it can be made, but the range of decision
making is not