imaging system for thigh volume measurement
BULLAS, Alice <http://orcid.org/http://orcid.org/0000-0003-2857-4236>, CHOPPIN, Simon <http://orcid.org/0000-0003-2111-7710>, HELLER, Ben <http://orcid.org/0000-0003-0805-8170> and WHEAT, Jonathan
<http://orcid.org/0000-0002-1107-6452>
Available from Sheffield Hallam University Research Archive (SHURA) at: http://shura.shu.ac.uk/11532/
This document is the author deposited version. You are advised to consult the publisher's version if you wish to cite from it.
Published version
BULLAS, Alice, CHOPPIN, Simon, HELLER, Ben and WHEAT, Jonathan (2016). Validity and repeatability of a depth camera based surface imaging system for thigh volume measurement. Journal of Sports Sciences, 34 (20), 1998-2004.
Copyright and re-use policy
See http://shura.shu.ac.uk/information.html
Validity and repeatability of a depth camera based surface imaging system for thigh
volume measurement.
ALICE M BULLAS, SIMON CHOPPIN, BEN HELLER and JON WHEAT*.
Centre for Sports Engineering Research, Sheffield Hallam University, UK.
Running Title: Validity and repeatability of thigh volume measures.
Word Count: 3738 (inc. citations, exc. references, tables, figures and captions)
Ms. ALICE M BULLAS
Affiliation: Centre for Sports Engineering Research, Sheffield Hallam University, UK.
Telephone Number: +44 (0)114 225 2355 Email Address: [email protected]
Dr. SIMON CHOPPIN
Affiliation: Centre for Sports Engineering Research, Sheffield Hallam University, UK.
Telephone Number: +44 (0)114 225 4405 Email Address: [email protected]
Dr. BEN HELLER
Affiliation: Centre for Sports Engineering Research, Sheffield Hallam University, UK.
Telephone Number: +44 (0)114 225 4435 Email Address: [email protected]
Dr. JON WHEAT (Corresponding Author *)
Affiliation: Centre for Sports Engineering Research, Sheffield Hallam University, UK.
Postal Address: Centre for Sports Engineering Research, Sheffield Hallam University,
Collegiate Hall, Collegiate, Sheffield, S10 2BP
Abstract
Complex anthropometric measures, such as area and volume, can identify changes in body
size and shape that are not detectable with traditional anthropometric measures of lengths,
breadths, skinfolds and girths. However, taking these more complex measures with manual
techniques (tape measurement and water displacement) is often unsuitable. Three
dimensional (3D) surface imaging systems are quick and accurate alternatives to manual
techniques but their use is restricted by cost, complexity and limited access. We have
developed a novel low cost, accessible and portable 3D surface imaging system based on
consumer depth cameras. The aim of this study was to determine the validity and
repeatability of the system in the measurement of thigh volume. The thigh volumes of 36
participants were measured with the depth camera system and a high precision commercially
available 3D surface imaging system (3dMD). The depth camera system used within this
study is highly repeatable (technical error of measurement of < 1.0% intra-calibration and ~
2.0% inter-calibration) but systematically overestimates (~6%) thigh volume when compared
to the 3dMD system. This suggests poor agreement yet a close relationship, which once
corrected can yield a usable thigh volume measurement.
Keywords: Kinanthropometry, Anthropometry, Depth Camera, 3D Body Scanning, Surface
Introduction
Kinanthropometry is an academic discipline that uses anthropometric measures to determine
the relationship between human structure and movement (Stewart, 2010). The description and
analysis of body dimensions of sports populations is vital, not merely to monitor training,
sports performance and talent identification, but to understand the evolution and development
of sport (Norton & Olds, 2001). Commonly, kinanthropometric investigations have used a
'traditional' model of anthropometric analysis: the measurement of lengths, breadths,
skinfolds and girths, as well as calculations based on these measures such as body mass index
(BMI) and somatotype. However, more complex anthropometric measures, such as volume
and surface area, can identify changes in body size and shape that might otherwise go
unnoticed by the traditional model (Rønnestad, Hansen & Raastad, 2010; Schranz,
Tomkinson, Olds, Petkov & Hahn, 2012). Consequently, recent literature (Schranz et al.,
2012) has suggested the use of a 'new' model of anthropometric analysis within
kinanthropometry studies: the measurement of traditional anthropometric measures alongside
more complex anthropometric measures, such as area and volume.
The new model of anthropometric analysis can be conducted using manual techniques, such
as tape measurements and water displacement, or digital techniques, such as body scanning
and surface imaging. Manual tape measurement requires minimal, low-cost equipment (tape
measures, callipers), is easy to perform due to standardised procedures and guidelines, is
portable and, until recently, has been the only technique available to measure simple
anthropometric measures. However, manual tape measurement is time consuming, requires
direct physical contact and is heavily dependent upon the training and experience of the
measurement personnel (Maylia, Fairclough, Nokes & Jones, 1999). Additionally, the
measurements are usually based on the average of a small number of samples and are highly
population specific, thereby are only valid when used on the same population. Water
displacement is regarded as the 'gold standard' method of volume measurement. Nonetheless
it is time consuming, lacks standardised procedures and guidelines and is not suitable for
individuals with wounds or skin diseases (Kaulesar Sukul, den Hoed, Johannes, van Dolder &
Benda, 1993). Furthermore, water displacement is only capable of directly measuring
volume, therefore also relies on predictive equations to estimate other complex
anthropometric measures, such as surface area. As a result, the use of manual techniques for
obtaining more complex anthropometric measures is questionable (Olds & Rogers, 2004). It
has been suggested that digital techniques should be used (Olds & Rogers, 2004; Stewart,
2010).
Body scanning and surface imaging systems create 3D digital images quickly, from which
many anthropometric measures can be directly extracted. In addition, these systems allow
retrospective analysis of data, the opportunity for contactless measurement and the ability to
produce a digital representation of body changes over time, which are all unfeasible through
manual techniques (Robinette, 2013). There are many different systems available: laser,
stereo-photogrammetry, stereo-radiography, millimetre wave and light based. Each system
uses different methods to generate digital 3D images: the deformation of laser lines by the
body, the stitching together of multiple stereo-camera images, the collation of x-ray images,
the registration of the electromagnetic radiation (millimetre waves), the time-of-flight
principle and the deformation of pseudo-structured light patterns (Daanen & Ter Haar, 2013).
However, even though some have translated from fixed lab instruments into commercially
subsequently are rarely used within kinanthropometry research or practice (Daanen & Ter
Haar, 2013).
Depth cameras are low cost light based cameras that use the time-of-flight principle or a
pseudo-structured light pattern, and computer vision techniques / algorithms to capture colour
images and depth information to create digital 3D point clouds of the external geometry of
the body. They are readily available within a number of consumer technologies (e.g.
Microsoft Kinect) and can be used to create affordable 3D body surface imaging systems
(Choppin, Probst, Goyal, Clarkson & Wheat, 2013; Clarkson, Choppin, Hart, Heller &
Wheat, 2012; Clarkson, Wheat, Heller & Choppin, 2015). Several studies have investigated
the use of depth camera based surface imaging systems in the measurement of
anthropometric parameters, demonstrating favourable results when compared to and laser
systems (Clarkson, Choppin, Hart, Heller & Wheat, 2012; Robinson & Parkinson, 2013) and
favourable but overestimated results when compared to manual measures (Bullas, Choppin,
Heller, Clarkson & Wheat, 2014; Clarkson et al., 2015). Consequently, a depth camera based
surface imaging system appears to be the most suitable method of conducting the new model
of anthropometric analysis within kinanthropometry studies.
Although a wide array of complex measures are available within the new method of
anthropometric analysis, the majority of previous kinanthropometry studies have
concentrated on the measurement of volume, potentially due to its importance in physical
movement. For example thigh volume has been used as part of descriptive kinanthropometry
of population groups (Schranz et al., 2012), and within applied analysis to investigate the
effects of ageing on movement (Chen et al., 2011 ), exercise interventions (Messier et al.,
aim of this study was to determine the validity and reliability of a low cost depth camera
based 3D surface imagingsystem in conducting the new model of anthropometric analyses,
in particular thigh volume measurement within kinanthropometry.
Methods
Participants
Through convenience sampling, 36 healthy recreationally active volunteers participated in
this study (Table 1). All volunteers were screened to determine their suitability for
participation and required to provide written informed consent. Participants were required to
be over the age of 18 years and able to stand unaided, as all measures were conducted
standing. All procedures were approved by Sheffield Hallam University Research Ethics
Committee.
**** Table 1 near here ****
Research design
Each participant attended one 60 minute testing session. To determine the validity and
repeatability of thigh volume measures obtained by the depth camera system participants had
the thigh volume of both legs measured by the depth camera system and a high precision
commercially available surface imaging system - 3dMD (3dMD Inc., Atlanta, GA, USA).
Although the 3dMD system is not a ' gold standard' method, it is a high-precision system that
is a valid and reliable tool for volume measurement (Van der Meer, Dijkstra, Visser, Vissink
& Ren, 2014). Traditionally, investigations into volume would use water displacement, the
'gold standard' technique for volume measurement, despite its limitations discussed
camera system in conducting the new model of anthropometric analysis, of which volume is
only one measurement, it was decided that comparison should be made against a method also
capable of conducting the new model of anthropometric analysis. Thigh volume was selected
due to its prevalence as a measurement within previous kinanthropometry literature
(Coelho-e-Silva et al., 2013; Rønnestad et al., 2010;). Data were collected in 3 sets; each set consisted
of 3 scans of each leg, separated by a recalibration of the depth camera system (Figure 1).
Thus, a total of 9 scans, per method, per leg, were acquired for each participant.
**** Figure 1 near here ****
Measurement methods
3dMD system
3dMD (3Q Technologies Inc., Atlanta, GA) is a surface imaging system consisting of 5
synchronised modular units, each containing 3 machine vision cameras, placed around a
square 258 x 258 cm aluminium Bosch (Bosch Rexroth AG) strut frame (Figure 2), using a
single computer (64 Bit Windows 7 ProfessionalI7 4 Core CPU @ 3.6GHz 8GB RAM).
Calibration and data collection was conducted using 3dMD acquisition software. The
calibration procedure followed 3dMD guidelines using a calibration plate (Figure 3) and was
conducted at the start of every testing day and then approximately every 2 hours thereafter.
**** Figure 2 near here ****
Depth camera (Kinect) system
The depth camera system was developed in-house (the Centre of Sports Engineering
Research, Sheffield Hallam University, UK) and was similar to that used within previous
investigations (Bullas et al., 2014; Clarkson et al., 2012). The system consisted of four depth
cameras (Microsoft Kinect, Microsoft Corporation, Redmond, USA) vertically mounted 122
cm above the ground at each corner of a square aluminium Bosch strut (Bosch Rexroth AG)
frame (141 x 141 cm) (Figure 2) and connected to a single computer (64 bit, i5 4-core CPU
running at 3.4 GHz with 8 GB of RAM and an Nvidia Geforce GTX 650 graphics card). This
layout was adopted to provide the optimum compromise between the number of depth
cameras and the field of view.
KinAnthroScan - custom software created in-house using the Microsoft Kinect software
development kit (Microsoft Corporation, Redmond, USA), facilitated calibration and data
collection. The calibration procedure involved two stages. First, a point cloud of a calibration
object (4 polystyrene spheres connected by a narrow metal pole - Figure 3) was obtained in
nine positions throughout the calibration volume. The centre of each sphere was found in
each camera's local coordinate system using custom-written algorithms. This resulted in 36
common points across all four cameras. The relative position and orientation of the cameras
was estimated using a common rigid body transformation technique (Spoor and Veldpaus,
1980) and optimised using a RANSAC approach (Fisher & Bolles, 1981). Similar to that
detailed in Clarkson et al., (2015). Second, estimates of the relative position and orientation
of the cameras were further refined by imaging a more complex object (mannequin chest) and
updating the calibration using an iterative closest point algorithm (Besl & Mckay, 1992). Full
calibration was conducted at the start of each testing day and in between each data collection
data sequentially, resulting in a total data collection time of approximately 900ms. This
avoided interference caused by the overlapping pseudo-structured infrared light projected by
multiple Kinect cameras.
Measurement protocol
The thigh segment was defined using International Society for the Advancement of
Kinanthropometry (ISAK) standardised anthropometric locations of the upper thigh: 1 cm
distal to the gluteal fold site (Stewart, Marfell-Jones, Olds, & de Ridder , 2011, pp.85), and
upper knee circumference: midpoint of the superior border of the patella (Stewart et al., 2001,
pp.465). This method differs slightly from that used within biomechanical modelling or
mechanical analysis, in which the thigh segment is segmented at the epicondyles of the knee
and the upper aspect of the 'thigh flap' (area encompassed by the anterior superior iliac spine,
hip joint or greater trochanter, and the gluteal furrow) ( Wu & Cavanagh, 1995). However,
definition of the thigh based upon measures similar to ISAKs standardised anthropometric
locations is more popular within kinanthropometry literature (Chen et al., 2011;
Coelho-E-Silva et al., 2013). These locations were manually palpated and marked directly onto the
posterior and anterior aspect of the segment using crosses made with pencil (~1.5 x 1.5cm).
Coloured sticky markers (~1.0 x 1.0cm) were affixed to the centre of each cross to ensure all
marked points were visible in the 3D surface images. During all procedures participants were
required to wear shorts. These were secured above the uppermost marker point where
necessary. All marking procedures were conducted by a level one ISAK kinanthropometrist.
Participants stood on one leg during measurement, with their arms raised above their hips
(Figure 2). The second leg was raised and placed on a higher platform (Figure 2) to avoid
that participants’ thighs were within the calibrated volume of both systems. Participants were
asked to visually focus on small circular coloured wall-mounted markers, as focusing gaze on
a stationary target during standing reduces postural sway (Thaler, Schütz, Goodale, &
Gegenfurtner, 2013). The depth camera system was positioned within the 3dMD system
(Figure 2) to facilitate near-concurrent data collection. It was not possible to collect entirely
simultaneously as each system uses different structured light patterns. The depth camera
system (~900ms data collection time) was triggered first, followed by the 3dMD system
(~15ms data collection time). The systems were manually triggered, resulting in a total data
collection time of approximately 2seconds.
Analysis
Each scan was manually digitised; manual identification of marked landmarks in each 3D
image by a single researcher within KinAnthroScan software. For the depth camera data,
thigh volumes were calculated in KinAnthroScan which uses Green’s equations to calculate
volume using the method outlined by Crisco & McGovern (1998). Briefly, the 3D point cloud
of the thigh (proximal and distal ends defined by the digitised ‘upper thigh’ and ‘upper knee
circumference’ landmarks, respectively) was segmented into slices (1 mm thick) along the
long axis of the segment. Each slice contained 2D coordinates of the raw points from the
depth cameras. Smoothing splines - one for each contour - created collections of smoothed
points. These data were then used in a discrete equation to calculate the volume of the thigh
across all slices (Crisco and McGovern, 1998).
For the 3dMD data, Geomagic Studio 8 (Raindrop Geomagic, USA) was used to calculate
thigh volume. Geomagic was selected as it is one of the fastest, most accurate and
following the closure of the segmentation plane, triangular meshing and the creation of a
watertight mesh, volume was computed using the proprietary method.
Following the extraction of thigh volumes, a battery of agreement and repeatability tests were
conducted: Mean thigh volumes, raw and absolute mean differences, technical error of
measurement (TEM %) (Stewart & Sutton 2012) and statistical difference testing (t-tests)
were calculated within Microsoft Excel (2010, Microsoft Corporation, USA) and SPSS
software (version 21.0, IBM, USA). To explore the nature of any differences Bland-Altman
and ordinary least products regression (OLP) analyses were conducted in Microsoft Excel
and MATLAB (version 13.0b, Mathsworks, USA), following the guidelines of Bland and
Altman (1999) and Ludbrook (1997, 2010) respectively.
Results
The female and male data demonstrated statistically significant differences (p<0.05) in both
absolute size and the degree of agreement between the systems (Table 2). Consequently, the
results from each sex are presented separately. Furthermore, as the left and right sides of the
thigh produced similar results, the results from both sides are presented together to aid
presentation and interpretation of the data.
Agreement
Thigh volumes were significantly different (p < 0.05) between the systems (Table 2).
The Bland Altman plots of thigh volume measurements demonstrated both statistically
significant fixed and homoscedastic proportional bias between the two methods in both
female (Correlation R = 0.46, p=0.00. Slope = 0.05, p=0.00. Intercept = 41.56, p= 0.05) and
male participants (Correlation R = 0.48, p=0.00. Slope = 0.06, p=0.00. Intercept = 31.97, p=
0.31). This was reiterated by the OLP analysis that suggested the presence of a fixed and
minor proportional systematic bias in both female (intercept a’ = -40.98, CI -80.12 - -2.25,
slope b’ =0.95, CI 0.94 - 0.96) and male participants (intercept a’ = 30.13, CI -28.28 - 88.53,
slope b’ =0.94, CI 0.93 - 0.965). To investigate this bias further Bland Altman ratio plots
were calculated (Figure 4). This transformation identified the depth camera system to be
systematically overestimating thigh volume by a mean of ~6%
**** Figure 4 near here ****
Repeatability
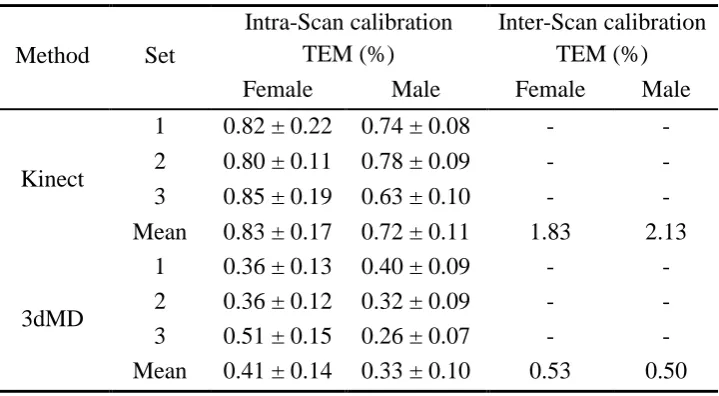
The depth camera system demonstrated larger TEM (%) values than the 3dMD system (Table
3). No statistically significant differences were demonstrated either intra-calibration or
inter-calibration sets (Table 3).
**** Table 3 near here ****
Discussion
The aim of this study was to determine the validity and reliability of a low cost, depth camera
based 3D surface imagingsystem in conducting new model of anthropometric analysis, in
particular thigh volume measurement. The thigh volumes of the right and left legs of 36
by a high precision commercially available 3D surface imaging system (3dMD). Overall, the
depth camera system demonstrated highly repeatable but systematically greater thigh
volumes than the 3dMD system.
Statistically significant differences were demonstrated between the sexes in both absolute
size and the degree of agreement between the two methods. It is possible this is attributable to
differences in balance, absolute size, morphological characteristics, and / or surface texture
(Nguyen & Shultz, 2007; Tur, 1997; Kollegger, Baumgartner, Wöber, Oder &
Deecke, 1992), but future work is required to confirm this. These differences, however, are
relatively consistent and do not appear to impact the interpretation of the validity and
repeatability of the depth camera system.
A statistically significant systematic overestimation of thigh volume (~6%) was demonstrated
by the depth camera system relative to the 3dMD system. Similar systems based on Microsoft
Kinect depth cameras have been associated with similar findings related to the measurement
of circumferences of solid objects (e.g. cylinders: Clarkson et al., 2015) and human body
segments (Bullas et al., 2014), in addition to the volumes of mannequin (Choppin et al.,
2013) and human body segments (Clarkson et al., 2012). Although it is possible to correct the
fixed and proportional systematic bias using a linear model to yield a usable thigh volume
measurement, the cause of the difference between the depth camera and 3dMD systems is not
clear. Previous unpublished work, which analysed 3dMD data in both KinAnthroScan and
Geomagic, demonstrated no statistically significant differences between the volume measures
calculated. Consequently, the authors do not believe the fixed overestimation of the depth
fixed overestimation may stem from hardware limitations, potentially an inaccuracy within
the calibration procedure. However, further work is required to confirm this.
The depth camera system demonstrated high intra-calibration repeatability (0.77% TEM).
This is less repeatable than the 3dMD system (0.37% TEM) but similar to previous studies
such as Clarkson et al., (2014) which reported a TEM of 0.88% in the measurement of
mid-torso volume. With regards to inter-calibration repeatability the depth camera system
demonstrated a TEM of 1.98%. This is greater than the inter-calibration repeatability
demonstrated by the 3dMD system (0.52% TEM). Clarkson et al., (2015) demonstrated
intra-calibration TEM of 0.42% and inter-intra-calibration TEM of 1.04% when measuring a cylinder
representing the upper leg. The larger TEM (%) demonstrated within this study may be
attributed to a different surface texture and postural sway.
No study has investigated the natural daily variation of thigh volume or identified the
minimum clinical difference important in thigh volume measurement. Furthermore, currently
no international standards exist on the acceptable reliability required by measurement
systems for complex anthropometric measurements, as does for traditional anthropometric
measures (ISO 20685-1, International Standards Office, 2010). As a result it is difficult to
determine, with confidence, if the intra and inter-calibration repeatability demonstrated is
high enough to allow the measurement and detection of true change, or if this would be
masked by the system’s variability. In kinanthropometry, repeatability is assessed using the
ISAK criteria (Stewart & Sutton, 2012). Based on these criteria the depth camera system
demonstrated high intra-calibration repeatability - better than the minimum precision required
at ISAK level 2 and above: TEM of less than or equal to 1%, post examination (Gore et al.,
repeatability, equal to that of a level 1 ISAK kinanthropometrist; TEM of less than or equal to
2%, post examination (Stewart & Sutton, 2012). However, these interpretations should be
judged with caution, as the criteria are based on ‘traditional’ anthropometric measures -
lengths, breaths, skinfolds and girths - with no criteria published for volume.
Limitations
This study has a number of limitations that require consideration. First, to reduce the risk of
occlusion, physical support for participants was not provided, increasing the risk of postural
sway and movement artefacts within the 3D images. This would lead to reduced validity and
repeatability. Although visual inspection indicated only a minor presence of motion artefacts
in a limited number of depth camera images, participant movement would have a greater
influence on the depth camera system due to its longer data collection duration than the
3dMD system, ~900ms compared to 15ms respectively. Therefore, future investigations
should include some form of hand support. Furthermore, this study has focused solely on
thigh volume, which is only one of many anthropometric measures possible within the new
model of anthropometric analysis. Thus, results of this study suggest that depth camera
systems are suitably reliable and repeatable for measuring the thigh volume and only that
they might be for taking other complex anthropometric measurements in kinanthropometry.
However, further work is required to confirm this.
Application
The use of a depth camera based surface imaging system in kinanthropometry investigations
may be beneficial in a number of contexts. A recent example is Basset et al., (2014) which
explored the relationship between body morphology and sporting performance in endurance
method to the manual methods used by Basset et al., (2014). It would eliminate
population-specific predictive equations to calculate volume; often unsuitable for use on atypical
population groups such as athletes. This allows for quicker data collection, thereby
facilitating investigations with larger samples. Additionally in studies of children, such as
Coelho-E-Silva et al., (2013) in which high cost systems may not be suitable, a depth camera
system may be an affordable and portable alternative.
Conclusion
This depth camera system offers multiple advantages over existing techniques: it is quick,
low cost, commercially available, portable, and allows the collection of a wide-array of
anthropometric measures and shape analyses. The depth camera system used within this
study is highly repeatable but gives systematically greater thigh volumes than the 3dMD
system. This suggests poor agreement yet a close relationship, which once corrected can yield
a usable thigh volume measurement. Based upon the findings of this study and the multiple
advantages over existing techniques, future kinanthropometry studies should consider the use
of depth camera based surface imaging systems.
Disclosure statement
The authors declare no potential conflict of interest.
Acknowledgements
The authors would like to thank Terry Senior and Sean Clarkson for their assistance, and all
volunteers for their participation.
References
Basset, F. A., Billaut, F. & Joanisse, D. R. (2014). Anthropometric characteristics account for time to exhaustion in cycling. International Journal of Sports Medicine, 35(13), 1084-9. doi: 10.1055/s-0034-1375694.
Besl, P. J., & McKay, N. D. (1992, April). Method for registration of 3-D shapes. In Robotics-DL tentative (pp. 586-606). International Society for Optics and Photonics.
Bland, J. M. & Altman, D. G. (1999). Measuring agreement in method comparison studies. Statistical Methods in Medical Research, 8, 135-160. doi: 10.1177/096228029900800204.
Bullas, A., Choppin, S., Heller, B., Clarkson, S. & Wheat, J. (2014, October).
Kinanthropometry applications of depth camera based three-dimensional scanning systems in cycling: repeatability and agreement with manual methods. International Conference on 3D Body Scanning Technologies Conference, Lugano, Switzerland. doi:10.15221/14.290.
Chen, B.B., Shih, T.T.F., Hsu, C. Y., Yu, C.W., Wei, S. Y., Chen, C. Y., Wu, C.H. & Chen, C. Y. (2011). Thigh muscle volume predicted by anthropometric measurements and
correlated with physical function in the older adults. The Journal of Nutrition, Health & Aging, 15, 433-438. doi: 10.1007/s12603-010-0281-9.
Choppin, S., Probst, H., Goyal, A., Clarkson, S. & Wheat, J. (2013, November). Breast volume calculation using a low-cost scanning system. International Conference on 3D Body Scanning Technologies, Long Beach CA, USA. doi:10.15221/13.012.
Clarkson, S., Choppin, S., Hart, J., Heller, B. & Wheat, J. (2012, October). Calculating body segment inertia parameters from a single rapid scan using the Microsoft Kinect. International Conference on 3D Body Scanning Technologies Conference, Lugano, Switzerland. doi: 10.15221/12.153.
Clarkson, S., Wheat, J., Heller, B. & Choppin, S. (2015). Assessment of a Microsoft Kinect-based 3D scanning system for taking body segment girth measurements: a comparison to ISAK and ISO standards. Journal of Sports Sciences . doi: 10.1080/02640414.2015.1085075
Coelho-e-Silva, M. J., Malina, R. M., Simões, F., Valente-dos-Santos, J., Martins, R. A., Vaz Ronque, E. R., Petroski, E. L., Minderico, C., Silva, A. M., Baptista, F. & Sardinha, L. B. (2013). Determination of thigh volume in youth with anthropometry and DXA: Agreement between estimates. European Journal of Sport Science, 13(5), 527-533. doi:
10.1080/17461391.2013.767945.
Daanen, H. A. M. & Ter Haar, F. B. (2013). 3D whole body scanners revisited. Displays, 34, 270-274. doi:10.1016/j.displa.2013.08.011.
Fischler, M. A. & Bolles, R. C. (1981). Random sample consensus: a paradigm for model fitting with applications to image analysis and automated cartography. Communications of the ACM, 24(6), 381-395.
International Standards Office. (2010). ISO 20685, 3-D Scanning Methodologies for Internationally Compatible Anthropometric Databases. International Standards Office.
Kaulesar Sukul, D.M.K.S., den Hoed, P.T., Johannes, E.J., van Dolder, R. & Benda, E. (1993) "Direct and indirect methods for the quantification of leg volume: comparison between water displacement volumetry, the disk model method and the frustum sign model method, using the correlation coefficient and the limits of agreement." Journal of Biomedical Engineering, 15(6), pp. 477-480. doi:10.1016/0141-5425(93)90062-4.
Kollegger, H., Baumgartner, C., Wöber, C., Oder, W., & Deecke, L. (1992). Spontaneous body sway as a function of sex, age, and vision: posturographic study in 30 healthy adults. European Neurology, 32(5), 253-259. doi:10.1159/000116836.
Ludbrook, J. (1997). Comparing methods of measurement. Clinical and Experimental Pharmacology and Physiology, 24,193-203. doi: 10.1177/096228029900800204.
Ludbrook, J. (2010). Confidence in Altman–Bland plots: A critical review of the method of differences. Clinical and Experimental Pharmacology and Physiology, 37,143-149. doi: 10.1111/j.1440-1681.2009.05288.x.
Maylia, E., Fairclough, J.A., Nokes, L.D.M. & Jones, M.D. (1999). Can thigh girth be
measured accurately? A preliminary investigation. Journal of Sport Rehabilitation, 8, 43–49.
Messier, S. P., Mihalko, S. L., Beavers, D. P., Nicklas, B. J., DeVita, P., Carr, J. J., Hunter, D.J., Williamson, J. D., Bennell, K. L., Guermazi, A., Lyles, M. & Loeser, R.F. (2013). Strength Training for Arthritis Trial (START): design and rationale. BMC musculoskeletal disorders, 14(208).doi: 10.1186/1471-2474-14-208.
Nguyen, A.D. & Shultz, S.J. (2007) Sex differences in clinical measures of lower extremity alignment. Journal of Orthopaedic & Sports Physical Therapy, 37, 389-398.
doi:10.2519/jospt.2007.2487.
Olds, T. & Rogers, M. (2004). 3D anthropometry - application to health and exercise science. Sport Health, 22(3), 21-23. doi: 10.1016/S1440-2440(04)80126-9.
Robinette, K. M. (2013, November). 3D body scanning, past and future. International Conference on 3D Body Scanning Technologies, Long Beach CA, USA.
Robinson, M. & Parkinson, M. B. (June, 2013). Estimating Anthropometry with the Microsoft Kinect. 2nd International Digital Human Modelling Symposium, Ann Arbor, Michigan, USA.
Rønnestad, B.R., Hansen, E.A. & Raastad, T. (2010). Effect of heavy strength training on thigh muscle cross-sectional area, performance determinants, and performance in well-trained cyclists. European Journal of applied Physiology, 108, 965-975. doi:10.1007/s00421-009-1307-z.
Schranz, N., Tomkinson, G., Olds T., Petkov, J. & Hahn A.G. (2012). Is three-dimensional anthropometric analysis as good as traditional anthropometric analysis in predicting junior rowing performance?. Journal of Sports Sciences, 30(12), 1241-1248. doi:
10.1080/02640414.2012.696204.
Spoor, C. W. & Veldpaus, F. E. (1980). Rigid body motion calculated from spatial co-ordinates of markers. Journal of Biomechanics, 13(4), 391-393. doi:10.1016/0021-9290(80)90020-2
Stewart, A.D. (2010). Kinanthropometry and body composition: A natural home for three-dimensional photonic scanning. Journal of Sports Sciences, 28(5), 455-457. doi:
10.1080/02640411003661304.
Stewart, A., Marfell-Jones, M., Olds, T. & de Ridder, H. (2011). International Standards for Anthropometric Assessment. International Society for the Advancement of
Kinanthropometry, Lower Hutt, New Zealand.
Stewart, A. D. & Sutton, L. (2012). Body Composition in Sport, Exercise and Health. Routledge. Abingdon, UK.
Thaler, L., Schütz, A. C., Goodale, M. A., & Gegenfurtner, K. R. (2013). What is the best fixation target? The effect of target shape on stability of fixational eye movements. Vision Research, 76, 31-42.
Tur, E. (1997). Physiology of the skin—differences between women and men. Clinics in dermatology, 15(1), 5-16. doi:10.1016/S0738-081X(96)00105-8
Wu, G. & Cavanagh, P. R. (1995). ISB recommendations for standardization in the reporting of kinematic data. Journal of Biomechanics, 28, 1257–1261.
Tables (with captions, on individual pages)
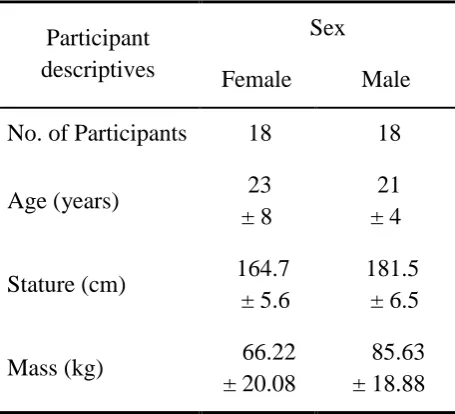
Table 1: Participant descriptives.
Participant descriptives
Sex
Female Male
No. of Participants 18 18
Age (years) 23 ± 8
21 ± 4
Stature (cm) 164.7 ± 5.6
181.5 ± 6.5
Mass (kg) 66.22 ± 20.08
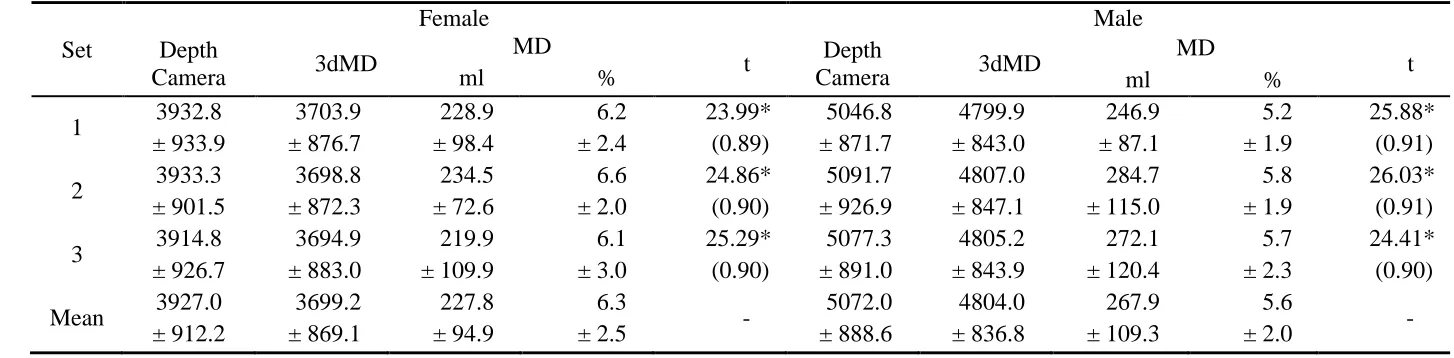
Table 2: The mean thigh volume ± standard deviation (ml) for each method, and the mean difference (MD) ± standard deviation, and statistical
difference (t) and eta squared statistic between methods (*=p<0.05).
Set
Female Male
Depth
Camera 3dMD
MD
t Depth
Camera 3dMD
MD
t
ml % ml %
1 3932.8 ± 933.9 3703.9 ± 876.7 228.9 ± 98.4 6.2 ± 2.4 23.99* (0.89) 5046.8 ± 871.7 4799.9 ± 843.0 246.9 ± 87.1 5.2 ± 1.9 25.88* (0.91)
2 3933.3 ± 901.5 3698.8 ± 872.3 234.5 ± 72.6 6.6 ± 2.0 24.86* (0.90) 5091.7 ± 926.9 4807.0 ± 847.1 284.7 ± 115.0 5.8 ± 1.9 26.03* (0.91)
3 3914.8 ± 926.7 3694.9 ± 883.0 219.9 ± 109.9 6.1 ± 3.0 25.29* (0.90) 5077.3 ± 891.0 4805.2 ± 843.9 272.1 ± 120.4 5.7 ± 2.3 24.41* (0.90)
Mean 3927.0 ± 912.2 3699.2 ± 869.1 227.8 ± 94.9 6.3
± 2.5 -
5072.0 ± 888.6 4804.0 ± 836.8 267.9 ± 109.3 5.6
Table 3: The intra-calibration and inter-calibration TEM (%) for both scanning systems and
sexes.
Method Set
Intra-Scan calibration TEM (%)
Inter-Scan calibration TEM (%)
Female Male Female Male
Kinect
1 0.82 ± 0.22 0.74 ± 0.08 - -
2 0.80 ± 0.11 0.78 ± 0.09 - - 3 0.85 ± 0.19 0.63 ± 0.10 - -
Mean 0.83 ± 0.17 0.72 ± 0.11 1.83 2.13
3dMD
Figure captions
Figure 1: Flow diagram of research design.
Figure 2: Images of the equipment setup.
Figure 3: Calibration device (not to scale) for (a) the Kinect scanning system and (b) the
3dMD scanning system.
Figure 4: Bland Altman plots of the ratio of the thigh volume measurements of a) female
(Correlation R = 0.21, p=0.00. Slope = -0.05, p=0.00. Intercept = 1.24, p= 0.00) and b) male