Tendinous tissue adaptation to explosive-vs.
sustained-contraction strength training
MASSEY, Garry, BALSHAW, Thomas, MADEN-WILKINSON, Tom
<http://orcid.org/0000-0002-6191-045X>, TILLIN, Neale and FOLLAND,
Jonathan
Available from Sheffield Hallam University Research Archive (SHURA) at:
http://shura.shu.ac.uk/22199/
This document is the author deposited version. You are advised to consult the
publisher's version if you wish to cite from it.
Published version
MASSEY, Garry, BALSHAW, Thomas, MADEN-WILKINSON, Tom, TILLIN, Neale
and FOLLAND, Jonathan (2018). Tendinous tissue adaptation to explosive-vs.
sustained-contraction strength training. Frontiers in Physiology, 9 (SEP).
Copyright and re-use policy
See
http://shura.shu.ac.uk/information.html
Tendinous tissue adaptation to explosive- vs. sustained-contraction
1strength training
2Garry J. Massey1,2, Thomas G. Balshaw1,2, Thomas M. Maden-Wilkinson2,3, Neale A. Tillin4, 3
Jonathan P. Folland1,2* 4
1Arthritis research UK Centre for Sport, Exercise and Osteoarthritis, Loughborough University, 5
Leicestershire, UK. 6
2School of Sport, Exercise, and Health Sciences, Loughborough University, Leicestershire, UK 7
3Faculty of Health and Wellbeing, Sheffield Hallam University, South Yorkshire, UK 8
4Department of Life Sciences, University of Roehampton, London, UK. 9
10
* Correspondence: 11
Jonathan P. Folland 12
Keywords: tendon, aponeurosis, stiffness, young’s modulus, muscle, strength training, 14
hypertrophy 15
Manuscript length: 7570 words, nine figures 16
Abstract 17
The effect of different strength training regimes, and in particular training utilizing brief explosive 18
contractions, on tendinous tissue properties is poorly understood. This study compared the efficacy of 19
12 weeks of knee extensor explosive-contraction (ECT; n = 14) vs. sustained-contraction (SCT; n = 20
15) strength training vs. a non-training control (n = 13) to induce changes in patellar tendon and knee 21
extensor tendon-aponeurosis stiffness and size (patellar tendon, vastus-lateralis aponeurosis, 22
quadriceps femoris muscle) in healthy young men. Training involved 40 isometric knee extension 23
contractions (3 times/week): gradually increasing to 75% of maximum voluntary torque (MVT) 24
before holding for 3 s (SCT), or briefly contracting as fast as possible to ~80% maximum voluntary 25
torque (ECT). Changes in patellar tendon stiffness and Young’s modulus, tendon-aponeurosis 26
complex stiffness, as well as quadriceps femoris muscle volume, vastus-lateralis aponeurosis area 27
and patellar tendon cross-sectional area were quantified with ultrasonography, dynamometry, and 28
magnetic resonance imaging. ECT and SCT similarly increased patellar tendon stiffness (20% vs. 29
16%, both p < 0.05 vs. control) and Young’s modulus (22% vs. 16%, both p < 0.05 vs. control). 30
Tendon-aponeurosis complex high-force stiffness increased only after SCT (21%; p <0.02), while 31
ECT resulted in greater overall elongation of the tendon-aponeurosis complex. Quadriceps muscle 32
volume only increased after sustained-contraction training (8%; p = 0.001), with unclear effects of 33
strength training on aponeurosis area. The changes in patellar tendon cross-sectional area after 34
strength training were not appreciably different to control. Our results suggest brief high force muscle 35
contractions can induce increased free tendon stiffness, though SCT is needed to increase tendon-36
38
Introduction 39
The mechanical stiffness (resistance to deformation) of muscle tendinous tissues (aponeurosis and 40
extramuscular free tendon) is integral to the effectiveness of these tissues to transmit skeletal muscle 41
force to the bone and thus generate movement. Stiffer tissues may be protective in injury-related 42
situations, for instance maintaining balance in response to mechanical perturbation (Karamanidis et 43
al., 2008).Moreover, stiffer tendons undergo less strain in response to stress, which reduces their 44
susceptibility to damage (Buchanan and Marsh, 2002). Likewise, stiffer tissues may limit injury risk 45
by providing greater joint stability and by perhaps reducing the loading imposed on passive joint 46
tissue structures (meniscus, cartilage, ligaments), (Lipps et al., 2014). A particular concern is that 47
traumatic joint injuries predispose to degenerative disease (e.g. anterior cruciate ligament) and the 48
increased risk of knee osteoarthritis, which contributes to a reduced quality of life (Salaffi et al., 49
2005). Therefore, increased tendinous tissue stiffness could have functional and clinical implications, 50
thus identifying effective interventions to stimulate tendinous tissue adaptations is warranted. 51
In vivo tendinous tissue stiffness is typically determined from force-elongation relationships acquired 52
by combining tissue elongation visualized via ultrasonography with estimates of tendon force during 53
ramp isometric contractions. In response to a constant rate of increase in contractile force, elongation 54
of the free tendon (between proximal and distal osteotendon junction’s [Kongsgaard et al., 2007; 55
Seynnes et al., 2009]) and elongation of the distal tendon-aponeurosis complex (i.e. aponeurosis and 56
free tendon) via the displacement of a muscle-fascicle aponeurosis intersection (Kubo et al., 2001, 57
2006c; Arampatzis et al., 2007) can be used to determine stiffness of both these structures. During 58
muscle contraction the free tendon experiences tensile loading and positive longitudinal strain, 59
whereas the radial expansion of muscle fascicles during force-generation and shortening causes the 60
aponeurosis to also undergo transverse elongation and positive strain (Azizi and Roberts, 2009; 61
Raiteri et al., 2016). The alternative strain behavior of the free tendon and aponeurosis may lead to 62
differential adaptations in the separate free tendon and combined tendon-aponeurosis complex in 63
response to training. However very few studies have made simultaneous measurements of the 64
mechanical properties of both structures (Kubo et al., 2006a, 2006 c, 2009), therefore the 65
comparative changes in free tendon and tendon-aponeurosis complex stiffness after exercise training 66
remains opaque. 67
The mechanical stiffness of the tendon-aponeurosis complex has been repeatedly found to increase 68
following strength training with sustained contractions at high loads (≥2 s duration with loads of 69
>70% maximum: Bohm et al., 2015; Wiesinger et al., 2015), e.g. 16-54% after 12-14 weeks (Kubo et 70
al., 2001, 2006b; Arampatzis et al., 2007). Interestingly, two recent studies reported that strength 71
training with brief explosive-contractions (<1 s) characterized by maximum/near maximum rate of 72
force development up to a high level of force produced increases in stiffness after merely four (34%; 73
Tillin et al., 2012) and six weeks (62%; Burgess et al., 2007) of training. These preliminary results 74
suggest that explosive-contraction strength training (ECT) may provide a potent stimulus for 75
increasing tendon-aponeurosis complex stiffness. Furthermore due to the brief nature of the 76
contractions (Balshaw et al., 2016), ECT is a relatively non-fatiguing training regime that may be 77
preferable for older adults and patient groups (e.g. mobility, limited, osteoarthritis, tendinopathy: 78
Reid et al., 2015) and thus facilitate higher levels of adherence. However, a comprehensive longer-79
term investigation is required to validate the efficacy of ECT to increase tissue stiffness in 80
Changes in tendon-aponeurosis complex and free tendon stiffness after strength training may depend 82
upon the increase in the size of these tissues. Muscle hypertrophy is a well-recognized characteristic 83
response to conventional strength training regimes(Folland and Williams, 2007) that is suggested to 84
be coincident with an increase in aponeurosis size (Wakahara et al., 2015), but longitudinal changes 85
in aponeurosis size are largely unknown. A solitary report documented a 1.9% increase in vastus 86
lateralis aponeurosis width to accompany a 10.7% increase in quadriceps muscle size after 12 weeks 87
of SCT (Wakahara et al., 2015). Free tendon hypertrophy after SCT has received much more 88
attention, but the evidence remains equivocal. While some studies utilizing magnetic resonance 89
imaging have reported modest increases in free tendon cross-sectional area (~3-6%: Kongsgaard et 90
al., 2007; Seynnes et al., 2009; Arampatzis et al., 2007; Bohm et al., 2017) that may be region 91
specific, others found no change (Arampatzis et al., 2010; Kubo et al., 2012; Bloomquist et al., 92
2013). The responses of muscle, aponeurosis and tendon size to ECT are largely unknown. Given the 93
marginal changes in free tendon size after SCT, the increases in free tendon stiffness (e.g.15-65%: 94
Reeves et al., 2003; Kongsgaard et al., 2007; Seynnes et al., 2009; Malliaras et al., 2013; McMahon 95
et al., 2013) have predominantly been attributed to the nearly parallel increases in free tendon 96
Young’s modulus (stiffness relative to tendon dimensions, i.e. material stiffness), although the 97
changes in free tendon modulus after ECT have yet to be documented. 98
The aim of the present study was to comprehensively compare the mechanical and morphological 99
adaptations of the tendinous tissues, both the patellar tendon and tendon-aponeurosis complex, to 12 100
weeks ECT vs. SCT vs. a non-training control group. The mechanical properties examined were 101
patellar tendon stiffness and Young’s modulus, as well as tendon-aponeurosis complex stiffness. 102
Morphological measures investigated were quadriceps femoris muscle volume, vastus lateralis 103
aponeurosis area and patellar tendon cross-sectional area. As both training regimes involved high 104
force production, we hypothesized that ECT and SCT would be similarly effective training 105
interventions to increase tendinous tissue stiffness. 106
Materials and Method 107
Participants and Ethical Approval
108
Forty-two young, healthy, asymptomatic, males who had not completed lower body-strength training 109
for >18 months and were not involved in systematic physical training were randomly assigned to 110
ECT (n = 14), SCT (n = 15) or control (CON, n = 13) groups. Baseline recreational physical activity 111
level was assessed with the International Physical Activity Questionnaire (IPAQ, short format). Each 112
participant provided written informed consent prior to completing this study, which was approved by 113
the Loughborough University Ethical advisory committee and conformed to the principles of the 114
Declaration of Helsinki. 115
Experimental Design
116
Participants visited the laboratory for a familiarization session that included measurement ofmuscle 117
strength and body mass to facilitate group allocation, as well as practice isometricramp contractions. 118
Thereafter, two duplicate laboratory measurement sessions were conducted both pre (sessions 7-10 119
days apart prior to the first training session) and post (2-3and 4-6 days after the last training session). 120
Magnetic resonance imaging (MRI) scans of thethigh and knee were conducted pre (5 days prior to 121
the start of the first training session) andpost (2-3 days after the final training session) to measure 122
knee extensor tissue size (quadriceps muscle volume, vastus lateralis aponeurosis area, patellar 123
wereperformed with the same isometric apparatus and the same joint angle configuration (knee and 125
hip angles of 115° and 126° [180° = full extension]).Training for ECT and SCT group’s involved 126
unilateral isometric contractions of both legsthree times a week for 12 weeks (36 sessions in total), 127
whereas CON participants attended only the measurement sessions and maintained their habitual 128
activity. All participants were instructed to maintain their habitual physical activity and diet 129
throughout the study, which was verified by informal questioning during post measurement. 130
Measurement sessions involved a series of contractions of the dominant (preferred kicking)leg in the 131
following order: maximum voluntary contraction (MVCs to establish maximum voluntary torque 132
[MVT]); ramp voluntary contractions of the knee extensors to establish tendinous tissue properties, 133
and knee flexor MVCs. Knee joint torque was recordedthroughout contractions. Knee flexor surface 134
electromyography was recorded during knee flexor MVCs, as well as during knee extensor ramp 135
contractions to account for antagonist co-activation in the estimate of tendon force in knee extensor 136
ramp contractions. Ultrasound images of the vastus lateralis muscle and patellar tendon were 137
recorded to assess tissueelongation during the ramp contractions in order to derive force-elongation 138
relationships (todetermine stiffness) of the distal tendon-aponeurosis complex and patellar tendon, as 139
well as stress-strain relationships for the patellar tendon (to determine Young’s modulus). 140
Measurement sessions were at a consistent time of day and started between 12:00-19:00hours. 141
Training
142
After a brief warm-up of sub-maximum contractions of both legs, participants completed four sets of 143
ten unilateral isometric knee-extensor contractions of each leg with sets alternating between legs. 144
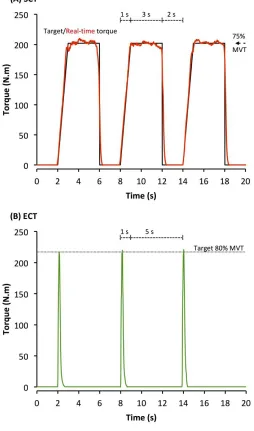
Each set took 60 s with 2 min between successive sets on the same leg. SCT involved sustained 145
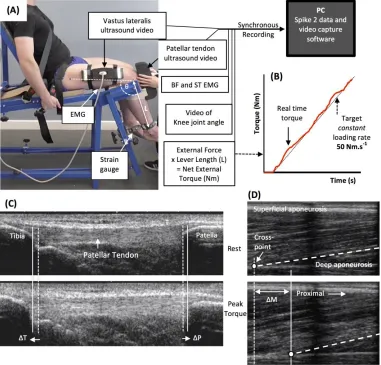
contractions at 75%MVT, with 2 s rest between contractions. In order tocontrol the rate of torque 146
development (RTD) these participants were presented with a target torque trace 2 s before every 147
contraction and instructed to match this target, which graduallyincreased torque linearly from rest to 148
75%MVT over 1 s before holding a plateau at75%MVT for a further 3 s (Figure 1A). ECT involved 149
maximum/near maximum RTD contractions withparticipants instructed to perform each contraction 150
“as fast and hard as possible” then relax for 5 s between repetitions (Figure 1B). When performing 151
ECT the focus was on maximizing RTD, which means participants cannot precisely control the peak 152
torque achieved. Therefore participants were instructed to simply achieve ~80%MVT as quickly as 153
possible to ensure that peak torque was at least practically equivalent to SCT. A computer monitor 154
displayed RTD (10 ms timeepoch) to provide biofeedback of explosive performance, with a cursor 155
indicating the highest peak RTD achieved throughout the session. Participants were encouraged to 156
achieve a higherpeak RTD with each subsequent contraction. The torque-time curve was also shown: 157
with a horizontal cursor at 80%MVT to encourage sufficiently forceful contractions, and on a 158
sensitive scale baseline torque was highlighted in order to observe and provide feedback to 159
participants to correctly perform the contractions by avoiding any pre-tension orcountermovement. 160
All training participants (ECT and SCT) performed three isometric kneeextensor MVCs at the start 161
of each training week in order to re-establish MVT and prescribetraining torques. Torque data from 162
each repetition of all training participants in the first session of weeks 1, 6 and 12 was analyzed and 163
loading indices were averaged across the three sessions: SCT vs. ECT, peak loading magnitude (81 164
vs. 75% MVT), peak loading rate (8.9 vs. 1.4 %MVT.s-1), impulse (28212 vs. 3025 Nm.s). 165
Knee Extension and Flexion Maximum Voluntary Contractions
166
Following a brief warm-up (3 s contractions at 50% [x3], 75% [205 x3] and 90% [x1] ofperceived 167
maximum), participants performed 3-4 MVCs and were instructed to either ‘pushas hard as possible’ 168
cursor indicating the greatest torque obtained within the session wasdisplayed for biofeedback and 170
verbal encouragement was provided during all MVCs. The highest instantaneous torque recorded 171
during any MVC was defined as MVT. 172
Torque Measurement
173
Measurement and training sessions were completed in the same custom-made isometric strength-174
testing chair with knee and hip angles of 115° and 126° (180° = full extension), respectively. 175
Adjustable straps were tightly fastened across the pelvis and shoulders to prevent extraneous 176
movement. An ankle strap (35 mm width reinforced canvas webbing) was placed ~15% of tibial 177
length (distance from lateral malleolus to knee joint space) above the medial malleolus, and 178
positioned perpendicular to the tibia and in series with a calibrated S-Beam strain gauge (Force 179
Logic, Berkshire, UK). The analogue force signal was amplified (x370; A50 amplifier, Force Logic 180
UK) and sampled at 2,000 Hz using an A/D converter (Micro 1401; CED, Cambridge, UK) and 181
recorded with Spike 2 computer software (CED). In offline analysis, force signals were low-pass 182
filtered at 500 Hz using a fourth order zero-lagButterworth filter, gravity corrected by subtracting 183
baseline force, and multiplied by lever length, the distance from the knee joint space to the center of 184
the ankle strap, to calculatetorque values. 185
Knee Flexor Electromyography (EMG)
186
Surface EMG recordings over the biceps femoris and semitendinosus muscles were made with a 187
wireless EMG system (Trigno; Delsys Inc, Boston, MA) during knee flexor MVCs and knee extensor 188
ramp contractions. Following preparation of the skin (shaving, abrading and cleansing with alcohol) 189
single differential Trigno standard EMG sensors (1 cm inter electrode distance; Delsys Inc, Boston, 190
Massachusetts) were attached over each muscle using adhesive interfaces. Sensors were positioned 191
parallel to the presumed frontal plane orientation of the underlying muscle fibres at 45% of thigh 192
length (distance from the greater trochanter to the lateral knee joint space) measured from the 193
popliteal crease. EMG signals were amplified at source (x300; 20-450 Hz bandwidth) before further 194
amplification (overall effective gain x 909) and sampled at 2000 Hz via the same A/D converter and 195
computer software as the force signal, to enable data synchronization. In offline analysis, EMG 196
signals were corrected for the 48 ms delay inherent to the Trigno EMG system. During knee flexor 197
MVCs EMG amplitude was calculated as the root mean square (RMS) of the filtered EMGsignal of 198
the biceps femoris and semitendinosus over a 500 ms epoch at knee flexion MVT(250 ms either side 199
of instantaneous peak torque) and averaged across the two muscles togive knee flexor EMGMAX. 200
MRI measurement of Muscle Tendon Unit Morphology and Moment Arm
201
Participants reported to the MRI scanner (1.5 T Signa HDxt, GE) having not engaged in strenuous 202
activity in the prior 36 hours, and were instructed to arrive in a relaxed state havingeaten and drunk 203
normally, and sat quietly for 15 min prior to their MRI scans. T1-weighted MR images of the 204
dominant leg (thigh and knee) were acquired in the supine position at a knee angle of 163° due to 205
constraints in knee coil size (180° = full extension) and analyzed using OsiriX software(Version 6.0, 206
Pixmeo, Geneva, Switzerland). Using a receiver 8-channel whole body coil, axial images (image 207
matrix 512 x 512, field of view 260 x 260 mm, pixel size 0.508 x 0.508mm, slice thickness 5 mm, 208
inter-slice gap 0 mm) were acquired from the anterior superior iliac spine to the knee joint space in 209
two overlapping blocks. Oil filled capsules placed on thelateral side of the thigh allowed alignment 210
of the blocks during analysis. The anatomical cross-sectional area of each of the four constituent 211
was manually outlined in every third image (i.e. every 1.5 cm) starting from the mostproximal image 213
in which the muscle was visible. A cubic spline curve was fitted to the plot of anatomical cross-214
sectional area vs. femur length for each constituent muscle, and the muscle volume calculated as the 215
area under the spline curve (GraphPad Prism 6, GraphPad Software, Inc.) Totalquadriceps femoris 216
muscle volume was given by the sum of the constituent muscle volumes. 217
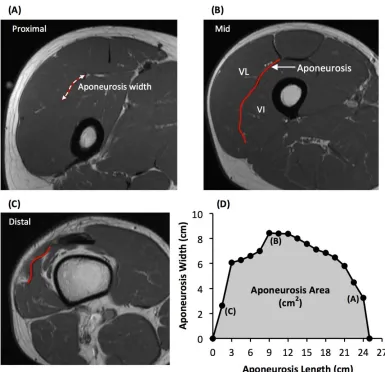
As previouslydescribed (Wakahara et al., 2015), the deep aponeurosis of the vastus lateralis muscle 218
was defined as the visible dark black segment between the vastus lateralis and vastus intermedius 219
muscles in the axial thigh MRIimages (Figure 2). The transverse length (cm) of theblack segment 220
was defined as vastus lateralis aponeurosis width, and was traced manually on every third image (i.e. 221
every 1.5 cm), starting in the mostdistal image where the aponeurosis was visible. From the images 222
analysed, the measures of aponeurosis width were plotted against femur length. A cubic spline curve 223
was fitted to the plot of VL aponeurosis width vs. femur length and the vastus lateralis aponeurosis 224
area was calculated as the area under the spline curve (Figure 2). 225
Immediately after thigh imaging, a lower extremity knee coil was used to acquire axial (image matrix 226
512 x 512, field of view 160 x 160 mm, pixel size 0.313 x 0.313 mm, slice thickness 2 mm, inter-227
slice gap 0 mm) and sagittal images (image matrix 512 x 512, field of view 160 x 160 mm, pixel size 228
0.313 x 0.313 mm, slice thickness 2 mm, inter-273 slice gap = 0 mm) of the knee joint. Contiguous 229
axial images spanned patellar tendon length, which prior to analysis were reconstructed with an 230
orientation perpendicular to the patellar tendon via the mutli-plane view feature of Osirix. Images 231
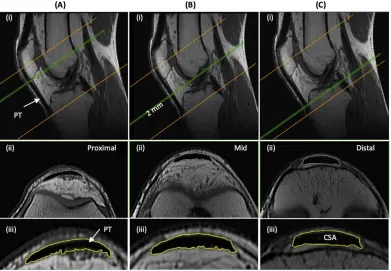
spanned from 2 cm superior to the patella apex to 2 cm inferior to the tendon tibial insertion. Patellar 232
tendon cross-sectional area (CSA) was measured on each contiguous image along the tendon’s length 233
(first image where the patellar was no longer visible to the last image before the tibial insertion). 234
Images, viewed in greyscale, were sharpened and the perimeter manually outlined (Figure 3). Mean 235
tendon CSA (mm2) was defined by the average of all measured analyzed images. Patellar tendon 236
moment arm length was estimated from sagittal plane images, as the perpendicular distance from the 237
patellar tendon to the midpoint of the distance between the tibio-femoral contact points in the lateral 238
and medial femoral condyles (Blazevich et al., 2009; Seynnes et al., 2009). 239
Ramp Contractions for Determination of Tendinous Tissue Stiffness
240
Tendinous tissue stiffness was derived from synchronous recordings of torque and tissue elongation 241
(corrected for passive tissue displacement via video recording of knee joint changes; see below) 242
during isometric knee extension ramp contractions (experimental set-up: Figure 3). Participants 243
completed two sub-maximum practice ramp contractions prior to five maximum attempts with 90 s 244
of rest between contractions. Prior to each ramp contraction participants were shown a target torque-245
time trace on a computer monitor that increased at a constant gradient (50 Nm.s-1 loading rate) from 246
zero up to MVT. They were instructed to match the target trace as closely as possible for as long as 247
possible (i.e. up to MVT), and then relax promptly. Real-time torque was displayed over the target 248
rising torque-time trace for feedback. The preceding knee extensor MVCs and sub-maximum 249
contractions were considered sufficient to elicit tissue preconditioning (Seynnes et al., 2014). The 250
three most suitable ramp contractions, according to highest peak torque, the closeness to the target 251
loading rate, as well the clarity of the ultrasound images of both the patellar tendon and vastus 252
lateralis muscle (clearly visible osteotendon attachments and fascicle-aponeurosis intersection), were 253
analyzed and measurements averaged across these three contractions. 254
Measurement of Tendinous Tissue Elongation
Two ultrasound machines and a camera were interfaced with the computer collecting torque data in 256
Spike 2, and video images were synchronously recorded with torque (and EMG) using Spike 2 video 257
capture at 25Hz. Video images were captured to obtain tissue (tendon-aponeurosis and patellar 258
tendon) and knee joint displacements during ramp contractions, which were measured in off-line 259
analysis by tracking specific anatomical landmarks frame-by-frame in public domain semi-automatic 260
video analysis software: Tracker, version 4.86. 261
An ultrasound linear arrayprobe (60 mm, B-mode, 7.5 MHz scanning frequency, 39 Hz sampling 262
frequency, ToshibaPower Vision 6000, SSA-370A) was fitted into a custom made high-density foam 263
cast that was strapped to the lateral aspect of the thigh with the mid-point of the probe positioned at 264
~50% thigh length. The probe was aligned so the fascicles inserting into the vastus lateralis muscle 265
deep aponeurosis could be visualized at rest and during contraction. An echo absorptive marker 266
(multiple layers of transpore medical tape) was placed beneath the ultrasound probe to provide a 267
reference for any probe movement over the skin. Vastus lateralis muscle fascicle deep aponeurosis 268
cross-point displacement relative to the skin marker provided a measure of distal tendon-aponeurosis 269
complex elongation (Figure 4). To enable correction of aponeurosis displacement due to joint angle 270
changes during ramp contractions, individual ratios of aponeurosis displacement relative to joint 271
angular displacement (mm/°) were obtained from passive movements (i.e. plotting the aponeurosis 272
displacement-knee joint angle relationship). The mean ± standard deviation for this ratio was 0.37 ± 273
0.09 mm/°. Passive movements were conducted prior to the ramp contractions. Participants were 274
instructed to completely relax as their knee was moved through 90 to 130°. During passive 275
movements and ramp contractions, knee joint angle (angle between visible markers placed on the 276
greater trochanter, lateral knee joint space and lateral malleolus) was derived from sagittal plane 277
video recorded using a camera mounted on a tripod positioned (1.5 m) perpendicular to the strength-278
testing chair. During ramp contractions knee angle changes were 3.1 ± 1.2°. 279
A second ultrasound linear array probe (92 mm EUP-L53L, B-mode, 10 MHz scanning frequency, 32 280
Hz sampling frequency; Hitachi EUB-8500) was fitted into a custom made high-density foam cast 281
that was held firmly over the anterior aspect of the knee with the probe aligned longitudinal to the 282
patellar tendon such that the patella apex and insertion of the posterior tendon fibers at the tibia could 283
be visualized at rest and throughout the contraction. Patellar tendon elongation was determined by the 284
longitudinal displacement of both the patella apex and the tendon tibial insertion (Figure 4). Under 285
passive conditions, patellar tendon elongation was deemed negligible. 286
Calculation of Patellar Tendon Force
287
Patellar tendon force was calculated by dividing total knee extensor torque by the patellartendon 288
moment arm length. Direct measures of moment arm were acquired at rest from MRI images as 289
indicated above (MRI measurement). Due to constraints in the size of the knee coil,sagittal images 290
were acquired in an extended knee position (~163°: 180° = full extension). Moment arm length for 291
any specific knee angle measured at rest or during ramp contraction was estimated from previously 292
published data fitted with a quadratic function (Kellis and Baltzopoulos, 1999) scaled to each 293
participant’s measured moment arm length at 163°. Total knee extensor torque was given by 294
summing external net knee extension torque and the estimated knee flexor co-contraction torque. 295
Antagonist knee flexor torque was estimated by expressing the average knee flexor EMG amplitude 296
(RMS 50 ms moving window) during ramp contractions relative to the knee flexor EMGMAX, and 297
then multiplying by the knee flexor MVT (assuming a linear relationship between EMG amplitude 298
and torque). During analysis, torque and EMG amplitude were down sampled to 25 Hz to match the 299
Calculation of Tendinous Tissue Stiffness and Patellar Tendon Young’s Modulus
301
For each of the three best ramp contractions analyzed, both patellar tendon and distal tendon-302
aponeurosis complex (corrected for passive tissue displacement due to knee joint angle displacement) 303
and during elongation contraction were separately plotted against total tendon force (corrected for 304
antagonist force). Patellar tendon and tendon-aponeurosis complex and force-elongation plots were 305
fitted with a second-order polynomial. To standardize the tendon force level, both pre and post-306
training, tendon-aponeurosis complex and patellar tendon stiffness for each individual was calculated 307
as the slope of the respective force-elongation curve over an absolute tendon force range that equated 308
to 70-80% of pre-training MVT. 70-80% pre-training MVT corresponded to the highest common 309
torque range that all participants could individually achieve during pre-training measurements 310
sessions Patellar tendon Young’s modulus was calculated for each individual as the slope of the 311
stress-strain curve derived over a stress range that corresponded to 70-80% of pre-training MVT. 312
Stiffness/modulus measures derived over the highest attainable force/stress range are recommended 313
and deemed suitably reliable (Hansen et al., 2006; Kösters et al., 2014; Seynnes et al., 2014). Tendon 314
stress was obtained by dividing tendon force by mean patellar tendon CSA. Patellar tendon strain was 315
the percentage tendon displacement relative to the resting tendon length. Resting patellar tendon 316
length was defined as the distance between the patella apex and tibial insertion as measured prior to 317
the ramp contractions. The measures of patellar tendon and tendon-aponeurosis complex stiffness, 318
and the patellar tendon modulus derived from each of the three analyzed ramps were averaged to give 319
a representative value for each individual. 320
Statistical Analysis
321
The reproducibility of measurements (all muscle and tendinous tissue variables) over the 12 week 322
intervention period was calculated for CON (pre vs. post) as within-participant coefficient of 323
variation (CVw, %; [SD/mean) x 100]). Muscle and tendon variables measuredduring the duplicate 324
laboratory sessions were averaged to produce criterion pre and post values for statistical analysis. 325
Data are reported as mean ± standard deviation (SD). Statisticalsignificance tests were conducted 326
using SPSS Version 20.0 (IBM Corp., Armonk, NY), and significance was accepted at p <0.05. 327
0.05<p<0.1 was considered a tendency. One-way analysis of variance (ANOVA) tests were 328
conducted on all pre-training variables todetermine whether baseline differences existed between 329
groups. The primary comparison of training effects involved between group comparisons to the 330
intervention, and assessment of repeated measures analysisof variance (ANCOVA; group [ECT vs. 331
SCT vs. CON] x time [pre vs. post]) withcorresponding pre-training values used as covariates. When 332
group x time interaction effects displayed p <0.05, least significant difference (LSD) post-hoc 333
pairwise comparisons (with Holm-Bonferroni adjustment applied to the p-values [LSDHB]) of 334
absolute changes (pre topost) between groups (i.e. ECT vs. SCT, ECT vs. CON, SCT vs. CON) were 335
performed to delineate specific between-group differences. In addition to the between group 336
comparisons, secondary within-group changes (absolute values) wereevaluated with paired t-tests. 337
Effect size (ES: specifically Hedges g, incorporating correctionfor small sample bias; Lakens, 2013) 338
was calculated for between-group comparisons and within groupchanges. 339
Results 340
Group Characteristics at Baseline
341
At baseline, no differences (p ≥ 0.579) were observed between groups for age (ECT 25 ± 2; SCT 25 342
10; SCT 70 ± 8; CON 72 ± 7 kg) or habitual physical activity level (ECT1971 ± 1077; SCT 2084 ± 344
1256; CON 2179 ± 1588 metabolic equivalent minutes per week). Likewise, there were no 345
differences in MVT (p = 0.304), tendon-aponeurosis complex stiffness (p = 0.328),patellar tendon 346
stiffness (p = 0.215), Young’s modulus (p = 0.184), quadriceps muscle volume (p = 0.508), and 347
vastus lateralis aponeurosis area (p = 0.815), though a tendency existed for patellar tendon mean 348
cross-sectional area (p = 0.073). 349
Reproducibility of Measurements
350
The reproducibility of pre and post measures for the CON group over the 12-week intervention 351
period was excellent for maximum voluntary torque (CVw 2.9%) and tendon-aponeurosis complex 352
stiffness (3.9%), and very good for patellar tendon stiffness (7.2%) and Young’s modulus (6.8%). 353
Excellent reproducibility was also observed for quadriceps muscle volume (1.7%), vastus lateralis 354
aponeurosis area (2.7%) and patellar tendon mean cross-sectional area (2.9%). 355
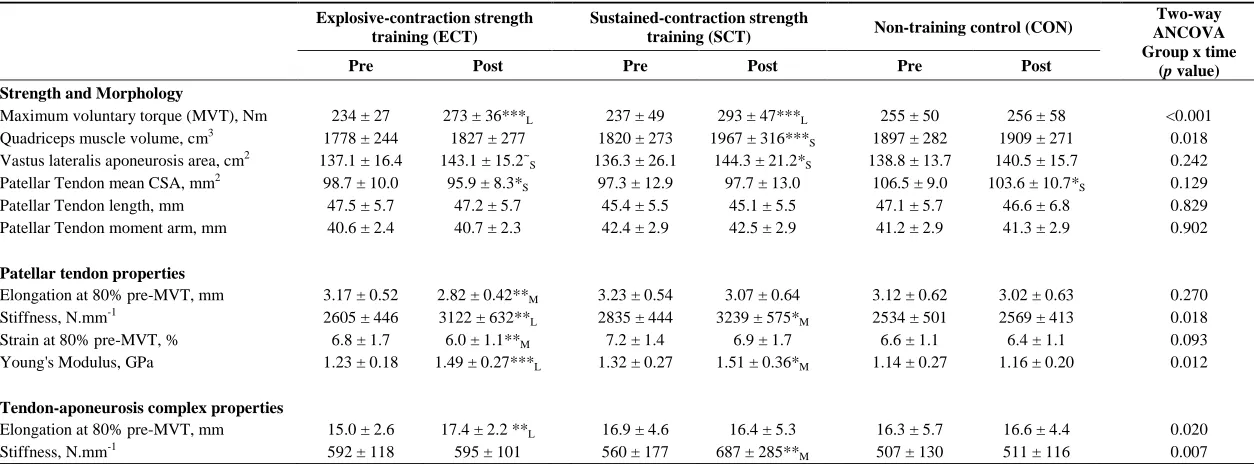
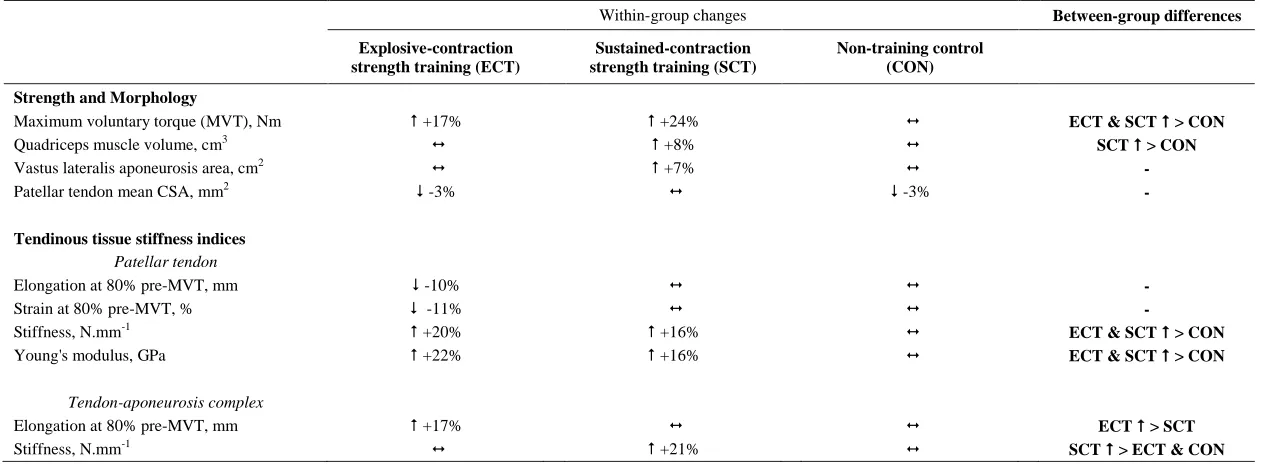
Strength and Muscle-Tendon Morphology (Tables 1 and 2, Figure 5)
356
Considering within-group changes, MVT increased after ECT (paired t-test p <0.001, ES = 1.15) and 357
SCT (p < 0.001, ES = 1.11) but not following CON (p = 0.868, ES = 0.01). Between group 358
comparisons showed the absolute increase in MVT was greater thanCON for both ECT (LSDHBp < 359
0.001, ES = 1.90) and SCT (LSDHB p < 0.001, ES = 2.64),and 45% larger after SCT than ECT 360
(LSDHBp = 0.032, ES = 0.75) 361
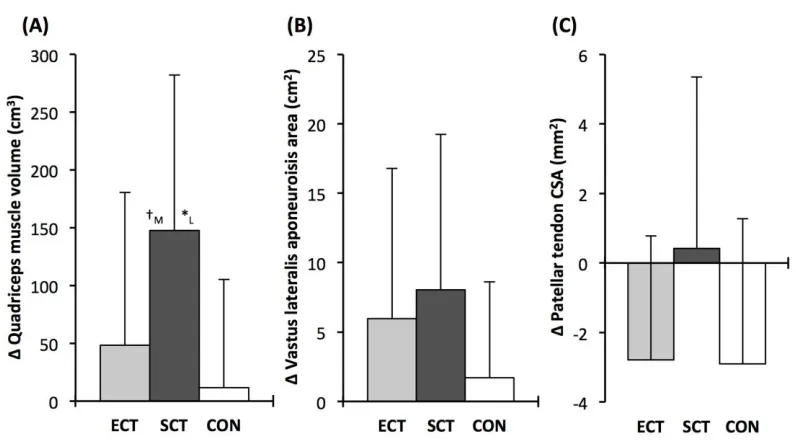
Quadriceps muscle volume increased after SCT (paired t-test p = 0.001, ES = 0.47) but not following 362
ECT (p = 0.195, ES = 0.17) or CON (p = 0.661, ES = 0.04). There was a group x time effect for 363
quadriceps muscle volume (Table 1), with the absolute change (Figure 5A) after SCT being greater 364
than CON (LSDHBp = 0.021, ES = 1.12), and a tendency to be different to ECT (p = 0.074, ES = 365
0.72). Absolute changes in quadriceps muscle volume after ECT were not greater than CON (LSDHB 366
p = 0.479, ES = 0.31). 367
Vastus lateralis aponeurosis area increased after SCT (paired t-test p = 0.015, ES = 0.32), and also 368
tended to increase after ECT (p = 0.060, ES = 0.35), while remaining unchanged in CON (p = 0.408, 369
ES = 0.11). However, there was no group x time effect (Table 1; Figure 5B). 370
Patellar tendon mean cross-sectional area showed a small decrease in CON (paired t-test p = 0.028, 371
ES = 0.27), and after ECT (p = 0.012, ES = 0.29), but was unchanged following SCT (p = 0.746, ES 372
= 0.03). However, there was no group x time effect (Table 1; Figure 5C). 373
Tendinous Tissue Mechanical Properties (Tables 1 and 2)
374
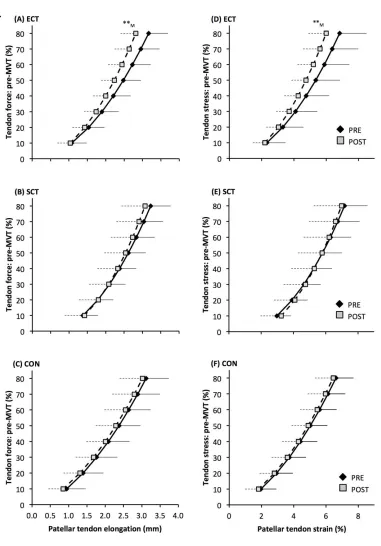
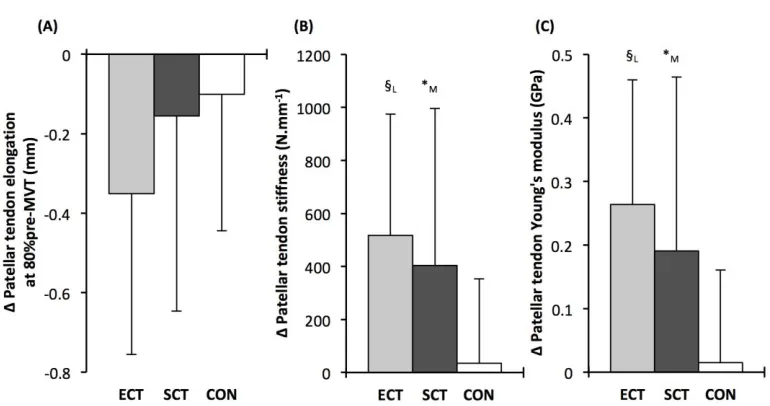
Patellar tendon elongation at 80% pre-training MVT was less after ECT (paired t-test p = 0.011, ES = 375
0.75, but was unchanged after SCT (p = 0.246, ES = 0.24) or CON (p = 0.331, ES = 0.15), (Figure 6), 376
and no group x time effect was observed (Table 1). Patellar tendon strain (relative elongation) at 80% 377
pre-training MVT was also less after ECT (paired t-test p = 0.010, ES = 0.54), but was unchanged 378
after SCT (p = 0.542, ES = 0.11) or CON (p = 0.263, ES = 0.15), (Figure 6), and there was no group 379
x time effect (Table 1). 380
Patellar tendon stiffness increased after both ECT (paired t-test p = 0.002, ES = 0.88) and SCT (p = 381
effect (Table 1), and absolute changes (Figure 7) in both ECT (LSDHBp = 0.030, ES = 1.18) and SCT 383
(LSDHBp = 0.034, ES = 0.73) were greater than CON. ECT and SCT had a similar effect on patellar 384
tendon stiffness (LSDHBp = 0.500, ES = 0.29). 385
Patellar tendon Young’s modulus increased after ECT (paired t-test p = 0.004, ES = 1.05), and SCT 386
(p = 0.017, ES = 0.57), and was unchanged in CON (p = 0.637, ES = 0.05), resulting in a group x 387
time effect (Table 1). Absolute changes (Figure 7) were greater in both ECT (LSDHBp = 0.012, ES = 388
1.38) and SCT (LSDHBp = 0.042, ES = 0.75) than CON. Positive effects of ECT and SCT on tendon 389
Young’s modulus were similar (LSDHBp = 0.830, ES = 0.21). 390
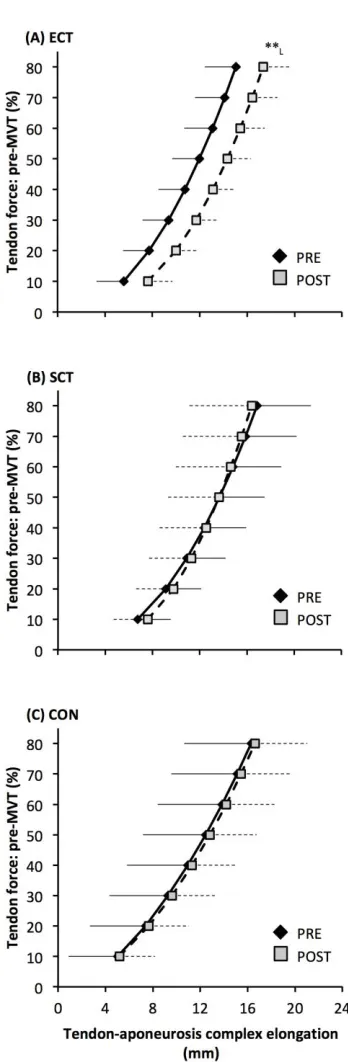
Tendon-aponeurosis complex elongation at 80% pre-training MVT increased after ECT (paired t-test 391
p = 0.003, ES = 0.89) but was unchanged after SCT (p = 0.428, ES = 0.09) and CON (p = 0.637, ES 392
= 0.06), (Figure 8). There was a group x time effect (Table 1), with increases in ECT being greater 393
than SCT (LSDHBp = 0.021, ES = 1.23) and tended to be greater than CON (LSDHBp = 0.098, ES = 394
0.80) (Figure 9). 395
Tendon-aponeurosis complex stiffness increased after SCT (paired t-test p = 0.005, ES = 0.50) but 396
was unchanged after ECT (p = 0.938, ES = 0.02) and CON (p = 0.695, ES = 0.03,), with a group x 397
time effect (Table 1). Absolute changes in tendon-aponeurosis complex stiffness (Figure 9) following 398
SCT were greater than ECT (LSDHBp = 0.015, ES = 0.94) and CON (LSDHBp = 0.016, ES = 1.12), 399
while ECT vs. CON changes were alike (LSDHBp = 0.846 ES = 0.02). 400
Discussion 401
The present randomized controlled study compared the efficacy of 12 weeks of explosive- (ECT) vs. 402
sustained- (SCT) contraction strength training to increase patellar tendon stiffness and Young’s 403
modulus, knee extensor tendon-aponeurosis complex stiffness as well as elicit tissue (muscle, 404
aponeurosis, free tendon) hypertrophy. ECT and SCT similarly increased patellar tendon stiffness 405
and modulus (20 and 22% vs. 16 and 16%), whereas only SCT increased tendon-aponeurosis 406
complex stiffness (21%), and quadriceps muscle volume (8%). There was a marginal effect of SCT 407
on aponeurosis area (within-group increase, but no between group differences), while patellar tendon 408
hypertrophy was not clearly apparent after either SCT or ECT. 409
410
SCT increased high-force free tendon stiffness, as has been commonly reported in response to 411
strength training regimes utilizing sustained (> 2 s) high force (>70% maximum) dynamic and/or 412
isometric muscle contractions (e.g. et al., 2009; Malliaras et al., 2013; McMahon et al., 2013). A 413
more original finding was increase in free tendon stiffness after ECT, as this had not been 414
investigated in previous studies (Burgess et al., 2007; Tillin et al., 2012). Intriguingly, ECT (+20%) 415
was similarly effective as SCT (+16%) for stimulating increases in free tendon high-force stiffness, 416
and both increased by more than CON. The greater patellar tendon stiffness after ECT and SCT can 417
be explained by the parallel increase in patellar tendon Young’s modulus in response to training. This 418
adaptation to SCT is consistent with multiple previous studies (Seynnes et al., 2009; Malliaras et al., 419
2013; McMahon et al., 2013) although the similar effect of ECT on free tendon Young’s modulus we 420
have observed has not been investigated before. Our findings support the view that the changes in 421
free tendon Young’s modulus is the primary mechanism for the increased in tendon stiffness during 422
the initial months of strength training (Wiesinger et al., 2015). Increased Young’s modulus after SCT 423
and ECT may be due to changes to the patellar tendon intrinsic collagenous structure and/or 424
biochemical composition e.g. increased collagen content, cross-link density, fibril size (Buchanan 425
intrinsic structure/composition after strength training in healthy individuals are lacking, and therefore 427
further investigations to uncover the mechanism(s) for the increases in Young’s modulus are 428
required. 429
430
The similar increases in patellar tendon Young’s modulus after ECT and SCT may be attributable to 431
their similar loading magnitude (%MVT). It is recognized that in vitro mechanotransduction 432
responses of tenocytes (resident tendon cells responsible for extracellular matrix remodeling) are 433
highly dependent on strain magnitude (Lavagnino et al., 2008) as reflected by in vivo studies showing 434
increased free tendon stiffness and modulus only after high vs. low force strength training 435
(Kongsgaard et al., 2007; Arampatzis et al., 2010). The similar changes to free tendon Young’s 436
modulus after ECT and SCT despite the previously documented (Balshaw et al., 2016) differences in 437
time related loading parameters with these training regimes (loading rate, ECT 6-fold >SCT; loading 438
duration SCT 13-fold>ECT), strongly suggests that loading magnitude, irrespective of duration or 439
rate, is the primary mechanostimulatory parameter for the free tendon. 440
441
In the present study, the increases in patellar tendon stiffness in ECT and SCT were independent of 442
free tendon hypertrophy. Whilst it is curious there was a small within-group decrease in mean 443
patellar tendon cross-sectional area in CON, this possible negative bias in post-training measures had 444
only a small effect size (0.27). Moreover, the primary between group comparisons, that is the most 445
robust indicator of training effects in comparison to CON, revealed no between group differences. 446
Several earlier studies have similarly reported no change in free tendon cross-sectional area after a 447
comparable period of SCT (Arampatzis et al., 2010; Bloomquist et al., 2013; Kubo et al., 2012). 448
However, others have reported small increases in free tendon cross-sectional area following similar 449
SCT regimes (~3-6%: Kongsgaard et al., 2007; Seynnes et al., 2009; Arampatzis et al., 2007; Bohm 450
et al., 2017). With regards to our patellar tendon mean cross-sectional area data it is unlikely that our 451
measurements simply failed to detect a change. Pre and post free tendon cross-sectional area analysis 452
was performed by a single investigator blinded to the group allocation, and involved precise 453
measurements of tendon CSA along the full length of the tendon from high resolution MRI (2 mm 454
slice thickness, pixel size 0.313 x 0.313 mm), with excellent reproducibility even over the duration of 455
the intervention (~3% pre-post CVw in CON). It is possible the magnitude of tendon hypertrophy 456
after relatively short-term resistance training is small, and on the borderline of what can be detected. 457
Importantly however, we recently found no evidence for free tendon hypertrophy in long-term (4 458
years) resistance trained men, despite their substantially greater muscle volume (56%) and strength 459
(58%) compared to untrained controls (Massey et al., 2017). Based on those findings and the current 460
results it seems unlikely that high-load resistance training causes tendon hypertrophy even after 461
months and years of training. 462
463
Moreover, the lack of free tendon hypertrophy after strength training in the current study is consistent 464
with some evidence that resistance exercise/training may not noticeably stimulate increased in vivo
465
collagen protein synthesis. For instance, an acute bout of high load dynamic knee extensor 466
contractions (3 x 10 repetitions, 70% 1 repetition maximum) had no effect on patellar tendon 467
collagen type I messenger RNA expression 24 hours post exercise (Sullivan et al., 2009). Also, 12 468
weeks of isoinertial squat training failed to increase the concentration of procollagen type 1 N-469
propeptide (biomarker of collagen synthesis) in patellar tendon peritendinous tissue (Bloomquist et 470
al., 2013; this study also observed no change in patellar tendon cross-sectional area [via MRI]). 471
Contrarily there is some evidence that mechanical loading of free tendon tissue can induce an 472
al, 2013). Therefore mechanical loading in vivo may not necessarily stimulate a sufficiently robust 474
induction of the appropriate biochemical response needed to elicit free tendon hypertrophy. 475
476
In contrast to the free tendon, the tendon-aponeurosis complex stiffness measured at high force levels 477
(i.e. 70-80% pre- training MVT) increased only after SCT, but not ECT. The increased tendon-478
aponeurosis complex high force stiffness after SCT is consistent with previous findings (Kubo et al., 479
2001; Arampatzis et al., 2007, 2010; Bohm et al., 2014) and the greater increase after SCT than ECT 480
may be attributable to the substantially longer loading duration in SCT. Previous work has shown 481
greater increases in tendon-aponeurosis complex stiffness after strength training with long vs. short 482
duration contractions (Kubo et al., 2001; Arampatzis et al., 2007). The absence of change in tendon-483
aponeurosis complex stiffness for ECT in the current study contrasts with earlier studies examining 484
the triceps surae (Burgess et al., 2007) and knee extensors (Tillin et al., 2012). It is possible that our 485
results diverge from Burgess et al., because an increase in free tendon stiffness as we have observed 486
after ECT, may be of greater consequence to the triceps surae tendon-aponeurosis complex, as the 487
Achilles tendon accounts for a larger proportion of the triceps surae tendon-aponeurosis complex 488
stiffness (Farcy et al., 2013). Tillin et al. (2012) trained their participants at a longer muscle length 489
(knee joint angle 85° vs. 115° in the current study), which has been shown to result in greater 490
increases in knee extensor tendon-aponeurosis which has been shown to result in greater increases in 491
knee extensor tendon-aponeurosis complex stiffness (Kubo et al., 2006) in accordance with high 492
force development in conditions of higher tissue strain magnitude (McMahon et al., 2013), and this 493
could explain their contrasting findings of increased knee extensor tendon-aponeurosis complex 494
stiffness. . . 495
496
An interesting observation was that the force-elongation relationship post ECT was actually shifted to 497
the right (greater elongation at specific forces). The increase in elongation in response to the same 498
high force after ECT was greater than after SCT and tended to be greater than the CON group. The 499
rightward shift in the force-elongation curves after ECT appears to result from a change in elongation 500
at the initial level (10%MVT), that persists throughout the rise in tendon force, as after 10%MVT the 501
gradients of the force-elongation relationships pre-post ECT are equivalent. Consistent with our data, 502
there is some evidence that sprint trained athletes (who inherently utilize explosive contractions) 503
display greater knee extensor tendon-aponeurosis complex elongation at the lowest levels of force 504
(<20%MVT), with resultantly greater elongation throughout the measured force range (Kubo et al., 505
2000; Kubo et al., 2011). It is possible that a reduction in low force tendon aponeurosis complex 506
stiffness (i.e. 0-10%MVT) after ECT with no changes at higher forces indicates changes in tissue 507
collagenous structure/composition that specifically influence the lower region of the force-elongation 508
relationship. In contrast, whilst SCT increased high force stiffness there was no clear leftward shift in 509
the force-elongation curve. Indeed, some previous studies have concordantly reported an increase in 510
high force tendon-aponeurosis complex stiffness, along with no apparent effect on the elongation at 511
lower force levels (Kubo et al., 2001; Kubo et al., 2010). These results perhaps imply that SCT may 512
induce tissue collagenous structure/composition changes that specifically impact the high stiffness 513
region of the force-elongation relationship (e.g. collagen cross-links: Kjaer et al., 2015). Further work 514
is needed to fervently elucidate whether force level specific changes in stiffness are likely to occur 515
with different interventions, and identify any possible mechanistic basis for this supposition. 516
517
Collectively our findings show that in comparison to a control intervention patellar tendon stiffness 518
but not tendon-aponeurosis complex stiffness increased after ECT, whereas SCT increased both 519
patellar tendon and tendon-aponeurosis complex stiffness, indicating a differential adaptive response 520
tendon-aponeurosis complex stiffness changes after ECT demonstrates the independence of these 522
adaptations. The simple observation that only a small proportion of tendon-aponeurosis complex 523
elongation is due to the patellar tendon elongation (19%) further highlights the distinction of these 524
measures. From our study we cannot discount a contribution of the quadriceps tendon and vastus 525
lateralis extramuscular tendon to tendon-aponeurosis complex stiffness because the fascicle-526
aponeurosis intersection displacement reflects elongation in all tendinous tissues distal to the tracked 527
point (Stafilidis et al., 2005). However, from our data and previous measures of vastus lateralis 528
myotendinous junction and aponeurosis elongation (Stafilidis et al., 2005), the muscle aponeurosis 529
apparently comprises the most influential component of tendon-aponeurosis elongation and stiffness. 530
The tendon-aponeurosis complex stiffness changes after SCT could reflect adaptations (material 531
properties and/or size) of the aponeurosis component of the tendon-aponeurosis complex, and there 532
was some indication of increased aponeurosis area after SCT (+7% within-group change, but 533
insufficient for a between group effect), that could conceivably have contributed to the increased 534
tendon-aponeurosis complex stiffness after SCT. Aponeurosis hypertrophy is thought to be necessary 535
to provide an enlarged attachment area for an increased muscle cross-sectional area (Wakahara et al., 536
2015), thus our finding is consistent with the similar hypertrophic response of the quadriceps femoris 537
muscle (+8%) after SCT and not ECT (or CON). The muscle hypertrophic response to SCT but not 538
ECT is most likely a consequence of the greater total loading duration with SCT. Following bouts of 539
isoinertial knee extensions with equivalent load, a greater total loading duration was associated with 540
increased acute amplitude of muscle myofibrillar protein synthesis (Burd et al., 2012). Therefore, the 541
limited total loading duration in ECT is perhaps an insufficient stimulus for the necessary muscle 542
protein synthesis, and likely accounts for the lack of muscle hypertrophy in response to this training 543
modality. Although it should be recognized that overall muscle volume is a relatively gross measure 544
that may not capture regional remodeling or hypertrophy within specific regions of the muscle 545
according to localized mechanical stimuli. 546
547
A potential limitation of our study concerns the methodology for determining tendon-aponeurosis 548
mechanical properties, even though it has been used very extensively (Bojsen-Møller et al., 2005; 549
Kubo et al., 2001, 2006, 2009; Tillin et al., 2012). In addition to the patellar tendon, which we have 550
assessed, the contribution of other intermediary tendinous tissues (i.e. quadriceps and vastus lateralis 551
tendon), to tendon-aponeurosis complex elongation appears relatively small (Stafilidis et al., 2005), 552
but has limited attention. The measurement of tendon-aponeurosis complex elongation could also be 553
influenced by the active state of muscle fibers in parallel with the aponeurosis. Aponeurosis stiffness 554
is considered muscle-activation dependent as muscle fibers anchor the aponeurosis during contraction 555
(Lieber et al., 2000), and is also modulated by muscle deformation during contraction (Aziz and 556
Roberts, 2009) as well as the relative force distribution along the length of the aponeurosis (Zuurbier 557
et al. 1994). Training-induced changes in muscle morphology and architecture, as well as neural 558
recruitment strategy along the muscle length, may have influenced muscle-aponeurosis interaction 559
and thus aponeurosis behavior during contraction, conceivably confounding the interpretation of 560
differences in tendon-aponeurosis stiffness pre-post intervention. However, at present we are not 561
aware of a better technique for investigating the mechanical behavior of the tendon-aponeurosis 562
complex. 563
564
In conclusion, ECT was equally effective as SCT for stimulating an increase in patellar tendon 565
stiffness and Young’s modulus, demonstrating that in order to induce free tendon adaptation, strength 566
training need only involve brief, high force muscle contractions. However, brief high force muscle 567
contractions are not solely sufficient to stimulate muscle and aponeurosis adaptations as only SCT 568
ineffective. Thus our results suggest muscle-aponeurosis adaptations are specific to the loading 570
regime and sensitive to loading duration. 571
Conflict of Interest 572
The authors declare that the research was conducted in the absence of any commercial or financial
573
relationships that could be construed as a potential conflict of interest. 574
Author Contributions 575
Conceived and designed the study: GM, TB, W, NT, JF. Performed experiments: GM, TB, TM-576
W. Analyzed the data: GM, TB, TM-W, NT. Interpreted the data and drafted the manuscript: GM, JF. 577
Critically evaluated the manuscript: TB, TM-W, NT. All authors are responsible for the final content 578
of the manuscript. 579
Funding 580
This study was supported financially by the Arthritis Research UK Centre for Sport, Exercise and 581
Osteoarthritis (Grant reference 20194). 582
Acknowledgments 583
The authors thank Clare Appleby, Antonio Morales, and Alex McKeown for their assistance during 584
laboratory measurement and training sessions and participants for their time in taking part in the 585
study. 586
References 587
Arampatzis, A., Karamanidis, K., and Albracht, K. (2007). Adaptational responses of the human 588
Achilles tendon by modulation of the applied cyclic strain magnitude. J. Exp. Biol. 210, 2743– 589
2753. doi: 10.1242/jeb.003814. 590
Arampatzis, A., Peper, A., Bierbaum, S., and Albracht, K. (2010). Plasticity of human Achilles 591
tendon mechanical and morphological properties in response to cyclic strain. J. Biomech. 43, 592
3073–3079. doi: 10.1016/j.jbiomech.2010.08.014 593
Azizi, E., and Roberts, T.J. (2009). Biaxial strain and variable stiffness in aponeurosis. J. Physiol. 594
587, 4309–4318. doi: 10.1113/jphysiol.2009.173690 595
Balshaw, T.G., Massey, G.J., Maden-Wilkinson, T.M., Tillin, N.A., and Folland, J.P. (2016). 596
Training-specific functional, neural and hypertrophic adaptations to explosive- vs. sustained-597
contraction strength training. J. Appl. Physiol. 120, 1364–1373. doi: 598
10.1152/japplphysiol.00091.2016 599
Blazevich, A.J., Coleman, D.R., Horne, S., and Cannavan, D. (2009). Anatomical predictors of 600
maximum isometric and concentric knee extensor moment. Eur. J. Appl. Physiol. 105, 869– 601
Bloomquist, K., Langberg, H., Karlsen, S., Madsgaard, S., Boesen, M., and Raastad, T. (2013). 603
Effect of range of motion in heavy load squatting on muscle and tendon adaptations. Eur. J.
604
Appl. Physiol. 113, 2133–2142. doi: 10.1007/s00421-013-2642-7 605
Bohm, S., Mersmann, F., Tettke, M., Kraft, M., and Arampatzis, A. (2014). Human Achilles tendon 606
plasticity in response to cyclic strain: effect of strain rate and duration. J. Exp. Biol. 217, 4010– 607
4017. doi: 10.1242/jeb.112268 608
Bojsen-Møller, J., Magnusson, S.P., Rasmussen, L.R., Kjaer, M., and Aagaard, P. (2005). Muscle 609
performance during maximal isometric and dynamic contractions is enhanced by the stiffness 610
of the tendinous structures. J. Appl. Physiol. 99, 986–994. doi: 611
10.1152/japplphysiol.01305.2004 612
Buchanan, C.I., and Marsh, R.L. (2002). Effects of exercise on the biomechanical, biochemical and 613
structural properties of tendons. Comp. Biochem. Physiol. A. Mol. Integr. Physiol. 133, 1101– 614
1107. doi: 10.1016/S1095-6433(02)00139-3 615
Burd, N.A., Andrews. R.J., West, D.W.D., Little. J.P., Cochran, A.J.R., Hector, A.J., et al. (2012). 616
Muscle time under tension during resistance exercise stimulates differential muscle protein sub-617
fractional synthetic responses in men. J. Physiol. 590, 351–362. doi: 618
10.1113/jphysiol.2011.221200 619
Burgess, K.E., Connick, M.J., Graham-Smith, P., and Pearson, S.J. (2007). Plyometric vs. isometric 620
training influences on tendon properties and muscle output. J. Strength. Cond. Res. 21, 986– 621
989. doi: 10.1519/R-20235.1 622
Dideriksen, K., Sindby, A.K., Krogsgaard, M., Schjerling, P., Holm, L., and Langberg H. (2013). 623
Effect of acute exercise on patella tendon protein synthesis and gene expression. Springerplus.
624
2, 109. doi: 10.1186/2193-1801-2-109 625
Farcy, S., Nordez, A., Dorel, S., Hauraix, H., Portero, P., and Rabita, G. (2013). Interaction between 626
gastrocnemius medialis fascicle and Achilles tendon compliance: A new insight on the quick-627
release method. J. Appl. Physiol. 116, 259–266. doi: 10.1152/japplphysiol.00309.2013 628
Folland, J.P., and Williams, A.G. (2007). The adaptations to strength training: morphological and 629
neurological contributions to increased strength. Sports. Med. 37, 145–168. doi: 630
10.2165/00007256-200737020-00004 631
Hansen, P., Bojsen-Møller, J., Aagaard, P., Kjaer, M., and Magnusson, S.P. (2006). Mechanical 632
properties of the human patellar tendon, in vivo. Clin. Biomech. (Bristol, Avon). 21, 54–58. doi: 633
10.1016/j.clinbioech.2005.07.008 634
Karamanidis, K., Arampatzis, A., and Mademli, L. (2008). Age-related deficit in dynamic stability 635
control after forward falls is affected by muscle strength and tendon stiffness. J. Electromyogr.
636
Kinesiol. 18, 980–989. doi: 10.1016/j.jelekin.2007.04.003 637
Kellis, E., and Baltzopoulos. V. (1999). In vivo determination of the patella tendon and hamstrings 638
moment arms in adult males using videofluoroscopy during submaximal knee extension. Clin.
639
Kjaer, M., Jørgensen, N.R., Heinemeier, K., and Magnusson, S.P. (2015). Exercise and regulation of 641
bone and collagen tissue biology. Prog. Mol. Biol. Transl. Sci. 135, 259–291. doi: 642
10.1016/bs.pmbts.2015.07.008. 643
Kongsgaard, M., Reitelseder, S., Pedersen, T.G., Holm, L., Aagaard, P., Kjaer, M., et al. (2007). 644
Region specific patellar tendon hypertrophy in humans following resistance training. Acta.
645
Physiol. (Oxf). 191, 111–121. doi: 10.1111/j.1748-1716.2007.01714.x 646
Kösters, A., Wiesinger, H.P., Bojsen-Møller, J., Müller, E., and Seynnes, O. (2014). Influence of 647
loading rate on patellar tendon mechanical properties in vivo. Clin. Biomech. (Bristol, Avon).
648
29, 323–329. doi: 10.1016/j.clinbiomech.2013.12.010 649
Kubo, K., Ikebukuro, T., Maki, A., Yata, H., and Tsunoda, N. (2012). Time course of changes in the 650
human Achilles tendon properties and metabolism during training and detraining in vivo. Eur.
651
J. Appl. Physiol. 112: 2679–2691. doi: 10.1007/s00421-011-2248-x. 652
Kubo, K, Ikebukuro, T., Yaeshima, K., Yata, H., Tsunoda, N., and Kaneshisa, H. (2009). Effects of 653
static and dynamic training on the stiffness and blood volume of tendon in vivo. J. Appl.
654
Physiol. 106, 412–417. doi: 10.1152/japplphysiol.91381.2008 655
Kubo, K., Ikebukuro. T., Yata. H., Tomita. M., and Okada, M. (2011). Morphological and 656
mechanical properties of muscle and tendon in highly trained sprinters. J. Appl. Biomech. 27, 657
336–344. doi: 10.1123/jab.27.4.336 658
Kubo, K., Ikebukuro, T., Yata. H., Tsunoda, N., and Kaneshisa, H. (2010). Time course of changes in 659
muscle and tendon properties during strength training and detraining. J. Strength. Cond. Res.
660
24, 322–331. doi: 10.1519/JSC.0b013e318c865e2 661
Kubo, K., Kanehisa, H., Fukunaga, T. (2001). Effect of different duration isometric contractions on 662
tendon elasticity in human quadriceps muscles. J. Physiol. 536, 639–655. doi: 10.1111/j.1469-663
7793.2001.0649c.xd 664
Kubo, K., Kanehisa, H., Kawakami, Y., and Fukunaga, T. (2000). Elasticity of tendon structures of 665
the lower limbs in sprinters. Acta. Physiol. Scand. 168, 327–335. doi: 10.1046/j.1365-666
201x.2000.00653.x 667
Kubo, K., Lomuro, T., Ishihuro, N., Tsunoda, N., Sato, Y., Ishii, N., et al. (2006a). Effects of low-668
load resistance training with vascular occlusion on the mechanical properties of muscle and 669
tendon. J. Appl. Biomech. 22:112–119. doi: 10.1123/jab.22.2.112 670
Kubo, K., Ohgo, K., Takeishi, R., Yoshinaga, K., Tsunoda, N., Kanehisa, H., et al. (2006b). Effects 671
of isometric training at different knee angles on the muscle-tendon complex in vivo. Scand. J.
672
Med. Sci. Sports. 16:159–167. doi: 10.1111/j.1600-0838.2005.00450.x 673
Kubo, K., Yata. H., Kaneshisa, H., and Fukunaga, T. (2006c). Effect of isometric squat training on 674
the tendon stiffness and jump performance. Eur. J. Appl. Physiol. 96, 305–314. doi: 675
10.1007/s00421-005-0087-3 676
Lakens, D. (2013). Calculating and reporting effect sizes to facilitate cumulative science: a practical 677
primer for t-tests and ANOVAs. Front. Psychol. 4, 863. doi: 10.3389/fpsyg.2013.00863 678
Formatted: German (Germany)
Lavagnino, M., Arnoczky, S.P., Kepich, E., Calballero, O., and Haut, R.C. (2008). A finite element 679
model predicts the mechanotransduction response of tendon cells to cyclic tensile loading. 680
Biomech. Model. Mechanobiol. 7, 405–416. doi: 10.1007/s10237-007-0104-z 681
Lieber, R.L., Leonard. M.E., and Brown-Maupin, C.G. (2000). Effects of muscle contraction on the 682
load-strain properties of frog aponeurosis and tendon. Cells. Tissues. Organs. 166, 48–54. doi: 683
10.1159/000016708 684
Lipps, D.B., Oh, Y.K., Ashton-Miller, J.A., and Wojtys, E.M. (2014). Effect of increases quadriceps 685
tensile stiffness on peak anterior cruciate ligament strain during a simulated pivot landing. J.
686
Orthop. Res. 32, 423–430. doi: 10.1002/jor.22531 687
Malliaras, P., Kamal, B., Nowell, A., Farley, T., Dhamu, H., Simpson, V., et al. (2013). Patellar 688
tendon adaptation in relation to load-intensity and contraction type. J. Biomech. 46, 1893–1899. 689
doi: 10.1016/j.jbiomech.2013.04.022 690
Massey, G.J., Balshaw, T.G., Maden-Wilkinson, T.M. and Folland, J.P. (2017). Tendinous tissue 691
properties after short and long-term functional overload: Differences between controls, 12 692
weeks and 4 years of resistance training. Acta. Physiol, 222, e13019. doi:10.1111/apha.13019 693
McMahon, G.E., Morse, C.I., Burden, A., Winwood, K., Onambélé-Pearson, G.L. (2013). The 694
manipulation of strain, when stress is controlled, modulates in vivo tendon mechanical 695
properties but not systematic TGF-B1 levels. Physiol. Rep. 1, e00091. doi: 10.1002/phy2.91 696
Miller, B.F., Olesen, J.L., Hansen, M., Døssing, S., Crameri, R.M., Welling, R.J., et al. (2005). 697
Coordinated collagen and muscle protein synthesis in human patella tendon and quadriceps 698
muscle after exercise. J. Physiol. 567, 102–133. doi: 10.1113/jphysiol.2005.093690 699
Raiteri, B.J., Cresswell, A.G., and Lichtwark, G.A. (2016). Three-dimensional geometrical changes 700
of the human tibialis anterior muscle and its central aponeurosis measured witch three-701
dimensional ultrasound during isometric contractions. PeerJ, 4, e2260. doi: 702
10.7717/peerj.2260. 703
Reeves, N.D., Maganaris, C.N., and Narici, M.V. (2003). Effect of strength training on human patella 704
tendon mechanical properties of older individuals. J. Physiol. 548, 971–81. doi: 705
10.1113/jphysiol.2002.035576 706
Salaffi, F., Carotti, M., Stancati. A., and Grassi, W. (2005). Health-related quality of life in older 707
adults with symptomatic hip and knee osteoarthritis: a comparison with matched healthy 708
controls. Aging. Clin. Exp. Res. 17, 255–263. doi: 10.1016/0021-9290(94)90020-5 709
Seynnes, O.R., Bojsen-Møller. J., Albracht, K., Arndt, A., Cronin, N.J., Finni, T., et al. (2014). 710
Ultrasound-based testing of tendon mechanical properties: a critical evaluation. J. Appl.
711
Physiol. 118, 133–141. doi: 10.1152/japplphysiol.00849.2014. 712
Seynnes, O.R., Erskine, R.M., Maganaris, C.N., Longo, S., Simoneau, E.M., Grosset, J.F., et al. 713
(2009). Training-induced changes in structural and mechanical properties of the patellar tendon 714
are related to muscle hypertrophy but not to strength gains. J. Appl. Physiol. 107, 523–530. doi: 715