INTRODUCTION
Mammals have separate organs such as the cochlea and otolithic organs to serve auditory and vestibular functions, respectively. By contrast, fishes lack the cochlea, and their otolithic organs have dual functions of hearing and balance. Among the three otolithic organs, the saccule plays a crucial role in audition in the majority of fishes that have been studied (Popper and Fay, 1999; Lu, 2004). Like the lagena and utricle, the saccule, a fluid-filled sac, is composed of a sensory epithelium and an otolith that is attached to the epithelium by an otolithic membrane. The sensory epithelium consists of sensory hair cells that are innervated by dendrites of saccular ganglion cells, the axons of which form the saccular branch of the eighth nerve that conveys acoustic signals to the brain.
A sound wave can be measured in either acceleration or pressure because it includes both particle motion and pressure components. It is known that sound pressure rather than particle motion is the relevant mode of sound for terrestrial vertebrates. However, the particle-motion mode of sound is important to all fishes because it can directly stimulate the inner ear viathe skull. In addition to this direct particle-motion input, sound pressure can also indirectly stimulate the fish’s inner ear using accessory organs such as part of the swim bladder, which is either close to the inner ear or directly connected to it by the Weberian ossicles, or a gas bubble mechanically coupled to the inner ear (for reviews, see Popper et al., 1988; Popper and Fay, 1999; Lu, 2004). Thus, fishes with accessory auditory organs are sensitive to both particle motion and pressure modes of sound, leading to enhanced pressure detection and a broadened frequency response range.
Frequency provides animals the information about the nature of a sound source, e.g. prey or a predator. Frequency analysis is one
of the most important functions of the auditory systems in animals. Early studies in frequency responses of saccular afferents were mainly conducted in the goldfish (Carassius auratus) that has accessory structures specialized for sound pressure detection. Single-unit recording studies have shown that saccular afferents of the goldfish are broadly tuned with characteristic frequencies (CFs) in a range of ≤50 to over 1000Hz (Furukawa and Ishii, 1967; Fay, 1978; Fay and Ream, 1986; Coombs and Fay, 1987). Most saccular afferents in the goldfish are sensitive to sounds less than 300Hz, with best sensitivity (BS) ranging from 74 to 127dB re. 1mPa (Fay and Ream, 1986). Other studies have investigated the frequency response of auditory afferents in fish species with and without accessory auditory structures by monitoring the pressure component of sounds generated by a loudspeaker (Horner et al., 1981; McCormick and Popper, 1984; Lu and Fay, 1996; McKibben and Bass, 1999; McKibben and Bass, 2001; Suzuki et al., 2002; Sisneros, 2004).
The majority of fishes do not possess accessory auditory structures to enhance sound pressure detection; they are primarily sensitive to the particle motion mode of sound rather than sound pressure. Several experimental devices have been developed to provide directional linear acceleration to simulate underwater acoustic particle motion (Sand, 1974; Fay, 1984; Lu et al., 1996; Schellart et al., 1995). However, studies of frequency coding of acoustic particle motion is limited to two teleost species, the toadfish (Opsanus tau) and midshipman (Porichthys notatus) (Fay and Edds-Walton, 1997; Weeg et al., 2002), from the same family (Batrachoididae) and they are known to use sounds in communication (Gary and Winn, 1961; Bass, 1990; Fine and Mosca, 1995).
The Journal of Experimental Biology 213, 1591-1601 © 2010. Published by The Company of Biologists Ltd doi:10.1242/jeb.038836
Frequency coding of particle motion by saccular afferents of a teleost fish
Zhongmin Lu
1,2,*, Zemin Xu
1and William J. Buchser
11Department of Biology, University of Miami, 1301 Memorial Drive, Room 4, Coral Gables, FL 33146, USA and 2University of Miami Neuroscience Program, PO Box 011351, Miami, FL 33101, USA
*Author for correspondence ([email protected]) Accepted 14 January 2010
SUMMARY
The saccule is known to play an important role in hearing in fishes. In this study we investigated spatial frequency selectivity of single saccular afferents in a teleost fish (the sleeper goby, Dormitator latifrons) to acoustic particle motion at 50–400Hz. Saccular afferents have similar distributions of best sensitivity (–90.0 to –54.8dBre.1g, mean ± s.d.–81.1±8.0dB) and characteristic frequencies (⭐50–400Hz, median80Hz) along the longitudinal, side-to-side and dorsoventral axes of fish. They were lowpass, bandpass or broadly tuned to low frequencies with Q50%at 15dB above threshold in ranges from 0.28 to 3.30 (1.46±0.71), 0.18 to
2.54 (1.36±0.78), and 0.41 to 4.26 (2.25±0.1.12) along the three axes, showing slightly greater frequency tuning in the vertical axis than horizontal axes. At supra threshold we found tuning plasticity, i.e. best frequencies of saccular afferents shifted to high frequencies as stimulus level increased. Isolevel rate–frequency curves were asymmetrical with shallow slopes at the low-frequency edge and steep slopes at the high-low-frequency edge. Saccular afferents of the sleeper goby have similar capabilities of coding particle motion frequencies in the three orthogonal axes. Results from this and other studies suggest that (1) the saccule is the major hearing organ in this species, (2) the saccule of this species is capable of encoding sound frequencies in three dimensional space, and (3) saccular afferents in fishes without accessory auditory structures exhibit similar frequency selectivity in response to particle motion.
The sleeper gobies (Dormitator latifronsRichardson) live at the bottom of fresh or blackish water where visual cues are minimal. They feed on insects, tadpoles, small crustaceans and fishes. Although the sleeper gobies do not appear to use sounds in communication, the auditory function is believed to play an important role in their survival. We have been studying how the directional information of a sound is encoded by sensory afferents innervating all three otolithic organs in this species that is not specialized for pressure detection (for reviews, see Lu et al., 1998; Lu and Popper, 2001; Lu et al., 2003; Lu et al., 2004; Lu, 2004; Bass and Lu, 2007). Like most teleost fishes, the sleeper goby is primarily sensitive to acoustic particle motion because it does not have the Weberian ossicles and its swim bladder is not close to the inner ears. Our previous work focused on directional response properties of saccular, lagenar and utricular afferents to particle motion at one stimulus frequency (i.e. 100Hz). In the present study, we systematically investigated frequency tuning of single saccular afferents of the sleeper goby and how frequency selectivity varies with stimulus level and axis. In addition, we compared results of the present study with those collected from lagenar and utricular afferents in the same species to provide insights into frequency selectivity of different otolithic organs. Furthermore, this study sheds light on common features of frequency selectivity shared by all fishes in response to acoustic particle motion. Some preliminary data were reported in abstract form (Buchser et al., 2003).
MATERIALS AND METHODS Animal preparation
Twenty nine sleeper gobies (Dormitator latifrons; Eleotridae), ranging from 100–120mm in total length, were used in this study. Fish preparation was reported in detail in previous studies (Lu et al., 1998; Lu and Popper, 2001; Lu et al., 2003; Lu et al., 2004). Briefly, each fish was anesthetized in a bath of 0.05% buffered MS-222 (Sigma-Aldrich, St Louis, MO, USA) solution and then placed on a holder in a surgical tray with its body covered with a wet paper towel. Air-saturated water irrigated the fish’s gills at a flow rate of 100mlmin–1through a mouthpiece to assist respiration
throughout experiments. A 3mm⫻3mm hole was made in the skull to expose the left saccular nerve. The fish’s head was stabilized by a holder that was firmly attached to an experimental tank, and the whole fish except the top of its head was then submerged in water in the tank. The water temperature in the experimental tank was kept at ~22°C. The fish remained undisturbed in the holder for at least 1h in order to let it fully recover from the anesthesia before neural recording. A dose of gallamine triethiodide (3mgg–1body
mass; Sigma-Aldrich) dissolved in 0.7% NaCl solution was intramuscularly injected into the tail to prevent movement during neural recording. The animal use protocol was approved by the University of Miami Animal Care and Use Committee and complied with policies of the National Institutes of Health.
Experimental apparatus
An experimental setup was composed of a Dell computer, four-channel D/A and A/D modular system (Tucker-Davis Technologies, Alachua, FL, USA), and shaker apparatus (Fay, 1984), as used in our previous studies (Lu et al., 1996; Lu et al., 1998; Lu et al., 2001; Lu et al., 2003; Lu et al., 2004; Lu and Popper, 2001; Lu and Xu, 2002). The shaker apparatus rested on an anti-vibration table (Model 63-540, Technical Manufacture Corporation, Peabody, MA, USA). Acoustic signals were pure tones of a 500-ms duration and 20-ms cosine rise and fall times at 50, 80, 100, 125, 200, 250, 345 and 400Hz. They were digitally synthesized by the computer, read
out from 16-bit D-to-A converters at a rate of 10kHz, lowpass filtered at 4kHz, programmably attenuated, and fed to three P1000 power amplifiers (Hafler, Tempe, AZ, USA). Outputs of the power amplifiers drove two orthogonal pairs of mini mechanical shakers (Type 4810; Brüel & Kjær, Norcross, GA, USA) in the horizontal plane and one B&K mechanical shaker (Type 4809) in the vertical axis. Fish were linearly accelerated by these shakers along the longitudinal, side-to-side and dorsoventral axes of fish. Motion produced by the shaker apparatus simulated underwater acoustic particle motion.
Linear accelerations at the eight frequencies were presented at the three orthogonal axes of fish. At the beginning of each experiment, acceleration stimuli at the selected frequencies were calibrated to achieve constant acceleration (root mean square) and they were reported in decibel(dB)re.1g using three piezoelectric accelerometers (Model 336C; PCB Piezotronics Inc., Depew, NY, USA) mounted on the experimental tank along the three axes. Sensitivity of the three accelerometers was 1031mVg–1
(longitudinal), 1036mVg–1 (side-to-side), and 982mVg–1
(dorsoventral). Search stimuli at 50, 100, and 400Hz were presented sequentially along the three orthogonal axes once per second at –28dBre.1g. A custom-written Visual C++ 6.0 program was used for stimulus calibration and data acquisition. Excel macro software was written and used for plotting response curves and data analysis.
Neurophysiological recording
The saccular nerve bundle is the largest and most easily accessible, for single-unit recording, of the three otolithic organ nerves in the sleeper goby (Lu et al., 1998; Lu and Popper, 2001). Recording microelectrodes were made from 1.5mm glass capillaries (World Precision Instruments, Sarasota, FL, USA) that were pulled to a tip size of approximate 0.5mm using a micropipette puller (P-97, Sutter Instrument Inc., Novato, CA, USA) and then filled with 3moll–1
KCl. The recording electrode was mounted on a three-dimensional hydraulic micromanipulator (WR-6, Narashige, Tokyo, Japan) and lowered manually, with a step resolution of 0.2mm, to reach the saccular nerve bundle. The tip of the reference electrode, a 40-mm long platinum wire (0.5mm in diameter), was kept in the fluid of the brain cavity. Evoked action potentials recorded from single saccular afferents by the electrodes were sent to a preamplifier (S-7071A, World Precision Instruments), amplified 100–1000 times, bandpass filtered between 450 and 4500Hz, digitally recorded at 10kHz, and stored in the computer.
Data acquisition and analysis
level; CF was the BF at the lowest threshold (i.e. BS) in a stimulus axis.
Isolevel rate–frequency functions were obtained from response areas to reveal most responsive frequencies above threshold. Slopes at both low-frequency and high-frequency edges of each isolevel rate–frequency curve were calculated in spikes per octave. BF shift was defined as the difference between BF and CF (BF – CF) at a stimulus level from the isolevel, rate–frequency curve. BFs at different stimulus levels were compared to determine if BF changed with stimulus level. Rate-level functions were also constructed from response areas. Each isolevel rate–frequency curves was normalized to remove spontaneous activity and spike rate effects based on the following equation:
where Niis an individual spike rate, Nminis the minimum spike rate,
and Nmaxis the maximum spike rate.Q50%was measured from the
normalized isolevel rate–frequency curve to represent the frequency selectivity as described by Lu et al. (Lu et al., 2004). Q50%was
defined as the ratio of BF to the frequency bandwidth at half the maximum normalized response.
Various statistical tests including one-way analysis of variance (ANOVA), two-way ANOVA, and Mann–Whitney U-tests were performed to determine if any difference observed was significant. For results of the ANOVA that were significantly different, post-hocTukey’s tests were conducted to identify the specific differences.
RESULTS
Frequency tuning at the threshold
This study reports frequency response properties of 61 single saccular afferents, for which complete data were obtained along the fish’s longitudinal, side-to-side and dorsoventral axes. All the saccular afferents were responsive to linear acceleration up to 400Hz. In general, these saccular afferents were tuned to low frequencies of linear acceleration. For descriptive purposes, tuning curves were classified into lowpass, bandpass and broad categories
Ni−Nmin
(
)
(
Nmax−Nmin)
(1) Normalized response (%) = ,
(see Fig.1). Lowpass tuning curves continuously increased sensitivity as stimulus frequency decreases (e.g. Fig.1A). CFs of these tuning curves occurred at or below 50Hz, the lowest stimulus frequency tested in this study. Bandpass tuning curves were relatively sharply tuned to stimulus frequencies within a range from 80 to 400Hz (e.g. Fig.1B). In contrast to lowpass tuning curves, CFs of bandpass tuning curves could be determined within the frequency range we tested. The rest of the tuning curves were broadly tuned to frequencies in the range between 80 and 400Hz (e.g. Fig.1C). The relationship between tuning curve type and stimulus axis is illustrated in Fig.1D. It appears that there are more lowpass and bandpass tuning curves than broad tuning curves in the longitudinal and dorsoventral axes. Tuning curve types tend to evenly distribute in the side-to-side axis.
A few saccular afferents (10%) had the same types of tuning curves (either lowpass, bandpass or broad) along all three stimulus axes (e.g. Fig.2A,B) whereas the majority of saccular afferents (90%) had shapes of tuning curves that varied with stimulus axis (e.g. Fig.2C,F). For saccular afferents having the same types of tuning curves, some had similar BS along all three stimulus axes (e.g. Fig.2A) and others were more sensitive to stimuli along one of the three axes (e.g. Fig.2B). Fig.2C shows a bandpass saccular afferent that was tuned to different frequencies between 50 and 400Hz in the three stimulus axes. For individual saccular afferents having various types of tuning curves, we found a diversity of combinations of types or shapes of tuning curves, depending on stimulus axis. For example, the afferent shown in Fig.2D has lowpass tuning curves along the longitudinal and side-to-side axes and a bandpass tuning curve along the dorsoventral axis. Fig.2E shows bandpass tuning curves in the longitudinal and dorsoventral axes but a lowpass tuning curve in the side-to-side axis. Some saccular afferents had a different type of tuning curve along each of the three stimulus axes (e.g. Fig.2F).
Saccular afferents had similar non-normal CF distributions along the three axes with peaks at or less than the lowest frequency of 50Hz that was tested (Fig.3A). CFs of saccular afferents were distributed from ≤50 to 250Hz (median, 80Hz), ≤50 to 345Hz (median, 80Hz) and ≤50 to 400Hz (median, 80Hz) along the
-100 -90
-80
-70 -60 -50 -40
10 100 1000
Freq. (Hz)
-100 -90
-80
-70 -60 -50 -40
10 100 1000
Freq. (Hz)
-100 -90
-80
-70 -60 -50 -40
10 100 1000
-100 -90
-80
-70 -60 -50 -40
10 100 1000
Freq. (Hz)
–40 –60 –80 –100
A
-100 -9 0 -80 -7 0 -6 0 -5 0 -4 010 100 1000
Fr eq. (Hz) -100
-9 0 -80 -7 0 -6 0 -5 0 -4 0
10 100 1000
Fr eq. (Hz) -100
-9 0 -80 -7 0 -6 0 -5 0 -4 0
10 100 1000
Fr eq. (Hz) -100
-9 0 -80 -7 0 -6 0 -5 0 -4 0
10 100 1000
Fr eq. (Hz)
–40 –60 –80 –100
B
-100 -9 0 -80 -7 0 -6 0 -5 0 -4 010 100 1000
Freq. (Hz) -100
-9 0 -80 -7 0 -6 0 -5 0 -4 0
10 100 1000
Freq. (Hz) -100
-9 0 -80 -7 0 -6 0 -5 0 -4 0
10 100 1000
Freq. (Hz) -100
-9 0 -80 -7 0 -6 0 -5 0 -4 0
10 100 1000
Freq. (Hz)
–40
–60
–80
–100
10 100 1000
Stimulus frequency (Hz)
C
10 100 1000
Stimulus frequency (Hz)
10 100 1000
Stimulus frequency (Hz)
D
0 10 20 30 L SS DVLowpass Bandpass Broad
Thre
s
hold (dB re
. 1 g)
N u m b er of a ff erent s Thre s
hold (dB re
. 1 g)
Thre
s
hold (dB re
. 1 g)
Fig.1. Lowpass (A), bandpass (B), and broad (C) tuning
curves from 12 representative saccular afferents in response to particle motion along the side-to-side axis.
(D)Distributions of tuning curve types along the longitudinal
longitudinal, side-to-side and dorsoventral axes, respectively. There were no differences in CF among the three stimulus axes (Mann–Whitney U-tests, P>0.05). BS distributions resembled bell-shaped curves along all three axes (Fig.3B). BS of saccular afferents fell in ranges from –58.8 to –90.0dB (–80.3±7.8dB re. 1g; mean ± s.d.), –60.0 to –90dB (–82.6±7.1dB), and –54.8 to –90dB (–80.6±8.9dB) along longitudinal, side-to-side, and dorsoventral axes. Again, no significant differences in BS were found among the three stimulus axes for the 61 saccular afferents (one-way ANOVA, P>0.05).
Frequency coding above threshold
At supra threshold, saccular afferents showed BS in the frequency range of 50–345Hz. Most saccular afferents (59%) had similar contours of frequency responses illustrated by terrain plots along the three orthogonal axes of fish (Fig.4). Others (41%) had different spatial frequency responses with a dominant response along one or two of the three stimulus axes. Fig.5 shows that response areas of saccular afferents vary in shape, tuning, and sensitivity among stimulus axes, indicating that frequency responses of these saccular afferents are stimulus-axis dependent.
BF distributions shown in Fig.6Ai,Bi,Ci illustrate that BF gradually shifts to high frequencies as stimulus level increases. However, none of the saccular afferents recorded had BF higher than 400Hz at stimulus levels up to 40dB above threshold along all three stimulus axes. BF shifts were found from 2 to 96Hz (46±12Hz; mean ± s.d.), from 7 to 107Hz (55±13Hz) and from 6 to 81Hz (38±11Hz) along the longitudinal, side-to-side and
dorsoventral axes at stimulus levels from 5 to 40dB above BS (Fig.6Aii,Bii,Cii). BFs increased significantly with stimulus level along each of the three stimulus axes (one-way ANOVA, P<0.001). Fig.7A shows frequency response profiles of a representative saccular afferent at several stimulus levels along a stimulus axis, indicating that both up and down slopes of these frequency–response curves appear to get steep at high stimulus levels. For the 61 saccular afferents recorded, average absolute values of rate–frequency slopes increased significantly with stimulus level at both low- and high-frequency ends (two-way ANOVA, up slopes, P<0.001; down slopes, P<0.001 for each axis). In addition, roll-off rates were significantly greater at the high-frequency end than at the low-frequency end along the three stimulus axes (Fig.7B–D, two-way ANOVA with replication, P<0.001 for each axis).
Q50%was used to represent the degree of tuning (Fig.8A). The
greater the Q50%, the higher the sharpness of a tuning curve. Fig.8B
shows average Q50%distributions of 1.46±0.71 (mean ± s.d., N35,
longitudinal axis), 1.36±0.78 (N37, side-to-side axis) and 2.25±1.12 (N29, dorsoventral axis) at 15dB above threshold. Average Q50%
decreased as stimulus level increased at the all three axes (two-way ANOVA, P<0.001; Fig.8C). Saccular afferents had similar Q50%
along the longitudinal and side-to-side axes but slightly greater Q50% along the dorsoventral axis than the other two axes (two-way
ANOVA without replication, P<0.001; Tukey’s tests, Q50% side-to-side
Q50% longitudinal, P>0.05; Q50% longitudinal⫽Q50% dorsoventral, P<0.05).
The down slope of isolevel rate–frequency curves was highly correlated with BF, and the correlation was stimulus-level dependent (Table1). Fig.9 shows the relationship between the down slope of
–35 –40
100 1000
–35
–40
–60
–100 –80
–40
–60
–100 –80 –40
–60
–100 –80
10 100 1000 10 100 1000
Stimulus frequency (Hz)
A
C
D
E
B
F
Thre
s
hold (dB re
. 1 g)
Fig.2. Tuning curves of six representative saccular afferents (A–F) along
the longitudinal (dotted lines), side-to-side (dashed lines) and dorsoventral (solid lines) axes of fish.
5 15 25 35
–100 –90 –80 –70 –60 –50 –40
0 10 20 30
50 80 100 125 200 250 345 400
Longitudinal axis Side-to-side axis
Dorsoventral axis
A
B
Characteristic frequency (Hz)
Best sensitivity (dB re. 1 g) *
N
u
m
b
er of
a
ff
erent
s
Fig.3. Distributions of characteristic frequency (CF; A) and best sensitivity
(BS; B) at the longitudinal, side-to-side and dorsoventral axes of fish for 61 saccular afferents. The asterisk in A indicates that the CFs are equal to or
isolevel rate–frequency curves and BF at several stimulus levels. However, the correlation between up slope and BF was relatively low along each of the three axes regardless stimulus levels (Table1).
DISCUSSION
Comparisons in frequency coding of saccular afferents in different species
Frequency tuning of auditory afferents in response to acoustic particle motion has only been studied in three teleost species (the toadfish, midshipman and sleeper goby). Because similar shaker
apparatuses were used to calibrate linear acceleration, we are able to compare frequency response characteristics in these species. CFs of saccular afferents in the toadfish fell into two groups: 81 and 140Hz (Fay and Edds-Walton, 1997). Saccular afferents in the midshipman had CFs in a range of ≤50–186Hz with two peaks at ≤50 and 100Hz (Weeg et al., 2002). In the present study (Fig.3A), we found that CFs of saccular afferents of the sleeper goby were distributed between ≤50 and 400Hz with a mode at ≤50Hz. The peaks of CF distributions are probably less than 50Hz because 50Hz is the lowest frequency we were able to provide –90
–70 –50
0 80 160 240
50 100
400 300 200
–90 –70 –50
50 100
400 300 200 0
80 160 240
Stimulus frequency (Hz) –90
–70 –50
50 100
400 300 200 0
80 160 240
Stimulus frequency (Hz)
–90 –70 –50
50 100
400 300 200 0
80 160 240
–90 –70 –50
50 100
400 300 200 0
80 160 240
S
pik
e
s
per
s
econd
–90 –70 –50
50 100
400 300 200 0
80 160 240
Ai
Bi
Aii
Bii
Aiii
Biii
Stim ulus
le vel (dB re
. 1 g)
Stim ulus
le vel (dB re
. 1 g)
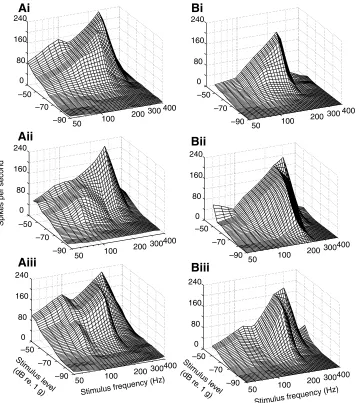
Fig.4. Terrain plots of frequency responses
[image:5.612.49.408.66.469.2]of two saccular afferents (left and right columns) to linear acceleration in a fish’s longitudinal (Ai, Bi), side-to-side (Aii, Bii), and dorsoventral (Aiii, Biii) axes, showing that each saccular fiber has similar frequency responses along the three orthogonal axes.
Table 1. Correlations between slope and best frequency at different stimulus levels along the longitudinal, side-to-side and dorsoventral axes of fish
Longitudinal axis Side-to-side axis Dorsoventral axis
Stimulus level*
(BF) Down slope Up slope Down slope Up slope Down slope Up slope
5dB –0.43 –0.19 –0.60 –0.07 –0.23 –0.33
15dB –0.65 –0.10 –0.54 –0.26 –0.69 –0.15
25dB –0.82 0.23 –0.85 –0.17 –0.67 –0.16
35dB –0.84 0.21 –0.87 0.08 –0.75 0.27
BF, best frequency. *Decibels above threshold.
[image:5.612.44.569.631.703.2]without stimulus waveform distortion. Our results suggest that in response to acoustic particle motion the saccules in the teleosts that do not possess accessory auditory structures have similar frequency selectivity.
No single-unit recording data are available from auditory afferents of non-teleost fishes. Thresholds have been obtained from two elasmobranchs in response to linear acceleration in a frequency range from 50 to 200Hz using an evoked potential method (Casper and Mann, 2007). Evoked potential audiograms of the sharks show that they are most sensitive to particle motion at 100Hz with the lowest threshold at approx. –80dBre.1g. It appears that frequency tuning and threshold of the sharks are similar to those of the teleosts described above. Similar physiological properties in the most sensitive frequency and BS are consistent with the lack of a swim bladder in the sharks, which are solely sensitive to particle motion. Frequency tuning of otolithic organ afferents in response to particle motion has not been reported on any fish that possess accessory auditory structures. Because the particle motion input pathway applies to all fishes with and without accessory auditory structures, low-frequency selectivity is most likely a common response characteristic of all fishes in response to particle motion.
In this study we collected frequency response data at threshold as well as supra threshold. Although the tuning curve provides CF, BS and Q10dBof afferents, it does not provide any information about
the frequency response at stimulus levels above threshold. We
believe that the frequency response above threshold is more biologically significant for animals than that at threshold. Therefore, in addition to tuning curves, we characterized frequency responses of saccular afferents using terrain plots and isolevel rate-frequency curves at stimulus levels up to 40dB above threshold (e.g. Figs4, 5 and Fig. 7A). We found that BFs of saccular afferents in the sleeper goby were stimulus-level dependent. As clearly shown in Fig.6, saccular afferents tend to shift tuning to high frequencies as stimulus level increases. BF shifts were previously reported for saccular afferents of the goldfish in response to sounds generated by an underwater loudspeaker (Fay, 1990). BF shifts of saccular afferents of the goldfish varied with CF (Lu and Fay, 1993). For goldfish saccular afferents with CFs below 500Hz, they tended to tune to high frequencies when sound level was presented at 15dB above BS. For the midshipman evidence of BF shifts was also reported for some saccular afferents in response to particle motion, although the majority of saccular afferents did not change BF with stimulus level (Weeg et al., 2002).
We hypothesized that the BF shift to high frequencies found in saccular afferents might reduce masking of the low-frequency background noise in order to enhance signal detection. Lugil and Fine (Lugil and Fine, 2007) reported particle velocity ambient noise in the habitat of an Italian freshwater goby, Padogobius martensii, which is in the same order (Perciformes) as the sleeper goby. Both gobies are primarily sensitive to the particle motion mode of sound. 0
80 160 240
50 100
200300400 –90
–70 –50
50 100
200300400
50 100
200300400 0
80 160 240 0 80 160 240
Ai
Bi
Ci
Aii
Bii
Cii
Aiii
Biii
Ciii
S
pik
e
s
per
s
econd
Stimulus frequency (Hz)
Stim ulus
le vel (dB re
. 1 g)
Fig.5. Terrain plots of frequency responses of three saccular afferents (left, middle, and right columns) to particle motion in a fish’s longitudinal (Ai, Bi, Ci),
It is known that auditory detection is ambient noise dependent. The ambient noise level in particle velocity in the Italian goby’s habitats is low, between 100 and 200Hz, the ‘quiet window’. The ambient noise level tends to increase below 100Hz and above 200Hz. The Italian goby appears to have evolved hearing sensitivity and vocalization that adapts to the quiet window in their habitats. In the present study, we found that most saccular afferents of the sleeper goby shifted their BFs to high particle motion frequencies up to 250Hz, showing the plasticity of frequency tuning of auditory afferents. It will be interesting to find out if BF shifts are related to the background noise in the sleeper goby’s habitats. Further studies of the ecology of the sleeper goby will help us understand the biological significance of BF shifts of auditory afferents in fish.
Comparisons in frequency coding among different otolithic organ afferents
We can make reliable comparisons in frequency coding among saccular, utricular and lagenar afferents in the sleeper goby because frequency response data have been collected from these afferents
in response to particle motion using the same experiment setup and method (Lu et al., 2003; Lu et al., 2004) (and the present study). Most saccular, lagenar and utricular afferents are sensitive to low-frequency particle motion with their CFs equal to or less than 200Hz. For the sleeper goby, saccules and lagenas are oriented vertically, whereas utricles lie in the horizontal plane. Based on the orientations of the otolithic organs (Lu and Popper, 1998), we compared CF distributions among saccular afferents [103±70Hz (mean ± s.d.) along the dorsoventral axis], lagenar afferents [74±23Hz along the dorsoventral axis (from Lu et al., 2003)], and utricular afferents [86±48Hz along the longitudinal axis (from Lu et al., 2004)]. We found no significant difference in CF among these otolithic organ afferents (one-way ANOVA, P>0.05). Therefore, all three otolithic organ afferents of the sleeper goby appear to be tuned to similar low frequencies.
However, there is a major difference in BS among the three otolithic organs afferents. We previously reported that at 100Hz saccular afferents of the sleeper goby are much more sensitive to particle motion than utricular and lagenar afferents (Lu et al., 2003; 0
20 40 5
15
25 0
10 20
30
40
5 15 25 5 15 25
0 20
40 0 20
40
N
u
m
b
er of
a
ff
erent
s
50 80
100 125 200 250 345 400
50 80
100 125 200
250 345 400 50 80
100 125 200 250
3
45
400
0 10 20
30
40
0 10 20
30
40
Best frequency (Hz) Stim ulus
level
(dB abov
e B S)
Ai
Bi
Ci
Aii
Bii
Stimulus level (dB above BS)
Av
er
a
ge BF
s
hift
Cii
0 40 80 120
0 10 20 30 40
0 10 20 30 40
0 10 20 30 40
0 40 80 120
0 40 80 120
Fig.6. Best frequency (BF) distributions at different stimulus levels (5–40dB above threshold) and average BF shift as a function of stimulus level along the
longitudinal (Ai and Aii), side-to-side (Bi and Bii), and dorsoventral (Ci and Cii) axes of fish for 61 saccular afferents, showing BF increases with stimulus
Lu et al., 2004). Here we compared BS in the range of particle motion frequencies from 50 to 400Hz of saccular (–81±9dBre.1g; mean ± s.d., N61), lagenar (–51±7dB, N29), and utricular (–52±7dB, N70) afferents. We found that there are significant differences in BS of these otolithic organ afferents (one-way ANOVA, P<0.05; Tukey’s tests, BSsaccular⫽BSlagenar, P<0.05,
BSsaccular⫽BSutricular, P<0.05, BSlagenarBSutricular, P>0.05).
Therefore, saccular afferents of the sleeper goby are ~30dB more
sensitive than lagenar and utricular afferents; lagenar and utricular afferents have similar BS. Based on these physiological results, we conclude that of the three otolithic organs, the saccule plays the most important role in hearing in the sleeper goby.
The degree of tuning of auditory afferents or neurons is often assessed by Q10 dB. Afferents with higher Q10 dBvalues are more
sharply tuned.Q10 dBvalues of saccular afferents have been reported
in the goldfish, showing that saccular afferents are broadly tuned with Q10 dBless than 2 (Fay and Ream, 1986). In this study we found
three different types of tuning curves for saccular afferents in the sleeper goby in response to the frequency range from 50 to 400Hz. As shown in Figs1 and 2, Q10 dB values of almost all saccular
afferents cannot be calculated for the following reasons. For lowpass 0
50 100 150 200 250 300 350
5 10 15 20 25 30 35 40
Upslope Downslope
B
0 50 100 150 200 250 300 350
D
R
a
te–fre
qu
ency
s
lope (
s
pik
e
s
per oct
a
v
e)
0 50 100 150 200 250 300 350
Stimulus level (dB above BS)
C
2000 40 80 120 160
10 100 500
–40 dB
–45
–50
–55
–60
–65
S
pik
e
s
per
s
econd
A
Stimulus frequency (Hz)
5 10 15 20 25 30 35 40
5 10 15 20 25 30 35 40
Fig.7. Rate–frequency curves at different stimulus levels of a saccular
afferent along the dorsoventral axis, showing up and down slopes (A). Average rate–frequency slope versus stimulus level functions along the longitudinal (B), side-to-side (C) and dorsoventral (D) axes of fish for 61 saccular afferents. Triangles and squares represent average down and up slopes of rate-frequency functions, respectively. Note negative numbers of down slopes are converted into absolute values in order to compare them with the average up slopes. Values are means ± s.e.m. in B, C and D.
Re
s
pon
s
e (%)
A
Stimulus frequency (Hz) 0
25 50 75 100
10 100 500
c
a b
d o
B
0 1 2 3 4
Stimulus level (dB above BS) 0
5 10 15 20 25
1 2 3 4 5
Q50%
Longitudinal axis Side-to-side axis
Dorsoventral axis
C
N
u
m
b
er of
a
ff
erent
s
Q50%
5 10 15 20 25 30 35 40
Fig.8. (A)Normalized isolevel rate–frequency curve of a representative
saccular afferent, showing how Q50%is measured. Q50%BF/ab1.16,
where BF (best frequency)200Hz, ocod, and ab is the frequency
bandwidth, 173Hz. (B)Distributions of Q50% at 15dB above threshold along
the longitudinal (black), side-to-side (white) and dorsoventral (gray) axes of
fish for 61 saccular afferents. (C)Mean Q50%(± s.e.m.) versus stimulus
tuning curves, CF and frequency bandwidth at 10dB above threshold could not be obtained because tuning curves often extend below 50Hz, the lowest frequency tested. For most bandpass and broad tuning curves, the frequency bandwidths at the 10dB above threshold were also not measurable. In addition, the shaker apparatus used in this study cannot provide reliable accelerations lower than 50Hz without waveform distortion. Thus, Q10 dB cannot be obtained in the
frequency range we tested for most of the saccular afferents in the sleeper goby. For these reasons, we adapted Q50% to quantitatively
evaluate the degree of tuning. We also calculated Q50%from data
in our previous studies on frequency tuning of lagenar and utricular afferents in the sleeper goby (Lu et al., 2003; Lu et al., 2004). Because Q50% values are stimulus-level dependent, caution was used
when comparing Q50% of otolithic organ afferents. At 15dB above
BS, Q50% values ranged from 0.67 to 3.58 (1.57±0.86; mean ± s.d.,
N25) along the longitudinal axis for lagenar afferents and 0.16 to 11.50 (2.04±1.55, N29) along the longitudinal and side-to-side axis for utricular afferents. There is no significant difference in the Q50%
of saccular, lagenar and utricular afferents of the sleeper goby (one-way ANOVA, P>0.05), indicating that the tuning of afferents innervating the three otolithic organs is similar, although the BS of these afferents varies significantly.
Frequency tuning versussound directionality
One interesting question is whether or not the saccule itself is capable of encoding particle motion frequencies in the three-dimensional space. Because calibration of linear acceleration
provided by the shaker apparatus is quite complicated, we only chose the longitudinal, side-to-side and dorsoventral axes of the fish’s body for the present study. We obtained frequency response properties of saccular fibers in response to particle motion along the three orthogonal axes. As shown by the results (e.g. Figs1, 2, 4 and 5), there is a diversity of frequency responses of individual saccular afferents. Although many saccular afferents show similar terrain plots along the three axes, other saccular afferents have different frequency responses along the three axes. By pooling the saccular afferents that were recorded, we did not find significant differences in CF and BS among the three stimulus axes, indicating that the saccule is capable of encoding particle motion frequencies in the three-dimensional space. However, we did observe a slight difference in tuning in different stimulus axes. The sleeper goby has better frequency tuning in the vertical axis than in the horizontal axes (Fig.8), which corresponds to the vertical orientation of the saccular epithelium and otolith. Because spatial frequency coding of otolithic organ afferents has not been investigated in other fish species, a comparison of different fishes cannot be made at this time.
Frequency selectivity versusisolevel rate-frequency slopes A previous study reported that the absolute value of average high-frequency roll-off rate (–36dBoctave–1) was 16 times the
low-frequency roll-off rate (12dBoctave–1) for saccular afferents in
the toadfish (Fay and Edds-Walton, 1997). We found similar asymmetrical rate–frequency curves for the majority of saccular
–750 –550 –350 –150 50
–750 –550 –350 –150 50
–750 –550 –350 –150 50
0 200 400
–750 –550 –350 –150 50
0 200 400 0 200 400
Best frequency (Hz)
Do
wn
s
lope (
s
pik
e
s
per oct
a
ve
)
Fig.9. Plots of down slope versus
BF at 5dB (first row), 15dB (second
row), 25dB (third row) and 35dB
afferents in the sleeper goby with the absolute value of average high-frequency roll-off rate greater than the average low-frequency roll-off rate along the longitudinal, side-to-side, and dorsoventral axes of fish (see Fig.7). For most saccular afferents of the sleeper goby, BF increased with stimulus level. However, for almost all saccular afferents BFs did not continue to increase beyond 250Hz regardless of stimulus level. Instead, saccular afferent responses fell dramatically at stimulus frequencies higher than 250Hz (see Figs4, 5, 7). It is not known what mechanisms result in this sharp response reduction at stimulus frequencies beyond 250Hz. This reduction of response could occur at the saccular hair cells and/or the saccular nerve. But the saccular nerve is unlikely to be the site because most nerves are capable of firing action potentials up to 1kHz as long as they possess adequate voltage gated Na+and K+
ion channels. We propose that such reduction results from intrinsic mechanical properties of otolithic organs, i.e. the coupling of the otolith and sensory epithelium may limit responses to low frequencies.
As shown in Fig.9 and Table1, at a given stimulus level, the down slope becomes steeper as BF increases. At a given BF, the steepness of the down slope increases as stimulus level raises. In general, correlations between down slope and BF are high with absolute values of correlation coefficients greater than 0.5 at stimulus levels from 15 to 35dB above threshold along all three axes. The saccular afferent responses are limited to stimulus frequencies below 250Hz because of this increase in roll-off rate with BF and stimulus level at the high-frequency edge. The rate–frequency slope at the low-frequency end may be explained by firing rates at stimulus frequencies between 50 and 250Hz. In the range of stimulus levels from threshold to ~20dB above threshold, the up slope of isolevel rate–frequency curves increases with stimulus level for all three axes (see Fig.7B–D). The up slope does not continue to increase with stimulus level, i.e. the up-slope reaches a plateau at 20dB above threshold and beyond. We already know that saccular afferents in the sleeper goby as well as other teleosts are phase-locked to tonal particle motion at low frequencies (Lu et al., 1998; Lu and Popper, 2001). As stimulus level increases, the up slope also increases until 20dB above threshold where saccular afferent responses are saturated because of the maximum capacity of firing a spike per stimulus cycle. In addition, saccular afferents are able to fire more than one spike per cycle at frequencies below 100Hz when intense stimuli are presented. These two factors limit the up slope of isolevel rate–frequency to the slope of one spike per cycle at the low frequency range from 50 to 250Hz.
Conclusions
This is the first study to investigate spatial frequency coding of otolithic organ afferents in any fish species. It is also one of a few single-unit studies on frequency selectivity of auditory afferents of teleosts in response to simulated underwater particle motion. In this study we determined the frequency response of saccular afferents of the sleeper goby, not only at threshold (i.e. tuning curves) but also up to 40dB above threshold. Like other fishes without accessory auditory structures, saccular afferents of the sleeper goby are tuned to low frequencies, primarily lower than 250Hz. Although the tuning curves of individual saccular afferents vary along the three orthogonal axes, there are no significant differences in CF and BS of the three axes, indicating that the saccule is able to encode particle motion frequencies in three-dimensional space. Saccular afferents are significantly more sensitive than lagenar and utricular afferents though the three otolithic organ afferents are tuned to similar
low-frequency particle motion. We conclude that the saccule is the major auditory organ of the three otolithic organs in the sleeper goby and the low-frequency tuning is a common feature shared by fishes without accessory auditory structures.
LIST OF ABBREVIATIONS
BF best frequency BS best sensitivity CF characteristic frequency
ACKNOWLEDGEMENTS
This work was supported by grant R01DC03275 from the National Institute on Deafness and Other Communication Disorders of the National Institutes of Health, University of Miami start-up funds, and a Gabelli Fellowship from the College of Arts and Science at the University of Miami. An anonymous reviewer provided helpful comments on the manuscript. Alex Desmidt helped plot Figs1 and 2. Deposited in PMC for release after 12 months.
REFERENCES
Bass, A. H.(1990). Sounds from the intertidal zone: vocalizing fish. Bio-science40, 249-258.
Bass, A. H. and Lu, Z.(2007). Neural and behavioral mechanisms of audition. In Sensory Systems Neuroscience (Fish Pysiology Series), Volume 25 (ed. T. J. Hara and B. S. Zielinski), pp. 377-410. Maryland Heights, MO, USA: Elsevier Academic Press.
Buchser, W. J., Lu, Z., Xu, Z. and Evoy, W. H.(2003). Frequency response of saccular afferents in a teleost fish. Soc. Neurosci. Abstr.93, 7.
Casper, B. M. and Mann, D. A.(2007). The directional hearing abilities of two species of bamboo sharks. J. Exp. Biol. 210, 505-511.
Coombs, S. and Fay, R. R.(1987). Response dynamics of goldfish saccular fibers: effects of stimulus frequency and intensity on fibers with different tuning, sensitivity, and spontaneous activity.J. Acoust. Soc. Am. 81, 1025-1035.
Fay, R. R.(1978). Coding of information in single auditory-nerve fibers of the goldfish. J. Acoust. Soc. Am. 63, 136-146.
Fay, R. R.(1984). The goldfish ear codes the axis of acoustic particle motion in three dimensions. Science225, 951-954.
Fay, R. R.(1990). Suppression and excitation of auditory nerve fibers of the goldfish, Carassius auratus. Hear. Res. 48, 93-110.
Fay, R. R. and Ream, T. J.(1986). Acoustic response and tuning in saccular nerve fibers of the goldfish (Carassius auratus). J. Acoust. Soc. Am. 79, 1883-1895.
Fay, R. R. and Edds-Walton, P. L.(1997). Diversity in frequency response properties of saccular afferents of the toadfish, Opsanus tau. Hear. Res. 113, 235-246.
Fine, M. L. and Mosca, P. J.(1995). A Golgi and horseradish peroxidase study of the sonic motor nucleus of the oyster toadfish. Brain Behav. Evol. 45, 123-137.
Furukawa, T. and Ishii, Y.(1967). Neurophysiological studies on hearing in goldfish. J. Neurophysiol. 30, 1377-1403.
Gary, G. A. and Winn, H. E.(1961). Reproductive ecology and sound production of the toadfish, Opsanus tau. Ecology42, 274-282.
Horner, K., Hawkins, A. D. and Fraser, P. J.(1981). Frequency characteristics of primary auditory neurons from the ear of the cod, Gadus morhua. In Hearing and Sound Communication in Fishes (ed. W. N. Tavolga, A. N. Popper and R. R. Fay), pp. 223-241. New York: Springer-Verlag.
Lu, Z.(2004). Neural mechanisms of hearing in fishes. In The Senses of Fishes: Adaptations for the Reception of Natural Stimuli (ed. G. von der Emde, J. Mogdans and B. G. Kapoor), pp. 147-172. New Delhi, India: Narosa Publishing House.
Lu, Z. and Fay, R. R.(1993). Acoustic response properties of single units in the torus semicircularis of the goldfish, Carassius auratus. J. Comp. Physiol. A173, 33-48.
Lu, Z. and Fay, R. R.(1996). Two-tone rate interaction of primary afferents and midbrain neurons of the goldfish, Carassius auratus. Aud. Neurosci. 2, 257-273.
Lu, Z. and Popper, A. N.(1998). Morphological polarizations of sensory hair cells in the three otolithic organs of a teleost fish: fluorescent imaging of ciliary bundles. Hear. Res. 126, 47-57.
Lu, Z. and Popper, A. N.(2001). Neural response directionality correlates of hair cell orientation in a teleost fish. J. Comp. Physiol. A187, 453-465.
Lu, Z. and Xu, Z.(2002). Effects of saccular otolith removal on hearing sensitivity in the sleeper goby (Dormitator latifrons). J. Comp. Physiol. A 188, 595-602.
Lu, Z., Popper, A. N. and Fay, R. R.(1996). Behavioral detection of acoustic particle motion by a teleost fish (Astronotus ocellatus): sensitivity and directionality. J. Comp. Physiol. A179, 227-233.
Lu, Z., Song, J. and Popper, A. N.(1998). Encoding of acoustic directional information by saccular afferents of the sleeper goby, Dormitator latifrons. J. Comp. Physiol. A182, 805-815.
Lu, Z., Xu, Z. and Buchser, W. J.(2003). Acoustic response properties of lagenar nerve fibers in the sleeper goby, Dormitator latifrons. J. Comp. Physiol. A 190, 923-938.
Lu, Z., Xu, Z. and Buchser, W. J.(2004). Coding of acoustic particle motion by utricular fibers in the sleeper goby, Dormitator latifrons. J. Comp. Physiol. A 189, 889-905.
Lugil, M. and Fine, M. L.(2007). Stream ambient noise, spectrum and propagation of sounds in the goby Padogobius martensii: Sound pressure and particle velocity. J. Acoust. Soc. Am. 122, 2881-2892.
McCormick, C. A. and Popper, A. N.(1984). Auditory sensitivity and psychophysical tuning curves in the elephant nose fish, Gnathonemus petersii. J. Comp. Physiol. A
McKibben, J. R. and Bass, A. H.(1999). Peripheral encoding of behaviorally relevant acoustic signals in a vocal fish: single tones. J. Comp. Physiol. A184, 563-576.
McKibben, J. R. and Bass, A. H.(2001). Peripheral encoding of behaviorally relevant acoustic signals in a vocal fish: harmonic and beat stimuli. J. Comp. Physiol. A187, 271-285.
Popper, A. N. and Fay, R. R.(1999). The auditory periphery in fishes. In Comparative Hearing: Fish and Amphibians (ed. R. R. Fay and A. N. Popper), pp. 43-100. New York: Springer-Verlag.
Popper, A. N., Roger, P. H., Saidel, W. M. and Cox, M.(1988). Role of the fish ear in sound processing. In Sensory Biology of Aquatic Animals (ed. J. Atema, R. R. Fay, A. N. Popper and W. N. Tavolga), pp. 687-710. New York: Springer-Verlag.
Sand, O.(1974). Directional sensitivity of microphohic potentials from the perch ear. J. Exp. Biol. 60, 881-899.
Schellart, N. A. M.(1995). Two-dimensional vibrating platform in nm range. Med. Biol. Eng. Comput. 33, 217-219.
Sisneros, J. A., Forlano, P. M., Deitcher, D. L. and Bass, A. H.(2004). Steroid-dependent auditory plasticity leads to adaptive coupling of sender and receiver. Science305, 404-407.
Suzuki, A., Kozloski, J. and Crawford, J. D.(2002). Temporal encoding for auditory computation: physiology of primary afferent neurons in sound-producing fish. J. Neurosci. 22, 6290-6301.