RESEARCH ARTICLE
The implications of reduced metabolic rate in resource-limited
corals
Lianne M. Jacobson1,2,*, Peter J. Edmunds1, Erik B. Muller3and Roger M. Nisbet4
ABSTRACT
Many organisms exhibit depressed metabolism when resources are limited, a change that makes it possible to balance an energy budget. For symbiotic reef corals, daily cycles of light and periods of intense cloud cover can be chronic causes of food limitation through reduced photosynthesis. Furthermore, coral bleaching is common in present-day reefs, creating a context in which metabolic depression could have beneficial value to corals. In the present study, corals (massive Poritesspp.) were exposed to an extreme case of resource limitation by starving them of food and light for 20 days. When resources were limited, the corals depressed area-normalized respiration to 37% of initial rates, and coral biomass declined to 64% of initial amounts, yet the corals continued to produce skeletal mass. However, the declines in biomass cannot account for the declines in area-normalized respiration, as mass-specific respiration declined to 30% of the first recorded time point. Thus, these corals appear to be capable of metabolic depression. It is possible that some coral species are better able to depress metabolic rates than others; such variation could explain differential survival during conditions that limit resources (e.g. shading). Furthermore, we found that maintenance of existing biomass, in part, supports the production of skeletal mass. This association could be explained if maintenance supplies needed energy (e.g. ATP) or inorganic carbon (i.e. CO2) that otherwise limits
the production of skeletal mass. Finally, the observed metabolic depression can be explained as a change in pool sizes, and does not require a change in metabolic rules.
KEY WORDS: Scleractinia, Respiration,Poritesspp., Resource limitation, Starvation, Metabolic depression
INTRODUCTION
Metabolic depression is a widely observed phenomenon in which organisms reduce metabolic rate in response to certain environmental stressors (Guppy and Withers, 1999; Hand and Hardewig, 1996). Many biochemical patterns, such as decreases in intracellular pH and protein synthesis, are common to cases of metabolic depression (Guppy and Withers, 1999). Metabolism primarily is depressed by decreasing processes that supply cellular energy and, to a lesser degree, by decreasing processes that use cellular energy (Guppy, 2004). Changes in energy use are evidenced by changes in ion pumping, protein turnover and gene transcription, whereas changes in energy production are evidenced by changes in mitochondrial oxidation (Staples and Buck, 2009).
Metabolic depression typically is described by the ratio between depressed and resting metabolic rate (Guppy and Withers, 1999). There are multiple ways to categorize the type of metabolic depression that is observed. For example, the extent of the metabolic depression could be extreme (to <5% of resting metabolic rate) or moderate (to 5–40% of resting metabolic rate) (Guppy and Withers, 1999). Additionally, metabolic depression can be categorized by the stimulus, for example hypoxia versus resource limitation (herein used to describe a limitation of food and carbon supplies). Finally, the timing of the response relative to the stimulus is a common categorization, and cases of metabolic depression that occur in anticipation of a stimulus are termed intrinsic or active (Guppy, 2004; Guppy and Withers, 1999). Cases of intrinsic metabolic depression are often moderate in extent and can occur in response to resource limitation or any other stimulus that does not alter the sub-cellular environment (e.g. intrasub-cellular water content or solute concentrations) (Guppy and Withers, 1999).
When food resources are limited, organisms often lose biomass and reduce metabolic rates through biochemical or behavioral (e.g. reduced activity) changes (McCue, 2010). Thus, when organisms experience regular bouts of food limitation, it is likely that they can actively depress metabolic rates as a strategy to prolong the supply of energy reserves. It is possible that some reef-building corals are food limited on a chronic basis, particularly in highly turbid environments, in deep water and during prolonged periods of heavy rain that restrict underwater light intensity. Corals acquire food resources from their algal symbionts (Symbiodinium spp.) and by removing zooplankton, detritus, dissolved organic matter and bacteria from seawater (Falkowski et al., 1984; Goreau et al., 1971). Through photosynthesis,Symbiodiniumspp. can supply the majority (63–69% for two species) of a coral’s carbon needs in shallow water (Muscatine et al., 1981). Chronic changes in light availability (e.g. night-time, long periods of cloud cover, smothering by sand or other sediments) drive fluctuations in photosynthesis (Chalker et al., 1983; Falkowski et al., 1990), and thus the associated supply of carbon to the cnidarian host. In addition to these chronic patterns, corals experience acute and severe resources limitation when the supply of photosynthetically derived carbon is largely halted following substantial reductions in the density of Symbiodinium (i.e. when corals bleach) (Lesser, 2011). Without the supply of autotrophic carbon resources, bleached corals can lose biomass (Rodrigues and Grottoli, 2007). The ability to depress metabolism could become increasingly important as the frequency and geographic extent of resource limitation due to bleaching increases as tropical seas warm (Frieler et al., 2012).
Phenotypic responses to the supply of food resources have been studied in scleractinians for decades (Franzisket, 1970; Porter, 1976; Rodrigues and Grottoli, 2007; Anthony and Fabricius, 2000). Furthermore, metabolic plasticity in scleractinians is well known, with large changes in respiration in response to changes in Received 9 December 2015; Accepted 14 January 2016
1
Department of Biology, California State University, Northridge, CA 91330, USA. 2
Department of Biology, University of Florida, Gainesville, FL 32611, USA.3Marine Science Institute, University of California, Santa Barbara, CA 93106, USA. 4
Department of Ecology, Evolution and Marine Biology, University of California, Santa Barbara, CA 93106, USA.
*Author for correspondence (LianneJacobson@ufl.edu)
Journal
of
Experimental
temperature (Coles and Jokiel, 1977), depth (Kawaguti, 1937), seawater flow speed (Patterson et al., 1991), light intensity (Kühl et al., 1995) and food supply (Titlyanov et al., 2001). In the present study, we further investigated the association between respiration and food supply. Specifically, after 30 days of food and light starvation, Stylophora pistillata depressed respiration to 17% of initial rates (Titlyanov et al., 2001). However, Titlyanov et al. (2001) did not test for the implications of reduced respiration (e.g. for the supply and allocation of metabolic energy, or changes in survivorship or fecundity), nor did they determine whether the reduced oxygen consumption was due to loss of biomass or a reduction in mass-specific respiration. Despite this long history of measuring the respiration of tropical reef corals under different conditions, little attention has been accorded to the implications of variation in metabolic rate.
The goals of this study were to: (1) determine whether corals are capable of metabolic depression (i.e. a mass-specific reduction in respiration); and, should metabolic depression be detected, (2) infer implications of metabolic depression using a holistic modeling approach employing dynamic energy budgets (DEB) (Kooijman, 2010). To test for the ability to depress metabolism, corals were starved to provide an extreme case of resource limitation. A DEB model was used to evaluate the causes and implications of changes in metabolism. DEB theory (Kooijman, 2010) is an attractive framework within which the present analysis can be couched, as it has already been modified to embrace the physiological complexity of a symbiosis between scleractinian corals and their dinoflagellate symbionts,Symbiodiniumspp. (Edmunds et al., 2011; Eynaud et al., 2011; Muller et al., 2009), and thus, for the present application we needed only to extend the theory to consider calcification.
DEB model
There is ample support for DEB theory as a general framework to describe broad patterns in organismal energy expenditure, as is illustrated by the model parameterization for over 350 species from a wide variety of taxa (AddMyPet Database: www.bio.vu.nl/thb/deb/ deblab/), including scleractinian corals (Edmunds et al., 2011; Muller et al., 2009). We used the DEB framework of Kooijman (Kooijman, 2010; Muller et al., 2009; Nisbet et al., 2000; Sousa et al., 2008) to explore the implications of resource limitation on biomass (mmol C cm−2), respiration rate (µmol O
2cm−2day−1) and skeletal mass (mmol CaCO3 cm−2) in a tropical coral. Biomass directly relates to model state variables, notably structural and reserve biomass. Structural biomass is the minimum amount of biomass needed to perform the vital functions in an organism of a given size. Reserve biomass consists of traditional storage products like lipids, and metabolically active biomass that may be sacrificed without loss of viability. Mass balance constraints and DEB core assumptions imply how DEB-defined processes, including growth and maintenance, determine the rates of respiration (Hanegraaf and Muller, 2001; Kooijman, 2010) and calcification (Muller and Nisbet, 2014). Herein, we distinguish growth from calcification because growth refers to an increase in metabolically active structural biomass, whereas calcification refers to the increase in skeletal mass.
Because corals were starved by removing heterotrophic food resources from the seawater and keeping them in darkness, we infer that their metabolism was supported through the catabolism of reserve biomass (Fig. 1). To facilitate the analyses, we do not consider the contribution of the symbiont to holobiont metabolism, and assume that the allocation of reserve biomass to reproduction is negligible in starving juvenile corals. The derivation of model
equations that were fitted to the data can be found in the Appendix (see Eqns A4, A8 and A12; see also Table 1).
DEB theory aggregates the large number of metabolites and macromolecules present in organisms to a small number of‘pools’, such as structural biomass and reserve biomass.‘Metabolic rules’ set priorities in energy and nutrient expenditure and determine the magnitude of the fluxes between pools. In this context, if metabolic depression is an unavoidable consequence of stress, these metabolic rules would remain unaltered, and observed changes in organismal performance would be due to changes in pool sizes. However, if metabolic depression is an explicit survival strategy, changes in metabolic rules would be expected in addition to changes in pool sizes. Given the widespread support of DEB theory (AddMyPet Database), we sought to understand whether a simple (i.e. null) model, in which reduced metabolic rate is a consequence of changing pool sizes, is sufficient to explain any observed metabolic depression. If the simple model is insufficient, then we would suggest that additional research is required to determine how metabolic rules change during resource limitation, reflecting a survival strategy.
MATERIALS AND METHODS
We worked with small colonies of massivePoritesspp., a functional group with unresolved taxonomy (Forsman et al., 2009) that is ecologically important and common on shallow reefs throughout the Indo-Pacific (Done and Potts, 1992), and consists ofP. lobata
(Dana 1846) andP. lutea(Quoy and Gaimard 1833). We collected juvenile colonies (<40 mm diameter) of massivePoritesspp. from the back reef (2–3 m depth) on the north shore of Moorea, French Polynesia. We collected corals twice, a few days prior to each trial, which began on 17 April 2010 (trial 1) and 8 May 2010 (trial 2). We chose massivePoritesspp. for this study because: (i) members of this functional group have a thick tissue layer (Edmunds, 2009), and (ii) properties of coral tissue vary seasonally (Fitt et al., 2000) and are responsive to treatments including light, temperature and food supply (Edmunds, 2009, 2011). Therefore, we reasoned that starvation-induced changes in biomass would be relatively easy to
Reproduction
Catabolism
Growth
Somatic maintenance
Maturity maintenance
Dissipation
Calcification
Dissipation
1–κ
Gonads
Reserves
Structural biomass
[image:2.612.315.563.55.190.2]κ
Fig. 1. Energy flows in a starving mature heterotroph in the standard representation of dynamic energy budget (DEB) theory.See Kooijman (2010) and Sousa et al. (2008). A fixed fractionκof the catabolic flux is used for somatic maintenance and growth; the remaining (1−κ) fraction is used for reproduction and maturity maintenance (maintenance fluxes take priority over reproduction fluxes). In this paper, energy allocation to reproduction is assumed negligible and dissipative fluxes due to somatic and maturity maintenance are grouped in a generalized maintenance flux (κ=1). The net allocation of energy and resources to calcification is the sum of a contribution of growth and maintenance; these contributions are proportional to the magnitude of the respective fluxes (Muller and Nisbet, 2014). Likewise, respiration (here oxygen consumption) is a weighted sum of the maintenance and growth fluxes (with proportionality factors set by mass and energy balance constraints).
Journal
of
Experimental
detect and serve as a measure of treatment effects. Furthermore, the use of juvenile colonies (assumed to be <4 cm diameter, based on data for another species of the same genus; Soong, 1993) simplified the application of DEB theory (because allocation to reproduction could be ignored).
Following collection, we mounted each coral in a small disc (∼2 cm radius, 1 cm thick) of epoxy (Z-Spar A788, West Marine, Watsonville, CA, USA), molded to keep the coral nubbin upright and to fit snuggly into a custom-made respiration chamber. We allowed freshly prepared nubbins to acclimate to laboratory conditions (running seawater, pumped from the adjacent fringing reef ) for∼24 h prior to experimentation. Immediately after the first collection, we sampled 16 corals for initial estimates of respiration (N=8) and biomass (N=8), which served as a benchmark against which the effects of the treatments were compared. At the start of both trials, we recorded the buoyant weight of each coral (±1 mg; Davies, 1989).
Treatments: duration of starvation
We conducted two consecutive trials of a similar experiment. The two trials increased replication, and thus the possibility of detecting the effects of starvation. Logistical constraints prevented us from conducting a single experiment with a larger number of replicate corals and multiple treatments of starvation duration. The two trials employed the same starvation conditions to elicit a metabolic response, but the results of the first trial motivated sampling with an increased temporal resolution in the second trial. Every 4 days during the first trial and every 2 days during the second trial, we determined the respiration, biomass and skeletal mass of 6 corals to evaluate the response to different durations of starvation (i.e. treatments). We conducted both trials in tanks containing∼45 l of seawater; during trial 1, an acrylic aquarium (100 l) was used, and in trial 2, an insulated aquarium (50 l) was used. Pumps (ViaAqua VA-1380, 1380 l h−1, Commodity Axis Inc., Camarillo, CA, USA; and Rio 8HF Hyper Flow, 2079 l h−1, TAAM, Camarillo, CA, USA) circulated the enclosed seawater, to maintain the air saturation of the seawater (i.e.∼21% O2 as assessed with a fiber optic O2 electrode; Foxy-R/Foxy-AF, Ocean Optics, Dunedin, FL, USA). We maintained the temperature of the seawater in the tanks at the mean ambient temperature of seawater in the back reef of Moorea in April when the experiment was completed (29.40±0.06°C, mean±s.e., N=39), and we measured seawater temperature 2–3 times daily using a certified thermometer (YSI series 400 probe, ±0.05°C accuracy, cat. no. 15-077-8, Fisher Scientific, Waltham, MA, USA).
To starve the corals of autotrophic and heterotrophic food resources, we covered the tanks in black plastic to exclude light, and filtered seawater (0.2 µm final pore size in fiberglass/ polypropylene pleated filters; Heyes Filters, Torrance, CA, USA) to exclude particulate food. The pore size of the filters was small enough to remove bacteria (Gasol et al., 1995), and filtration was enhanced by first sterilizing the seawater (Current USA Gamma UV Sterilizer, 8 W T5 lamp; G. Heyes, personal communication). Furthermore, we reduced the concentration of dissolved organic materials (normally, total organic carbon is ∼37 mmol l−1 and particulate organic carbon is∼3 mol l−1in near-shore seawater in Moorea; Alldredge and Carlson, 2013) by passing the seawater through a column filled with granules of activated carbon (Boyd, Chemi Pure Elite). Once daily, we replaced∼30% of the seawater within the tank with seawater freshly collected offshore and filtered as described above.
Response variables
[image:3.612.48.568.69.202.2]We assessed the metabolic rate of corals by measuring dark respiration, which was recorded using an acrylic chamber (0.285 l), containing a magnetic stir bar to create water motion. Located marginally within the chamber, the coral received radial flow at ∼3.5±0.3 cm s−1(mean±s.e.,N=9), as estimated by photographing brine shrimp eggs (Bruno and Edmunds, 1998). A water jacket and chiller (RE106 and E100, Lauda Brinkmann, Delran, NJ, USA) maintained the temperature (29.0°C) of the filtered seawater (0.2 µm) that filled the chamber. An oxygen probe (Foxy-R/Foxy-AF, Ocean Optics) that functioned with a spectrophotometer (USB2000, Ocean Optics) continually recorded the partial pressure of O2 in the chamber. We calibrated the probe using a two-point calibration with water-saturated air and a saturated solution of sodium sulfite (NaSO3) in 0.01 mol l−1 sodium tetraborate (Na2B4O7) as the 21% and 0% O2saturation standards, respectively. We calculated O2concentrations from O2saturation using tabulated values (García and Gordon, 1992) for solubility of O2as a function of temperature and salinity. We measured salinity with a conductivity meter (YSI 3100, Yellow Springs, OH, USA). Each coral was incubated in the respiration chamber for 15–60 min, or until O2saturation decreased≥5%, but never fell below 85% to avoid hypoxia, which could affect respiration (Edmunds and Davies, 1986). We quantified the respiration rate of a coral as the difference between the O2depletion in a chamber containing a coral and filtered seawater and the rate of oxygen depletion in a chamber containing only filtered seawater. We estimated the surface area of coral tissue using aluminium foil (Marsh, 1970), and then
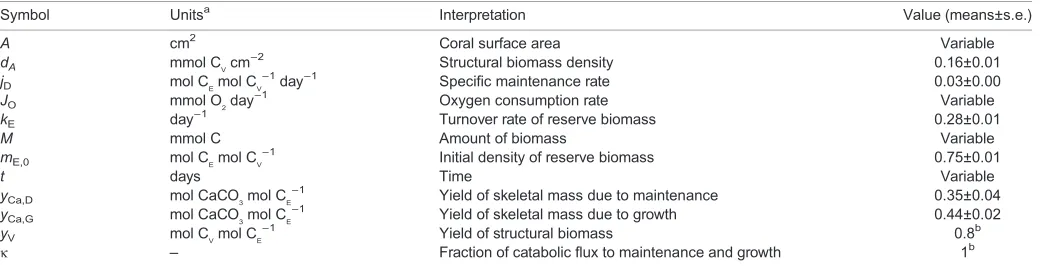
Table 1. Symbols and parameter values
Symbol Unitsa Interpretation Value (means±s.e.)
A cm2 Coral surface area Variable
dA mmol CVcm
−2
Structural biomass density 0.16±0.01
jD mol CEmol CV
−1
day−1 Specific maintenance rate 0.03±0.00
JO mmol O2day−1 Oxygen consumption rate Variable
kE day−
1
Turnover rate of reserve biomass 0.28±0.01
M mmol C Amount of biomass Variable
mE,0 mol CEmol CV
−1
Initial density of reserve biomass 0.75±0.01
t days Time Variable
yCa,D mol CaCO3mol CE
−1
Yield of skeletal mass due to maintenance 0.35±0.04
yCa,G mol CaCO3mol CE
−1
Yield of skeletal mass due to growth 0.44±0.02
yV mol CVmol CE
−1
Yield of structural biomass 0.8b
κ – Fraction of catabolic flux to maintenance and growth 1b
aSubscript‘V’refers to structural biomass; subscript‘E’refers to reserve biomass. b
From Muller et al. (2009).
Journal
of
Experimental
standardized respiration rates by that surface area (µmol O2cm−2day−1).
We measured biomass by preserving corals in 5% formalin for 24 h, then dissolving their skeletons in 10% hydrochloric acid over ∼24–48 h. Decalcification was completed outdoors because of the possible formation of carcinogenic gas when hydrochloric acid is mixed with formalin (Davies, 1980). We rinsed decalcified tissue tunics in freshwater and removed fouling organisms (e.g. algae) with forceps, then dried the tunics to a constant mass at 60°C. Dry mass was converted to carbon mass, assuming 0.442 mol C g−1 (Muller et al., 2009; see Appendix for details).
Following different durations of starvation (i.e. the treatments), we again recorded the buoyant weight of the corals, and used the difference from the initial buoyant weight to calculate calcification. While recording the buoyant weight, we kept the seawater at ambient temperature (29°C) and suspended the corals from monofilament thread attached to a top-loading balance (PB153-S, ±1 mg, Mettler Toledo, Columbus, OH, USA). We converted the change in buoyant weight to a change in skeleton dry mass based on empirically determined seawater density and the density of aragonite (2.93 g cm−3; Davies, 1989), and skeletal mass was converted to mol CaCO3cm−2using the molecular mass of CaCO3.
Analysis
The results for each trial were first analyzed in an inferential framework to test for effects of the treatment (starvation duration). Data were linearized (square-root transformed) to meet ANCOVA model assumptions and the effect of starvation duration, trial and the interaction were compared. Non-significant factors were iteratively removed from the analysis (model 1: starvation duration, trial, starvation duration by trial; model 2: starvation duration, trial; model 3: starvation duration). Second, the DEB model was used to obtain a more holistic interpretation of the cause and implications of metabolic depression. As the dataset for each trial was too sparse to estimate parameter values (i.e. the numerical optimization algorithms failed to converge), the data of the two sets were pooled. Parameters (Eqns A4, A8 and A12) were estimated from the results of the starvation trials, with the assumption that deviations from the DEB model are the result of normally distributed errors. The squared residuals in the minimization procedure were weighted with the inverse of the measured variance at each time point, except for the mean respiration rate on day 16 of the starvation experiment and the mean amount of CaCO3deposited at day 2 of the starvation experiment. The squared residuals of these two outliers were weighted with the inverse of the mean of the respective variances measured at each time point. The mean relative error (MRE) is used as a goodness-of-fit measure.
RESULTS
First, we described the empirical response to resource limitation through changes in respiration (on both area- and mass-normalized scales), biomass and calcification. Second, we used the DEB model to describe the relative changes in growth (i.e. increases in structural biomass) and maintenance, and the associated production of skeletal mass.
All corals were medium-to-dark tan or purple (the common color morphs of massivePoritesspp. in Moorea) at the start of both trials, and for the first 24 h of starvation, they continued to extend their tentacles at dusk. However, after 24 h of starvation, tentacle extension ceased and the corals gradually became pale in color. At the end of both trials, the tissue had become translucent, and revealed white skeleton beneath. Coral tissue was barely visible at
the end of the trials, but microscopic inspection (10× magnification) revealed tissue stretched over the skeleton, confirming that the corals were still alive.
Detecting metabolic depression: empirical response
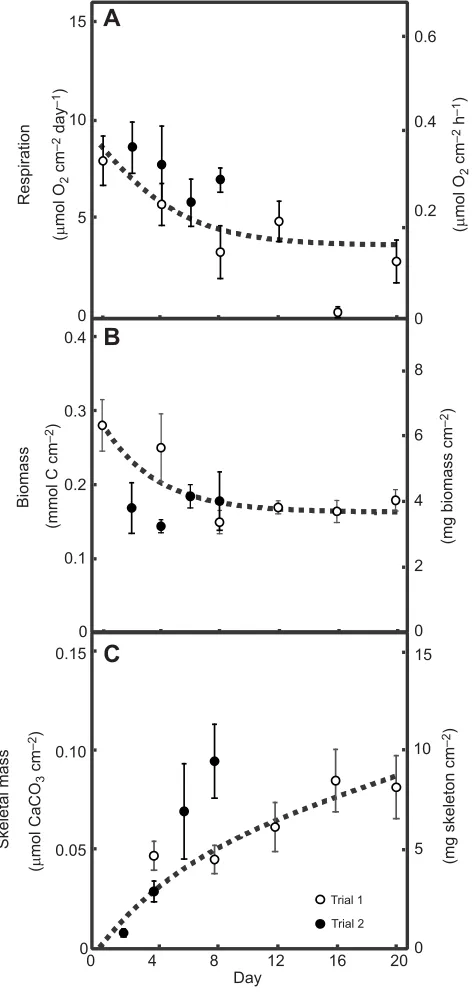
Mean respiration rate (Fig. 2A) of freshly collected corals was 8.0±1.2 µmol O2cm−2day−1(mean±s.e.,N=8), and after 20 days of starvation, respiration was reduced to 37% of the rate prior to
A
B
C
1510
5
0 0.4
0.3
0.2
0.1
0 0.15
0.10
0.05
0
0.6
0.4
0.2
8
6
4
2
0 15
10
5
0 0
0 4 8 12 16 20
Day
(
μ
mol O
2
cm
–2
day
–1
)
(mmol C cm
–2
)
(
μ
mol CaCO
3
cm
–2
)
(
μ
mol O
2
cm
–2
h
–1
)
(mg biomass cm
–2
)
(mg skeleton cm
–2
)
Respiration
Biomass
Skeletal mass
Trial 1
[image:4.612.321.557.163.660.2]Trial 2
Fig. 2. Coral response to resource limitation.The dynamics of (A) respiration (N=6–11), (B) biomass (N=5–12) and (C) skeletal mass (N=5–12) for juvenile massivePoritesspp., prior to (0 day) and during starvation (lasting 2, 4, 6, 8, 10, 12, 16 or 20 days). All metrics are standardized to surface area, and values are reported as means±s.d. The left ordinate shows units used in DEB analysis, the right ordinate shows units more traditionally used by coral scientists. The dashed lines illustrate the DEB model fit (see Appendix Eqns
A4, A8 and A12).
Journal
of
Experimental
starvation (0 days). Importantly, the depressed respiration rate cannot be accounted for by the reduction in biomass, as the mass-specific respiration rate (µmol O2mmol C day−1) also declined, and after 20 days of starvation it was 30% of the rate after 2 days of resource limitation (the first recorded time point). Resource limitation significantly reduced respiration rate standardized by biomass (P<0.001, F1,49=−4.19) and surface area (P<0.001,
F1,57=27.59). In either case, there was no significant effect of trial (standardized by biomass:P=0.332,F3,47=1.000; standardized by surface area: P=0.164, F3,55=1.99), nor was there a significant interaction between trial and length of resource limitation (standardized by biomass:P=0.553,F3,47=0.357; standardized by surface area:P=0.716,F3,55=0.134).
Mean biomass of freshly collected corals was 0.28±0.03 mmol C cm−2, and after 20 days of starvation, biomass was reduced to 64% of the initial amount ( prior to starvation, 0 day) (Fig. 2B). Biomass significantly declined during resource limitation (P=0.006,
F2,57=8.24). While biomass significantly differed between trials (P=0.006,F2,57=8.02), the biomass response to resource limitation did not differ between trials (i.e. the trial×starvation duration interaction: P=0.180, F3,56=1.845). During both trials, starved corals produced skeletal mass (0.08 mmol CaCO3 cm−2 after 20 days in trial 1, and 0.09 mmol CaCO3cm−2after 8 days in trial 2; Fig. 2C); however, the extent of the calcification response to resource limitation differed between trials (i.e. the trial×starvation duration interaction:P<0.001,F3,48=24.498).
Interpreting metabolic depression: model fitting
The relative values of the parameters estimated from the DEB model provide insight into the implications of shifts in energy allocation during starvation. Four parameters (Table 1) were assigned constant values (see Appendix for details). The DEB model fitting suggests that after 8–12 days of starvation: (1) energy is invested only in maintenance, with none allocated to the production of structural biomass (i.e. asJGapproaches 0,JDremains constant), (2) most of the reserve biomass (mE,0=0.75±0.01 mol CE mol CV−1) was exhausted, with only structural biomass (with a constant density,
dA=0.16±0.01 mmol C cm−2) remaining; and (3) the maintenance
contribution to calcification is non-zero (yCa,D=0.35±0.04 mol CaCO3mol CE−1). The extent to which the empirical data deviated from the DEB model predictions is described by the MRE. The MRE showed that the empirical values deviated from the DEB model predictions by 26% (respiration), 6% (biomass) and 27% (skeletal mass).
DISCUSSION
In this study, we demonstrate that scleractinian corals belonging to the massivePoritesspp. functional group are capable of metabolic depression when resources are limited, as revealed by the 30% reduction in mass-specific respiration. The present support for metabolic depression in corals has ecological implications, because this metabolic strategy could have beneficial value during periods of chronic resource limitation. Environmental conditions that drastically reduce the production of photosynthetically fixed carbon by the Symbiodinium symbionts can also reduce the amount of carbon translocated to the coral host. For example, in field experiments in which symbiotic reef corals have been shaded from ambient sunlight, declines have been recorded in respiration rates (Rogers, 1979), biomass, lipids and calcification rates (Anthony and Fabricius, 2000). However, not all corals are equally equipped to survive shading, perhaps because they are not equally able to sufficiently depress metabolic rates to survive resource limitation due
to shading. For example, in the field experiments conducted by Rogers (1979), 5 weeks of shading resulted in changes in coral community structure. Some coral taxa were unaffected by shading (e.g. Mussa agulosa), others experienced partial mortality with complete recovery (e.g.Siderastrea siderea) or incomplete recovery (e.g. Orbicella annularis), and some died (i.e. Acropora cervicornis). Although Rogers (1979) did not compare metabolic rates among coral species, the differential survival of corals exposed to shading is consistent with the hypothesis that some corals are better able to depress metabolism, and thus survive resource limitation.
When resource limitation is a consequence of reduced photosynthesis, coral tissue could become hypoxic. In the light and thus when photosynthesis is possible, oxygen concentrations in coral tissues can reach 250% of air saturation, but concentrations rapidly decline in the dark to <2% of air saturation (Kühl et al., 1995). Thus, coral tissues are likely to experience hypoxia at night. Furthermore, respiration rates quickly decline in the dark (Edmunds and Davies, 1988; Kühl et al., 1995), presumably before biomass declines. Considering that metabolic depression is often employed to overcome both resource limitation and hypoxia (Guppy and Withers, 1999), and corals are chronically exposed to both of these stimuli at night, the ability to depress metabolism could daily benefit a coral’s ability to conserve energy reserves.
Implications of metabolic depression
The DEB model assumes that production of skeletal mass is linked to the biochemical transformations (e.g. production of CO2) associated with both maintenance and growth. Thus, the production of skeletal mass could be: (1) proportional to growth (JG), and thus would have stopped after 8–12 days of starvation, (2) proportional to maintenance (JD), and thus would have remained constant during starvation, or (3) proportional to both growth and maintenance, and thus would have varied non-linearly during starvation. The data show a non-linear reduction in the production of skeletal mass, a pattern that is consistent with the third alternative. In other words, when resources are limited, there is a reduction in growth (JG), which thus reduces the production of skeletal mass associated with growth (yCa,G=0.44 ±0.02 mol CaCO3mol CE−1). Furthermore, maintenance costs do not decrease during starvation; thus, there is a constant input of skeletal mass associated with maintenance (yCa,D=0.35±0.04 mol CaCO3mol CE−1).
The link between the production of skeletal mass and maintenance metabolism is supported by empirical data, and could be explained by the limited availability of both metabolic energy and dissolved inorganic carbon. If coral calcification is energy limited, then reduced respiration could reduce the amount of available ATP, and thus decrease skeletal mass production (Tambutté et al., 2015). Alternatively, inorganic carbon (i.e. CO2) is released as a metabolic byproduct of respiration and can be used to support the production of skeletal mass (i.e. CaCO3). In fact, empirical studies show that metabolically derived CO2 can be a major source of inorganic carbon for scleractinian calcification, supporting 70–75% of the CaCO3 deposited in the skeleton of
S. pistillatagrownex situ(Furla et al., 2000). Even though Furla et al. (2000) suggest that most carbonate in coral skeletons comes from the source closest to the site of mineralization (i.e. internally from coral tissues versus externally from the surrounding seawater), their results do not indicate that CO2 is a limiting substrate for calcification. Independent of the underlying mechanism (e.g. energy or DIC) that limits the production of skeletal mass during
Journal
of
Experimental
starvation, the pattern appears clear: skeletal mass is produced in association with both growth and maintenance.
The potential for stoichiometric coupling among respiration, biomass and skeletal mass in reef corals suggests that factors affecting any one of these processes could have indirect implications for the remaining two processes. For example, photosynthesis has long been linked to light-enhanced calcification in corals (Gattuso et al., 1999; Yonge et al., 1932). However, the positive association between calcification and light is dependent on photosynthesis and oxygen concentration (Al-Horani et al., 2003). Therefore, it is possible that light indirectly affects calcification by increasing respiration: light enhances photosynthesis, photosynthesis generates the oxygen required for respiration, and respiration generates the ATP or CO2that limits calcification. Similarly, factors increasing respiration (e.g. temperature) therefore should indirectly increase calcification. Increases in temperature between 20 and 26°C are positively associated with both coral respiration (Coles and Jokiel, 1977) and coral calcification (Marshall and Clode, 2004; Pratchett et al., 2015). It is possible that temperature indirectly enhances calcification, by directly increasing respiration and thus the supply of ATP or CO2, which might otherwise limit calcification. Therefore, these studies provide empirical support for the coupling of respiration and calcification.
Consequence of a change in pool sizes
While metabolic depression could reduce the risks of mortality, metabolic depression also reduces the supply of metabolic energy, and thus the capacity to sustain energy-requiring processes (Guppy and Withers, 1999; Hand and Hardewig, 1996; Hand and Menze, 2008; Staples and Buck, 2009; Storey and Storey, 2004). For example, costly protein synthesis is minimized, and cellular homeostasis is achieved by maintaining existing proteins (Hand and Hardewig, 1996). Subcellular changes could require a change in metabolic rules, or could be a consequence of changing pool sizes. The qualitative similarities in the dynamics of biomass, respiration and skeletal mass, as well as the strong fits of these relationships (based on MRE), are striking, especially considering that there are only two free parameters in the equations describing changes in each dependent variable. We take this as evidence supporting the ‘simple model’ in which metabolic depression is explained by a change in the size of‘pools’(i.e. aggregated groups of metabolites and macromolecules, such as structural biomass and reserve biomass). While a future study could do a more rigorous test comparing the simple (change in pool sizes) and complex (change in metabolic rules) models described herein, the current application of DEB to empirical data adds value to the field of coral ecophysiology. Namely, we show that corals depress metabolic rates during resource limitation, and that pool size dynamics are sufficient to explain the response to starvation.
Appendix
The model used in this paper is based on the standard DEB theory representation of a starving mature heterotroph. For an overview of DEB model structure, see Fig. 1, and for an in-depth discussion of assumptions and evaluation of the theory, see Kooijman (2010), Nisbet et al. (2000) and Sousa et al. (2008). The present application incorporates the model extensions to include coral symbioses (Edmunds et al., 2011; Muller and Nisbet, 2014) and calcification (Muller and Nisbet, 2014). We make four simplifying assumptions because our data do not inform all DEB model processes in detail. (1) The contribution of the symbiont to holobiont metabolism and biomass is negligible, because corals were kept in darkness to
prevent photosynthesis. (2) The amount of host structural biomass in a coral is proportional to its surface area. (3) The elemental composition of reserve biomass is similar to that of structural biomass. (4) In starving corals, energy allocation to reproduction is negligible, and dissipative fluxes due to somatic and maturity maintenance are grouped in a generalized maintenance flux.
We use the following definitions: structural biomass is biomass that requires maintenance (i.e. not skeleton; Kooijman, 2010), growth is an increase in structural biomass, and calcification is an increase in skeletal mass. Our notation closely follows that of the publications mentioned above, but has been simplified wherever possible. In particular, in symbol subscripts,‘E’represents reserve biomass,‘V’structural biomass,‘G’growth and ‘D’dissipation. Furthermore, J* represents an absolute flux, whereas j* is the corresponding flux per unit of structural biomass.
State variables and biomass
In this application of DEB theory, the two state variables needed here are the amount of structural biomass,MV, and the density of reserve biomass,mE. The latter is defined as the amount of reserve biomass,ME, per unit of structural biomass, i.e.mE≡ME/MV. In the absence of feeding and photosynthesis activities, the density of reserve biomass changes according to:
dmE
dt ¼ kEmE or mE¼mE;0e
kEt; ðA1Þ
in which t is time, kE is a proportionality factor specifying the turnover rate of reserve biomass andmE,0is the initial density of reserve biomass. The dynamics of structural biomass are:
dMV
dt ¼JG¼MV
kkEmE jD
kmEþ1=yV¼
MVk
kEmE;0ekEtjD
kmE;0ekEtþ1=yV; ð A2Þ
in whichκis the fraction of the mobilized reserve biomass used for maintenance and growth (including asexual reproduction),jDis the specific maintenance rate (i.e. the maintenance rate,JD, per unit of structural biomass, jD≡JD/MV) andyVis the yield or conversion efficiency of structural biomass from reserve biomass.
We assume that the allocation of energy to reproduction is negligible in starving corals. So, the amount of total biomass,M, is:
M¼MVþME¼MVð1þmEÞ: ðA3Þ Substitution of Eqn A1 and normalizing Mto surface area, A, yields the amount of biomass per unit of surface area:
M
A ¼dAð1þmE;0e
kEtÞ; ðA4Þ
in which surface-specific density of structural biomass,dA≡MV/A, is a constant.
Respiration
Maintenance and growth processes require energy and thus oxygen. Oxygen demands for both processes can be determined with macrochemical reaction equations, as the substrate of these processes (e.g. reserve biomass) and products (e.g. CO2 and structural biomass) have constant stoichiometric compositions. We used the C:H:O ratio in structural and reserve biomass from Muller et al. (2009) and used the average carbon content in coral biomass (53%) as determined by Edmunds et al. (2011) to calculate the C:N ratios (while assuming mass contributions of elements other than C, H, N and O are negligible). Normalized to compounds with a single carbon atom, the macrochemical reaction equations describing the
Journal
of
Experimental
utilization of reserve biomass for maintenance and growth are, respectively:
CH1:8O0:4N0:174þ1:1195O2!CO2þ0:174NH3þ0:639H2O ðA5Þ
and:
CH1:8O0:4N0:174þ1:1195ð1yVÞO2!yVCH1:8O0:4N0:174
þ ð1yVÞCO2þ0:174ð1yVÞNH3þ0:639ð1yVÞH2O:
ðA6Þ Hence, 1.1195 mol of dioxygen is consumed for every C mol of reserve biomass committed to maintenance, and for every C mol of structural biomass formed, (1−yV)/yV mol of dioxygen is consumed.
Thus, the dioxygen consumption rate of a starving coral colony,
JO, is:
JO¼1:1195JDþ1:1195 1yV
yV
JG: ðA7Þ
After substitution of Eqn A2 and a little reshuffling, Eqn A7 (respiration rate) expressed per unit of surface area becomes:
JO
A ¼1:1195dA
kEð1yVÞ=yVþ jDð1þekEt=kmE;0Þ 1þekEt=y
VkmE;0
: ðA8Þ
Calcification
The core assumptions of DEB theory imply that energy fluxes may contribute to calcification at a rate proportional to their magnitude (Muller and Nisbet, 2014). Thus, the calcification rate of a coral colony,JCa, is:
JCa¼yCa;DJDþyCa;GJG; ðA9Þ in whichyCa,Dand yCa,G are the proportionality factors or yields quantifying the contribution, respectively, of the maintenance and growth fluxes (note that, in principle, a yield may be nil when the contribution of an energy flux to calcification is negligible, or negative when a particular energy flux makes calcification more expensive, e.g. due to metabolic acid production). After substitution of Eqn A2 and a little reshuffling, Eqn A9 expressed per unit of surface area becomes:
JCa A ¼dA
yCa;GkEð1yVÞ=yVþjDð1þekEtðyCa;DyVyCa;GÞ=kmE;0Þ 1þekEt=y
VkmE;0
:
ðA10Þ The amount of skeletal mass deposited since the start of the starvation experiment,MCa, per unit of surface area is:
MCa
A ¼
ðt
0
JCa
A dt ðA11Þ
or:
MCa
A ¼dA yCa;Gln
1þyVkmE;0 1þyVkmE;0ekEt
yCa;GyVjD
kE
ln 1þyVkmE;0
ekEtþy
VkmE;0
þyCa;GjDt
:
ðA12Þ
Acknowledgements
We thank C. Osenberg for his insightful and constructive comments on the manuscript, and D. Brown, C. Cameron and V. Moriarty for their assistance in the field. This research was completed under a permit from the French Polynesian
Ministry of Research, and was greatly facilitated by N. Davies and the staff at the UC Berkeley and Richard B. Gump South Pacific Research station.
Competing interests
The authors declare no competing or financial interests.
Author contributions
L.M.J. completed this research as part of her Masters thesis; furthermore, she led the experiment, analysis with inferential statistics, manuscript preparation and writing. P.J.E. actively advised on the experiment, and took a leading role in revising and writing earlier drafts. E.B.M. and R.M.N. developed the DEB model applied in this paper and actively advised in the interpretation and communication of the DEB model results. Furthermore, E.B.M. completed the DEB model fitting, and led in writing the DEB model specifics (i.e. the Appendix).
Funding
This research was supported by grants from the US National Science foundation through the Advancing Theory in Biology program (NSF EF 42567 and EF 07-0742521) and the Long Term Ecological Research program (OCE 04-17412, 10-26851 and 12-36905). This is a product of the Moorea Coral Reef (MCR) LTER, and is contribution number 237 of the Marine Biology Program of California State University, Northridge.
References
Al-Horani, F. A., Al-Moghrabi, S. M. and de Beer, D.(2003). The mechanism of calcification and its relation to photosynthesis and respiration in the scleractinian coralGalaxea fascicularis.Mar. Biol.142, 419-426.
Alldredge, A. and Carlson, C.,of Moorea Coral Reef LTER(2013). MCR LTER: Coral Reef: Water Column: Nearshore Water Profiles, CTD, Primary Production, and Chemistry, ongoing since 2005. knb-lter-mcr.10.32
Anthony, K. R. N. and Fabricius, K. E.(2000). Shifting roles of heterotrophy and autotrophy in coral energetics under varying turbidity.J. Exp. Mar. Biol. Ecol.252, 221-253.
Bruno, J. F. and Edmunds, P. J.(1998). Metabolic consequences of phenotypic plasticity in the coralMadracis mirabilis(Duchassaing and Michelotti): the effect of morphology and water flow on aggregate respiration.J. Exp. Mar. Biol. Ecol.229, 187-195.
Chalker, B. E., Dunlap, W. C. and Oliver, J. K.(1983). Bathymetric adaptations of reef-building corals at Davies Reef, Great Barrier Reef, Australia. II. Light saturation curves for photosynthesis and respiration.J. Exp. Mar. Biol. Ecol.73, 37-56.
Coles, S. L. and Jokiel, P. L.(1977). Effects of temperature on photosynthesis and respiration in hermatypic corals.Mar. Biol.43, 209-216.
Davies, P. S.(1980). Respiration in some Atlantic reef corals in relation to vertical distribution and growth form.Biol. Bull.158, 187-194.
Davies, P. S.(1989). Short-term growth measurements of corals using an accurate buoyant weighing technique.Mar. Biol.101, 389-395.
Done, T. J. and Potts, D. C.(1992). Influences of habitat and natural disturbances on contributions of massivePoritescorals to reef communities.Mar. Biol.114, 479-493.
Edmunds, P. J.(2009). Effect of acclimatization to low temperature and reduced light on the response of reef corals to elevated temperature.Mar. Biol.156, 1797-1808.
Edmunds, P. J.(2011). Zooplanktivory ameliorates the effects of ocean acidification on the reef coral Porites spp.Limnol. Oceanogr.56, 2402-2410.
Edmunds, P. J. and Davies, P. S.(1986). An energy budget forPorites porites
(Scleractinia).Mar. Biol.92, 339-347.
Edmunds, P. J. and Davies, P. S.(1988). Post-illumination stimulation of respiration rate in the coral Porites porites.Coral Reefs7, 7-9.
Edmunds, P. J., Putnam, H. M., Nisbet, R. M. and Muller, E. B. (2011). Benchmarks in organism performance and their use in comparative analyses.
Oecologia167, 379-390.
Eynaud, Y., Nisbet, R. M. and Muller, E. B.(2011). Impact of excess and harmful radiation on energy budgets in scleractinian corals.Ecol. Model.222, 1315-1322.
Falkowski, P. G., Dubinsky, Z., Muscatine, L. and Porter, W. P.(1984). Light and the bioenergetics of a symbiotic coral.Bioscience34, 705-709.
Falkowski, P. G., Jokiel, P. L. and Kinsie, R. A. III(1990). Irradiance and corals. InEcosystems of the World, 25. Coral Reefs(ed. Z. Dubinsky), pp. 89-107. Amsterdam: Elsevier Science Publishing Company, Inc.
Fitt, W. K., Mcfarland, F. K., Warner, M. E. and Chilcoat, G. C.(2000). Seasonal patterns of tissue biomass and densities of symbiotic dinoflagellates in reef corals and relation to coral bleaching.Limnol. Oceanogr.45, 667-685.
Forsman, Z. H., Barshis, D. J., Hunter, C. L. and Toonen, R. J.(2009). Shape-shifting corals: molecular markers show morphology is evolutionarily plastic in
Porites.BMC Evol. Biol.9, 45.
Franzisket, L.(1970). The atrophy of hermatypic reef corals maintained in darkness and their subsequent regeneration in light. Int. Rev. Gesamten Hydrobiol.
Hydrogr.55, 12.
Journal
of
Experimental
Frieler, K., Meinshausen, M., Golly, A., Mengel, M., Lebek, K., Donner, S. D. and Hoegh-Guldberg, O.(2012). Limiting global warming to 2°C is unlikely to save most coral reefs.Nat. Clim. Chang.3, 165-170.
Furla, P., Galgani, I., Durand, I. and Allemand, D. (2000). Sources and mechanisms of inorganic carbon transport for coral calcification and photosynthesis.J. Exp. Biol.203, 3445-3457.
Garcıa, H. E. and Gordon, L. I.́ (1992). Oxygen solubility in seawater: better fitting equations.Limnol. Oceanogr.37, 1307-1312.
Gasol, J. M., del Giorgio, P. A., Massana, R. and Duarte, C. M.(1995). Active versus inactive bacteria: size-dependence in a coastal marine plankton community.Mar. Ecol. Prog. Ser.128, 91-97.
Gattuso, J.-P., Allemand, D. and Frankignoulle, M.(1999). Photosynthesis and calcification at cellular, organismal and community levels in coral reefs: A review on interactions and control by carbonate chemistry.Am. Zool.39, 160-183.
Goreau, T. F., Goreau, N. I. and Yonge, C. M.(1971). Reef corals: autotrophs or heterotrophs?Biol. Bull.141, 247-260.
Guppy, M. (2004). The biochemistry of metabolic depression: a history of perceptions.Comp. Biochem. Physiol. B Biochem. Mol. Biol.139, 435-442.
Guppy, M. and Withers, P.(1999). Metabolic depression in animals: physiological perspectives and biochemical generalizations.Biol. Rev. Camb. Philos. Soc.74, 1-40.
Hand, S. C. and Hardewig, I.(1996). Downregulation of cellular metabolism during environmental stress: mechanisms and implications. Annu. Rev. Physiol.58, 539-563.
Hand, S. C. and Menze, M. A.(2008). Mitochondria in energy-limited states: mechanisms that blunt the signaling of cell death.J. Exp. Biol.211, 1829-1840.
Hanegraaf, P. P. F. and Muller, E. B.(2001). The dynamics of the macromolecular composition of biomass.J. Theor. Biol.212, 237-251.
Kawaguti, S.(1937). On the physiology of reef corals I. On the oxygen exchanges of reef corals.Palao Trop. Biol. Stn. Stud.1, 187-198.
Kooijman, S. A. L. M. (2010).Dynamic Energy Budget Theory for Metabolic Organisation. 3rd edn. Cambridge: Cambridge University Press.
Kühl, M., Cohen, Y., Dalsgaard, T., Jørgensen, B. B. and Revsbech, N. P.(1995). Microenvironment and photosynthesis of zooxanthellae in scleractinian corals studied with microsensors for O2, pH and light.Mar. Ecol. Prog. Ser.117, 159-172. Lesser, M. P.(2011). Coral bleaching: causes and mechanisms. InCoral Reefs: An Ecosystem in Transition (ed. Z. Dubinsky and N. Stambler), pp. 405-419. Heidelberg: Springer.
Marsh, J. A. J.(1970). Primary productivity of reef-building calcareous red algae.
Ecology51, 255-263.
Marshall, A. T. and Clode, P. L.(2004). Calcification rate and the effect of temperature in a zooxanthellate and an azooxanthellate scleractinian reef coral.
Coral Reefs23, 218-224.
McCue, M. D. (2010). Starvation physiology: reviewing the different strategies animals use to survive a common challenge.Comp. Biochem. Physiol. A Mol. Integr. Physiol.156, 1-18.
Muller, E. B. and Nisbet, R. M.(2014). Dynamic energy budget modeling reveals the potential of future growth and calcification for the coccolithophore Emiliania huxleyi in an acidified ocean.Glob. Chang. Biol.20, 2031-2038.
Muller, E. B., Kooijman, S. A. L. M., Edmunds, P. J., Doyle, F. J. and Nisbet, R. M.
(2009). Dynamic energy budgets in syntrophic symbiotic relationships between heterotrophic hosts and photoautotrophic symbionts.J. Theor. Biol.259, 44-57.
Muscatine, L., Mccloskey, L. R. and Marian, R. E.(1981). Estimating the daily contribution of carbon from zooxanthellae to coral animal respiration.Limnol. Oceanogr.26, 601-611.
Nisbet, R. M., Muller, E. B., Lika, K. and Kooijman, S. A. L. M.(2000). From molecules to ecosystems through dynamic energy budget models.J. Anim. Ecol.
69, 913-926.
Patterson, M. R., Sebens, K. P. and Olson, R. R.(1991). In situ measurements of flow effects on primary production and dark respiration in reef corals.Limnol. Oceanogr.36, 936-948.
Porter, J. W. (1976). Autotrophy, heterotrophy, and resource partitioning in Caribbean reef-building corals.Am. Nat.110, 731-742.
Pratchett, M., Anderson, K., Hoogenboom, M., Widman, E., Baird, A., Pandolfi, J., Edmunds, P. Lough, J.(2015). Spatial, temporal and taxonomic variation in coral growth–implications for the structure and function of coral reef ecosystems. InOceanography and Marine Biology, An Annual Review, Vol. 53 (ed. R. N. Hughes, D. J. Hughes, I. P. Smith and A. C. Dale), pp. 215-296. Boca Raton, FL: CRC Press.
Rodrigues, L. J. and Grottoli, A. G.(2007). Energy reserves and metabolism as indicators of coral recovery from bleaching.Limnol. Oceanogr.52, 1874-1882.
Rogers, C. S.(1979). The effect of shading on coral reef structure and function.
J. Exp. Mar. Biol. Ecol.41, 269-288.
Soong, K.(1993). Colony size as a species character in massive reef corals.Coral Reefs12, 77-83.
Sousa, T., Domingos, T. and Kooijman, S. A. L. M.(2008). From empirical patterns to theory: a formal metabolic theory of life.Philos. Trans. R. Soc. B Biol. Sci.363, 2453-2464.
Staples, J. F. and Buck, L. T.(2009). Matching cellular metabolic supply and demand in energy-stressed animals.Comp. Biochem. Physiol. A Mol. Integr. Physiol.153, 95-105.
Storey, K. B. and Storey, J. M.(2004). Metabolic rate depression in animals: transcriptional and translational controls.Biol. Rev.79, 207-233.
Tambutté, É., Venn, A. A., Holcomb, M., Segonds, N., Techer, N., Zoccola, D., Allemand, D. and Tambutté, S.(2015). Morphological plasticity of the coral skeleton under CO2-driven seawater acidification.Nat. Commun.6, 7368. Titlyanov, E. A., Titlyanova, T. V., Yamazato, K. and van Woesik, R.(2001).
Photo-acclimation of the hermatypic coralStylophora pistillatawhile subjected to either starvation or food provisioning.J. Exp. Mar. Biol. Ecol.257, 163-181.
Yonge, C. M., Yonge, M. J. and Nicholls, A. G.(1932). Studies on the physiology of corals. VI. The relationship between respiration in corals and the production of oxygen by their zooxanthellae.Sci. Rep. Great Barrier Reef Exped.1, 213-251.