Home Affairs Committee
Knife Crime
Seventh Report of Session 2008–09
House of Commons
Home Affairs Committee
Knife Crime
Seventh Report of Session 2008–09
Report, together with formal minutes
Ordered by the House of Commons to be printed 20 May 2009
The Home Affairs Committee
The Home Affairs Committee is appointed by the House of Commons to examine the expenditure, administration, and policy of the Home Office and its
associated public bodies.
Current membership
Rt Hon Keith Vaz MP (Labour, Leicester East) (Chairman) Tom Brake MP (Liberal Democrat, Carshalton and Wallington) Ms Karen Buck MP (Labour, Regent’s Park and Kensington North) Mr James Clappison MP (Conservative, Hertsmere)
Mrs Ann Cryer MP (Labour, Keighley)
David TC Davies MP (Conservative, Monmouth) Mrs Janet Dean MP (Labour, Burton)
Patrick Mercer MP (Conservative, Newark) Margaret Moran MP (Labour, Luton South) Gwyn Prosser MP (Labour, Dover)
Bob Russell MP (Liberal Democrat, Colchester) Martin Salter MP (Labour, Reading West)
Mr Gary Streeter MP (Conservative, South West Devon) Mr David Winnick MP (Labour, Walsall North)
Powers
The Committee is one of the departmental select committees, the powers of which are set out in House of Commons Standing Orders, principally in SO No 152. These are available on the Internet via www.parliament.uk
Publication
The Reports and evidence of the Committee are published by The Stationery Office by Order of the House. All publications of the Committee (including press notices) are on the Internet at www.parliament.uk/homeaffairscom. A list of Reports of the Committee since Session 2005–06 is at the back of this volume.
Committee staff
The current staff of the Committee are Elizabeth Flood (Clerk), Eliot Barrass (Second Clerk), Elisabeth Bates (Committee Specialist), Sarah Harrison (Committee Specialist), Darren Hackett (Senior Committee Assistant), Ameet Chudasama (Committee Assistant), Sheryl Dinsdale (Committee Assistant) and Jessica Bridges-Palmer (Select Committee Media Officer).
Contacts
Contents
Report
PageSummary 3
1 Introduction 6
Background to our inquiry 6
Defining knife crime 6
2 The scale of knife crime 8
Sources of data 8
Is knife crime going up or down? 10
Context 10
Fatal stabbings 11
Use of knives in non-fatal violent crime 12
Knife possession 15
Impact of the Tackling Knives Action Programme 17
3 Victims and offenders 19
The relationship between victim and offender 19
Geography 20
Ethnicity 22
Age 23
Gender 24
Types of knives 25
4 Causes 27
Protection 27
Influence of media coverage 28
Status 30
Availability of weapons 32
Causes of violent behaviour 33
Links to social deprivation 33
Childhood experiences 34
Exposure to violent entertainment media 35
5 Legislation, policing and sentencing 37
Legislation 37
Tackling availability 38
Knife amnesties 39
Stop and search 40
Convictions and sentences 43
Sentencing legislation and guidelines 43
6 Reducing knife-carrying 49
Educating children about the realities of knife-carrying 49
Keeping children safe at school 53
Knife detectors 53
Exclusions 54
Safer Schools Partnerships 55
Keeping children safe on the street 56
Increasing young people’s confidence in the police 56
Support for victims 57
7 Reducing violence: work with offenders 58
Work in prisons and young offenders institutions to change behaviour 58
Resettlement on release from custody 60
Gang exit strategies 62
Conflict resolution 62
The ‘Boston miracle’ 63
Work with low-level offenders and those at risk of offending 64
8 Reducing violence: long-term prevention strategy 66
Public health approach 66
Understanding the problem: collecting and sharing knife data 67
Breaking the cycle of violence 70
Providing positive alternatives for young people 71
Early intervention 73
Conclusions and recommendations 77
Annex A: London seminar notes 85
Annex B: Leeds seminar notes 92
Annex C: UNCUT meeting notes 98
Annex D: Bristol seminar notes 102
Formal Minutes 108
Witnesses 110
Summary
Violent knife offending has tended to mirror trends in overall violent crime, which rose sharply in the 1970s and 1980s but has fallen since the mid-1990s. However, the number of knife homicides increased by over a quarter between 2005/06 and 2006/07; there also appeared to be a rise in other serious knife violence during this year. In addition, a 48% increase in stab-related hospital admissions between 1997/98 and 2006/07 may indicate that knives are being used to inflict more serious wounds.
As with overall violence, the majority of knife victims and perpetrators are young men in their late teens and early twenties. There is also a significant proportion of knife offending that is linked to domestic violence. However, the high levels of knife violence since 2006 appear to be the result of an increase in street violence between groups of young people who are sometimes referred to as ‘gangs’. While rural areas have experienced a small increase in knife injuries, knife violence is concentrated in the deprived parts of big cities.
It is difficult to estimate how many young people carry knives but there are fears it is becoming ‘normal’ in some areas. Young people tend to carry pen knives or flick knives, but kitchen knives are more commonly used in stabbings. Most young people who carry knives say they do so for ‘protection’; status and peer pressure are also factors. This perceived need for protection is compounded by the sense, reinforced by media coverage of stabbings, that everyone else is carrying a weapon, as well as experience of victimisation. In terms of knife-users, socially excluded young people from dysfunctional families are more predisposed to be violent, particularly those who witness or experience violence in the home.
Our findings convinced us of the need to target knife-carriers and violent offenders separately. For the former, we advocate education in schools about the realities of knife-carrying and measures to help young people feel safer, such as improving confidence in the police and better victim support. Evidence suggests that the prospect of being caught can deter young people from breaking the law. We therefore support the use of stop and search, providing it is carried out in an appropriate manner.
While we encourage the use of custody as an appropriate sentence for the majority of knife-carriers and for violent offenders, high re-offending rates highlight its ineffectiveness as a long-term solution to violent crime. We recommend the expansion of offending behaviour and resettlement programmes as a means to reduce re-offending by prisoners, as well as interventions with young people on the cusp of more serious offending.
Key facts and figures
• The number of knife homicides rose by 26.9% between 2005/06 and 2006/07. There were 270 knife homicides in 2007/08: the highest total since the Homicide Index was introduced in 1977.
• Knifes were used in 6% of British Crime Survey violent incidents in 2007/08. This
is estimated to correspond to use in approximately 138,000 robberies, woundings or assaults taking place throughout England and Wales in that year.
• 5,239 people were admitted to NHS hospitals in England with a stab wound in 2007/08. The number of patients admitted rose by 48% between 1997/98 and 2006/07.
• The median age of British Crime Survey knife victims has declined since 2004/05.
Between 2003 and 2007 stab-related hospital admissions for under-16s increased by 62.7%.
• Penknives and flick knives are most routinely carried but kitchen knives are more frequently used in injuries presenting to hospital.
• 85% of young people who carry knives claim they do so “for protection”.
• 21% of people convicted of possessing an offensive weapon were jailed in the last
quarter of 2008.
• More than half of prisoners re-offend within a year of release.
• 5% of young people commit half of all youth crime. The Government estimates that they come from 110,000 high risk families, 20,000 of whom require intensive interventions.
• The organisation Kids Count estimates that knife crime costs the state in the region
1
Introduction
Background to our inquiry
1.Growing public concern about a seemingly new trend in violent knife offending came to a head with a series of high-profile fatal stabbings in May 2008. ‘Knife crime’ dominated the headlines throughout the summer. At the same time, official crime statistics continued to show a sharp decline in violent crime. To try to establish the extent of the issue, we decided to expand our wide-ranging inquiry into Policing in the 21st Century to take
evidence on knife crime from the Channel 4 Street Weapons Commission, police officers and politicians. In our subsequent Report we concluded that the evidence we had heard “convinced us of the value of undertaking an inquiry devoted to that subject [knife crime], which will commence in the autumn.”1
2.In July 2008, we therefore published our intention to “investigate levels and causes of knife crime, profiles and attitudes of offenders and assess effective solutions” and to examine in particular the following issues:
• Availability and reliability of data, knife-carrying offences and hotspots
• Offender profiles, and public perceptions of levels of knife crime
• Causes: reasons for knife-carrying and use
• Causes: availability of knives
• Current legislation
• Solutions: education, parents and community projects
• Solutions: police operations, amnesties and enforcement
• Solutions: convictions, penalties and sentencing
3.In the course of our inquiry we took oral evidence from 35 witnesses between November 2008 and March 2009 and received 25 written submissions. A list of those who gave evidence is annexed. We held seminars in South London, Leeds and Bristol with local police officers, medics, youth workers, academics and young people, to establish how different parts of the country are affected by knife crime. We also visited Aylesbury Young Offenders Institution, met with London school children involved with the organisation UNCUT and were briefed by staff from the National Audit Office.
Defining knife crime
4.There is no Home Office definition of ‘knife crime’. The phrase was adopted by the media and is now popularly used to refer primarily to stabbings but also to the illegal carrying of knives by young people in a public place or on school premises. However,
‘knife-enabled crime’ includes a variety of other offences involving a bladed weapon, for example it is an offence to cause or threaten harm with a knife and if used in a robbery or assault, it aggravates the offence. It is also illegal to look after, hide or transport a dangerous weapon on behalf of someone else, market a knife in a way which is likely to encourage violent behaviour, and sell a knife to a person under 18.2
5.As we discuss in chapters one and two, it became apparent during our inquiry that knives are used in a variety of situations, for a range of motivations and affect different kinds of people, making a coherent analysis of weapon use impossible. The concerns which prompted our inquiry related mainly to knife offending amongst young people, therefore consideration of causes and solutions in the later chapters of our Report focus in the main on knife-carrying and violent offending by children and teenagers.
2
The scale of knife crime
6.We begin by examining data on knife offences, injuries and possession to assess whether they justify public perceptions of an increase in knife crime. In the following chapter, we consider what the data tell us about the characteristics of knife offenders and victims, particularly the extent to which they involve our key subjects of interest, children and teenagers.
Sources of data
7.There are three main sources of data on different aspects of illegal knife use: Home Office crime statistics in various forms, National Health Service (NHS) hospital statistics and a number of surveys with young people to determine the extent of knife-carrying. The Ministry of Justice also publishes data on knife possession. Analysing these data demands a cautious approach because of some inherent limitations, as well as difficulties in comparing one source against another owing to differences in what is measured.
8.In terms of Home Office data, the Homicide Index has been published annually since 1977 and contains details of all cases of murder, manslaughter and infanticide that were recorded in England and Wales over the course of the previous year. Given the definitive nature of fatality and its likelihood of coming to the attention of the police, we can presume that it is probably the most complete source of data on those knife offences which it covers. However, fatal stabbings comprises only a tiny minority of knife offences and accurate data is not published until nine months after the year end.
9.The British Crime Survey has, until recently, been the main means by which the Home Office has measured the use of knives in non-fatal violent crime. The survey records the amount of crime experienced by adults over 16 years of age living in private households in England and Wales. It includes a question asking if the respondent has been a victim of a violent crime over the previous 12 months and, if so, whether or not a knife was involved. From the responses, researchers estimate the total number of incidents likely to have taken place in England and Wales. However, Dr Bob Golding, giving evidence in November 2008 on the basis of research he has carried out for the Policy Exchange think tank, argued that it is difficult to obtain a complete picture of knife offences from the British Crime Survey:
Whilst the survey is helpful it has some limitations particularly in the context of the subject we are talking about today: knife crime. Notably, the British Crime Survey does not count the under-16s which from the research is one of our target or problem populations. It does not collect data from people without access to a home telephone or private residence and it is of limited scale.3
(From January 2009, the survey has been extended to include 10-16 year olds.)
10.Since July 2008, police forces have also been required to publish statistics for recorded use of knives in the most serious offences, namely attempted murder, wounding with intent to do grievous bodily harm (GBH), wounding or inflicting GBH, robbery of business
property and robbery of personal property. While this improves our understanding of knife use in violent crime it is also unlikely to reveal its full extent, as it has been estimated that only 50% of stab victims who present at hospital actually report their assault to the police.4 This trend was confirmed anecdotally by a young man giving evidence
anonymously with The Prince’s Trust, who said:
A couple of people that I have been involved with have not even reported stuff, so even if they have been stabbed or whatever they cannot be seen to be snitching. I do not know whether the statistics are really picking up what is out there.5
11.Data from health agencies may therefore allow for a more accurate assessment of stabbing trends.6 Hospital Episode Statistics (HES) contain information on patients
admitted to hospital who receive care provided by the NHS, including their main diagnosis—recorded as ‘Assault by a sharp object’ in the case of stab victims. The statistics have some caveats. For one, they do not include assault injuries to individuals that are dealt with solely in Accident and Emergency departments and do not require admission to a hospital bed. Professor Brohi, a trauma and vascular surgeon at the Royal London Hospital also cautioned that, while he had not heard of victims being “treated in back streets”, “undoubtedly there are people who are injured who do fine without going to hospital and therefore may not need to go to hospital.”7 Equally, the statistics will not include the
majority of injuries resulting in death, as a comparison of HES mortality data with ONS mortality statistics in 2005 suggested that around 80% of deaths caused by stabbing occurred before admission to hospital took place.8
12.Finally, there are a number of self-report surveys asking young people about their experience of knives. The largest of these are the MORI Youth Surveys, commissioned by the Youth Justice Board and carried out annually between 1999 and 2005 and again in 2008 with 11-16 year olds in mainstream education and excluded 11-17 year olds; and the Home Office’s Offending and Criminal Justice Survey carried out annually with 10-25 year olds between 2003 and 2006. Frances Done, Chair of the Youth Justice Board, told us “it is generally accepted that self-report surveys are the most accurate way of finding out what is happening on the ground in terms of offending”.9 As well as giving an indication of
incidence, they explore motivations.
13.The Ministry of Justice publishes convictions for possessing a bladed instrument. This year it also published data on the sentences awarded to those convicted of possessing an offensive weapon. While these data provide some useful information about levels of knife- carrying, it is difficult to assess whether any increase or decrease reflects the trend in
4 Q 202 [DCS Carnochan]
5 Q 272
6 Roy Maxwell, Caroline Trotter, Julia Verne, Paul Brown and David Gunnell, “Trends in admissions to hospital involving an assault using a knife or other sharp instrument, England, 1997–2005”, Journal of Public Health, Vol 29, No. 2 (2007), pp 186–7
7 Q 82
8 Roy Maxwell, Caroline Trotter, Julia Verne, Paul Brown and David Gunnell, “Trends in admissions to hospital involving an assault using a knife or other sharp instrument, England, 1997–2005”, Journal of Public Health, Vol 29, No 2 (2007), p 188
carrying or in detection rates linked to police activity. Moreover, the sentencing data cover all offensive weapons, rather than knives alone.
14.Statistical data about the use of knives in violent offending are contained in the Homicide Index, the British Crime Survey and police recorded crime. Hospital Episode Statistics provide information about knife injuries resulting in a victim’s admittance to hospital. The Home Office Offending, Crime and Justice Survey and MORI Youth Survey have provided information about levels of knife-carrying amongst young people. We welcome the decision to extend the British Crime Survey to under-16s and to publish specific data on knives in police recorded crime as means of improving our understanding of the scale of knife violence. However, limitations remain that inhibit a fully accurate analysis, including poor reporting rates.
Is knife crime going up or down?
Context
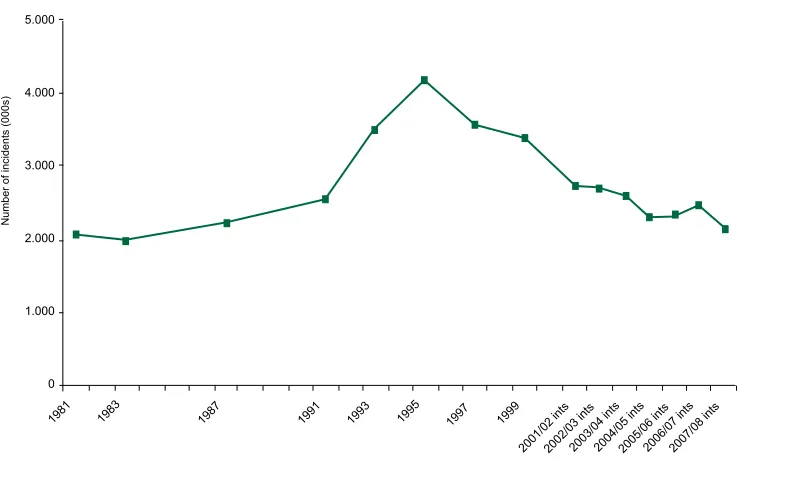
15.We attempted to ascertain the scale of knife possession and use from the data sources listed above, as well as anecdotal evidence from witnesses living and working in communities affected by knife crime. We set out our findings below. While attempting to assess any trend, it is worth bearing in mind overall crime trends. Crime levels rose dramatically in the second half of the twentieth century, peaking in 1995. Since that year, violent crime measured by the British Crime Survey has fallen by 48%.10 However, some
[image:14.595.87.482.463.708.2]academics, such as Dr Marian FitzGerald, have argued that official statistics have failed to pick up a growth in serious violent crime.11
Figure 1: All violent crime, 1981-2007/08 BCS12
5.000
4.000
3.000
2.000
1.000
0
1981 1983 1987 1991 1993 1995 1997 1999
2001/02 ints2002/03 ints2003/04 ints2004/05 ints2005/06 ints2006/07 ints2007/08 ints
Number of incidents (000s)
10 Home Office, Crime in England and Wales 2007/08: Findings from the British Crime Survey and police recorded crime, July 2008, p 59
11 Ev 163
Fatal stabbings
[image:15.595.79.553.316.714.2]16.The number of overall homicides increased gradually but steadily during the 1980s and 1990s from 418 in 1977 to a peak of 953 in 2002/03, before falling again to 723 in 2005/06. Of these, homicides by sharp instrument rose from 135 in 1977 to 243 in 1995, fell to 197 the following year and then remained relatively stable until rising to 261 in 2001/02 and then declining again to 212 in 2005/06. In percentage terms, 33% of homicides were caused by stabbing in 1977; this fell to 28% in 2000/01 and then remained relatively stable. We were particularly interested in what happened from 2006, the point at which ‘knife crime’ began to grow in the public consciousness. Fatal stabbings did indeed rise sharply between 2005/06 and 2006/07 - by 57 to 269 (35% of all homicides).Between April 2007 and March 2008, the most recent period for which data is available, the police recorded 270 homicides involving a sharp instrument: the highest total since the Homicide Index was introduced in 1977. This again constituted 35% of all homicides.13
Figure 2: Homicide by apparent method of killing, England and Wales, 1997/08-2007/0814
Apparent method
97/98 98/99 99/00 00/01 01/02 02/03 03/04 04/05 05/06 06/07 07/08
Sharp instrument
202 201 213 215 261 266 242 260 219 269 270
Blunt instrument
68 65 70 77 60 48 73 66 60 45 66
Hitting, kicking etc
103 89 95 102 145 150 137 127 111 141 163
Strangulation 62 78 56 147 78 67 67 64 57 54 57
Shooting 52 46 61 72 97 75 67 70 50 59 53
Explosion 1 2 4 2 1 2 _ 2 53 1 _
Burning 28 32 13 18 29 22 28 32 27 29 27
Drowning 6 6 6 9 12 7 24 12 4 9 6
Poison or drugs
17 47 53 33 35 202 20 29 31 26 20
Motor vehicle
13 14 11 16 19 21 22 22 14 6 12
Other 38 43 40 68 40 48 36 41 25 41 52
Not known 19 23 53 14 31 45 60 59 72 62 37
Total 609 646 675 773 808 953 776 784 723 742 763
13 Home Office, Homicides, Firearm Offences and Intimate Violence 2007/08: Supplementary Volume 2 to Crime in England and Wales 2007/08, January 2009
17.Between 1996 and 2005/06 fatal stabbings mirrored overall homicide rates: the number of fatal stabbings rose sharply before declining again from 2003, but the percentage of homicides that involved a sharp instrument remained relatively stable. However, since 2006 the overall homicide rate has remained relatively stable but the number of knife homicides has increased—by a dramatic 26.9% in 2006/07—to reach 270 in 2007/08, the highest total recorded since the Homicide Index was established in 1977.
Use of knives in non-fatal violent crime
18.Findings from the British Crime Survey (BCS) indicate that knives were used in 6%, or approximately 138,000, of an estimated 2,164,000 non-fatal violent crimes in 2007/08. This percentage has remained below 8% since 1995. The most common weapons employed in violent crimes were ‘hitting implements’, used in 7% of violent incidents but 76% of violent crimes did not involve any weapons. Overall violent crime declined by 12% from the previous year; therefore while the proportion of incidents involving knives remained approximately the same, the total number of incidents was lower than in previous years.15
19.Breaking the data down by crime type, we are presented with a mixed picture. Firstly, we see a decline of almost two-thirds in incidents of knife-enabled woundings between 1995 and 2003/04 (from 84,000 to 29,000), followed by a rise of almost a third to 38,000 in 2007/08. As with homicide figures, the biggest increase occurs between 2005/06 and 2006/07. Figures show that incidents of robberies in which a knife was used also declined by over two-thirds between 1995 and 2004/05 before rising sharply between 2005/06 and 2006/07, but declining slightly again in 2007/08. The use of knives in common assault declined by almost two-thirds between 2006/07 and 2007/08. 16
15 Home Office, Crime in England and Wales 2007/08: Findings from the British Crime Survey and police recorded crime, July 2008, pp 73, 21
Figure 3: Violent incidents in which a knife was used, British Crime Survey data17
Wounding Robbery Common assault All violence
Estimated number
% of all incidents
Estimated number
% of all incidents
Estimated number
% of all incidents
Estimated number
% of all incidents
1995 84,000 9% 97,000 29% 160,000 5% 334,000 8%
1997 37,000 5% 55,000 17% 77,000 3% 180,000 5%
1999 61,000 9% 72,000 18% 53,000 2% 194,000 5%
2001/2 64,000 10% 63,000 18% 63,000 4% 191,000 7%
2002/3 41,000 6% 58,000 19% 128,000 8% 217,000 8%
2003/4 29,000 4% 30,000 10% 70,000 4% 126,000 5%
2004/5 29,000 5% 26,000 10% 89,000 6% 139,000 6%
2005/6 32,000 6% 41,000 13% 90,000 6% 157,000 7%
2006/7 38,000 7% 65,000 20% 140,000 9% 181,000 7%
2007/8 38,000 8% 48,000 15% 53,000 4% 138,000 6%
However, as we discussed above, the accuracy of BCS data is questionable. In particular, the number of robbery victims interviewed for the survey is generally too low to provide robust estimates of robberies for individual years. 18
20.Police forces have only published data on knife use in serious offences since July 2008; therefore, it is not possible to establish long-term trends from these statistics. The first published data, for April 2007-March 2008, showed 22,151 instances of use of a knife or a sharp instrument in attempted murders, grievous bodily harm or robbery.19
21.It is difficult to draw firm conclusions from Home Office data about levels of knife use in non-fatal violent crime, partly because of the limitations of the source data and partly because they do not indicate many clear trends. It appears that overall knife violence recorded by the British Crime Survey fell sharply between 1995 and 2003/04, in line with overall violent crime, but rose again in 2006/07.
22.A study of Hospital Episode Statistics (HES) data on patients admitted to NHS hospitals in England between 1 April 1997 and 31 March 2005 found that the number of admissions for “assault by sharp object” increased by 30% over the study period.20 Since
17 Ibid, adapted from Table 3
18 Ibid, p 10
19 Home Office, Crime in England and Wales 2007/08: Findings from the British Crime Survey and police recorded
crime, July 2008, p 75
then, the NHS has published data showing the figure continued to rise from 5,072 in 2004/05 to 5,720 in 2006/07, before falling slightly to 5,239 in 2007/08.21
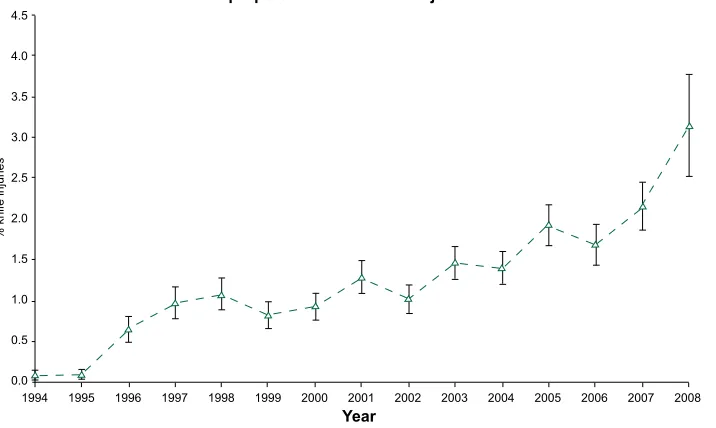
[image:18.595.90.448.246.460.2]23.The Trauma Audit and Research Network (TARN) collects data on patients who are admitted to hospital as a result of serious injury from its member hospitals (about half of all trauma-receiving hospitals in England and Wales) for more detailed analysis. The Network’s research director, Dr Fiona Lecky, presented data to our Leeds seminar which demonstrated a sharp rise in the proportion of serious injuries caused by knives:
Figure 4: Knife injuries as proportion of all serious injuries 1994-200822
4.5 4.0 3.5 3.0 2.5 2.0 1.5 1.0 0.5 0.0
% knife injuries
1994 1995 1996 1997 1998 1999 2000 2001 2002 2003 2004 2005 2006 2007 2008
Knife injuries (all areas) 1994 -2008 as proportion of all serious injuries in TARN
Year
These findings were supported by evidence from Professor Karim Brohi regarding cases treated at the Royal London Hospital, which treats one in four or five of all injuries sustained in the capital:
As to knife crime, currently we see 23 severe injuries a month. So far this year we have had 255 injuries and project 278 up to the end of the year. That compares with 68 injuries in 2003 when our database started ... One in three inpatients is a knife victim, so ... of my dedicated trauma time one third is spent on knife injuries.23
24.Hospital Episode Statistics show a big increase in knife injuries since the mid-1990s,
with the sharpest increase occurring since 2006. This trend was supported by the professional opinion of two senior medical practitioners to whom we spoke. However, we note that the number of stab victims admitted to hospital is far lower than the number of stab victims suggested by the British Crime Survey. This may indicate that the majority of stab wounds are minor. The increase in hospital admissions, however, appears to indicate that serious stab wounds are becoming more common.
21 Knife crime statistics, Standard Note SN/SG/4304, House of Commons Library, March 2009, p 13
22 Ev 193 [Trauma and Audit Research Network]
Knife possession
25.The majority of detailed data about knife possession relates to young people, in the form of self-report surveys. The Youth Justice Board’s 2008 MORI Youth Survey found that 31% of 11-16 year olds in mainstream education surveyed reported having carried a weapon in the previous 12 months: the two most common weapons reported were a penknife (17%) and a BB gun, a type of airgun that fires small pellets (15%). 61% of excluded young people admitted to carrying a weapon, including 54% who admitted to carrying a knife.24 The 2008 survey showed lower levels of knife-carrying for both groups
than the 2004 survey; however this was off-set by the increased numbers of respondents who did not answer the question about knife-carrying. The Chair of the Youth Justice Board, Frances Done, told us that on the basis of these results:
The level of knife-carrying by young people, either young people generally or those who have said that they have offended—and this is knife-carrying at any time in the last 12 months—is of a level that is obviously of serious concern.25
26.The Home Office Offending, Crime and Justice Survey has found significantly lower numbers of young people reporting to have carried knives. The difference can be partially explained by the survey methodology, the wider age range covered by the OCJS and the fact that the MORI survey included knife-carrying for legitimate purposes (32% of the young people who admitted to carrying a knife said they did so “for hobbies, activities or sports”). The 2006 survey found that 3% of 10-25 year olds claimed to have carried a knife in the last 12 months. Of those who reported to have carried a knife, 54% said they had carried it “once or twice” with only 17% claiming to have carried a knife “10 times or more.”26 The Children’s Commissioner’s charity, 11 MILLION, took a representative
sample of 8-17 year olds in England and a sample of young people who live in seven ‘high risk’ areas and found that only 4% of 12-17 year olds admitted to carrying a knife either now or in the past, and for the majority carrying was an infrequent occurrence.27
27.While these findings indicate that knife-carrying does not take place on a large scale across the country, there is evidence from people living and working in some communities that levels are much higher. 11 MILLION found that to 26% of young people living in ‘high risk’ areas perceived knife crime to be either a big or fairly big problem in their area, compared to one in six young people nationally.28 One anonymous witness giving evidence
with The Prince’s Trust told us “I would say I think it is definitely a problem that is getting worse.”29 On the basis of research with police officers and youth offending teams, Policy
24 Youth Justice Board, MORI Youth Survey 2008: Young people in mainstream education, February 2009, p 46; Youth Justice Board, MORI Youth Survey 2008: Young people in Pupil Referral Units, February 2009, p 50
25 Q 163
26 Home Office, Young people and crime: findings from the 2006 Offending, Crime and Justice Survey, July 2008, p 22
27 11 MILLION/YouGov, Solutions to gun and knife crime, March 2009, Summary, p 2
28 Ibid
Exchange’s Gavin Lockhart argued “I think it is becoming normal for some groups in poor communities to carry a knife.”30
28.Dr Golding quoted Ministry of Justice statistics that showed a dramatic increase in knife possession detections over the past decade:
The number of convictions for carrying a knife between 1997 and 2006 has risen from 3,360 to 6,314. Arrests for having an article with a blade or point on school premises has increased by 500% over six years from 1999 to 2005.31
However, as we suggested earlier, this may indicate greater police and school activity to detect knife-carrying rather than purely an increase in levels of carrying.
29.Detective Chief Superintendent John Carnochan, of the Scottish Violence Reduction Unit, noted the irrelevance of official statistics for people living in affected communities. He said:
I actually want to increase the amount of violence that is reported to us … because right now only 50% of those who turn up at an A&E department (and it is the same in England) will report it to the police, so you are judging us on 50% knowledge, so whether it goes up or down is an absolute irrelevance, it is a measure of activity, because what will happen then, if you live in an area where there is loads of violence and you see it outside your front window, you will know someone who is in prison, you will know someone who has been a victim, and the chief officer stands up, or a politician, and says, “Relax; violence is going down”, and you when look out your front window you know that it is not; it is not your experience.32
A community worker from Peckham who attended our London seminar expressed a similar view, arguing that apparent complacency about knives on the part of the Government and the police would only serve to normalise knife-carrying.
30.The picture with regard to knife possession is complicated. The 2008 MORI Youth Survey indicated that 31% of 11-16 year olds in mainstream education and 61% of excluded young people had carried a knife at some point over the course of the previous year; however the 2006 Home Office Offending, Crime and Justice Survey found that only 3% of 10-25 year olds did. This discrepancy cannot be explained by the time lag between the surveys, as the numbers reporting carrying a knife actually decreased between the 2005 and 2008 MORI Surveys. It can partly be explained by the fact that the MORI survey includes legitimate carrying and the OCJS covers a wider age range. Anecdotal evidence indicated that in certain areas levels of knife-carrying have risen to the extent that carrying a knife has almost become “normal”. We therefore concluded that, although there is no definitive evidence of the extent of knife-carrying nationally, in parts of England and Wales it was at a level to be of significant concern.
30 Q 40
31 Q 1
Impact of the Tackling Knives Action Programme
31.The Government has responded to concerns about knife crime with the Tackling Knives Action Programme (TKAP). In June 2008 it pledged £5m additional funding for the ten police force areas in England and Wales judged to be most affected by knife crime—Essex, Greater Manchester, Lancashire, Merseyside, Metropolitan, Nottinghamshire, South Wales, Thames Valley, West Midlands and West Yorkshire—to support:
• Increased use of searches, in targeted and intelligence-led operations, to complement new portable knife arches and search wands;
• Fast-tracking the ‘knife referral project’ in which all young people convicted of a knife offence are taught the consequences of knife crime; and
• Home visits and letters to parents of young people known to carry weapons.
32.In December 2008 the Government announced a further £3.4 million for investment in after-school patrols and Safer Schools Partnerships, whereby police officers are based in schools; and an extra 7000 places for young people in ‘positive activities’ on Friday and Saturday nights in TKAP areas. TKAP was originally funded until March 2009 but has been extended for a further year and to a further two areas: Hampshire and Kent.33
33.We attempted to assess whether this had had any impact on crime levels. Deputy Assistant Commissioner Hitchcock , who was appointed to lead TKAP until his move to the National Policing Improvement Agency in April 2009, told us in January 2009 that the success of the programme should become evident in statistics for the period October-December 2008:
That will be the quarter when you will start to see the programme has had a significant impact and there has been a significant improvement.34
The figures for this period have since been published. Comparisons of quarterly statistics for April-June 2008, July-September 2008 and October-December 2008 show no clear trends for knife-enabled attempted murder, robbery, threats to kills, actual bodily harm and grievous bodily harm, rape and sexual assault, although the overall number of knife-enabled violent offences declined slightly from 9,608 in April-June to 9,400 in October-December.35
34.Provisional HES data for 2008 (which should be treated with caution because of its provisional nature) appear to show a decrease of 8.43% for the year during which TKAP was established: 4,899 admissions recorded between December 2007 and November 2008
33 “Tough new sanctions to tackle knife crime”, Home Office press release, 5 June 2008; “Tackling knives action plan, six months on”, Home Office press release, 11 December 2008; “Clamping down on serious youth violence”, Home Office press release, 11 March 2009
34 Q 96
compared with 5,350 admissions between December 2006 and November 2007.36
Parliamentary Under-Secretary of State at the Home Office, Alan Campbell MP, told us:
Recent provisional figures produced by the Department of Health that showed in the first period of the programme from June to November of last year that the fall in admissions to accident and emergency of the target group of individuals, 13 to 19 year olds, with reported stab wounds had fallen by 31%. I think if you compare that to the figures for the non-TKAP areas, which is 18%, we can begin to draw conclusions about the success of some of the work that has been done.37
We explore TKAP tactics in more detail in the relevant chapter.
35.The Government’s Tackling Knives Action Programme has been in operation for less than a year, therefore it is difficult to evaluate its success. It does not appear to have had a significant effect on reducing police recorded crime, although there have been signs of a notable reduction in hospital admissions in Tacking Knives Action Programme areas.
36 NHS figures, cited in “Knife hospital admissions down 8%”, BBC News Online, 12 March 2009, http://news.bbc.co.uk
3
Victims and offenders
The relationship between victim and offender
36.Most media coverage of knife crime focuses on stabbings that are gang-related or random stranger violence. In 2007/08, domestic knife violence constituted around 6% of all British Crime Survey violence, stranger knife violence constituted 4% and acquaintance knife violence 6%.38 In terms of victims of serious knife injuries that present to hospital,
Professor Brohi told us that “a very small proportion” of those seen at the Royal London Hospital are “innocent people walking down the street who are jumped on or stabbed” and only “a very small incidents of domestic violence crime lead to knife crime”: they mainly related to “gang culture”.39
37.Dr Golding argued that one reason for an increased focus on knife crime was a recent change in the nature of the problem: “the context is gangs and the prevalence of youth in a way that was never the case before.”40 Professor Brohi agreed, noting that trends in terms
of stabbings resulting from “brawls in the street” have been constant since records began but:
ed crime origin, with teenage school gangs which are more dependent on the area.41
clear definition of what comprises a gang. An anonymous witness from Merseyside told us:
ve to be careful when you say gangs because people
43
always be termed “gangs” is another matter. 44 The Youth Justice Board also told us while
The change that we see is really in the teenage group and the rise of a new demographic of teenager being stabbed. That is a very different category of person with a very different background and reason for carrying the weapon. They tend not to be alcohol-related and have more to do with school gangs or local gangs. When we talk about gangs it is important to separate out the organised gangs which tend to be people in their mid-20s and late 20s, often of ethnic or organis
38.The link between knives and street gangs varies by location, for example, in London and Glasgow there appears to be a strong link whereas in Birmingham and Manchester gangs are more associated with gun violence.42 A complicating factor is that there is no
When you say gangs, there are not just gangs that are violent, there are gangs of, like, friends, people who are just out for a laugh and out with their mates who are not doing anything wrong. You ha
might take it the wrong way.
Most offending by young people is group-related in some way; whether these groups can
38 Knife crime statistics, Standard Note SN/SG/4304, House of Commons Library, March 2009, Table 3
39 Qq 55, 58
40 Q 9
41 Q 53
42 Q 414, Annex B [Leeds seminar notes]
43 Q 342
“street-based groups of young people who are involved in offending may often be armed”, weapon-carrying “is by no means limited to groups.”45
39.While there are clearly examples of serious street-gang-related violence in large cities, MyGeneration founder Shaun Bailey has argued that society should keep a perspective about gang culture and not afford members a special status they do not deserve. He believes that fears about so-called colour coding have been blown out of proportion: ‘It does exist, but the wearing of a certain colour in a certain area is very unlikely to put you at risk … The gangs know who they are fighting with and who they are looking for … [Parents] should not be worrying that if their kid is from E12 and he goes into E1 he’s finished. It isn’t like that. There has been a certain amount of Hollywoodisation about gangs by the media.”46 This point was reiterated by one of the witnesses to our inquiry,
Kirk Dawes of the West Midlands Mediation and Transformation Services:
The vast majority of young men who get involved in gangs do not even know that is the way they are going until one day they wake up and realise they are part of a group of people who are behaving in a criminal way … We have given them the title “gangs”. In 2003 in Birmingham there were 27 gang-related murders, but I tell you now that the Johnson Crew and the Burger Bar Boys did not call themselves gangs; they did not realise it. These were friendships born out of school and childhood. Following some New Year shootings the media said that there were two gangs in Birmingham: the Burger Bar Boys and the Johnson Crew and over night we had two definitive gangs. They then began to believe in their own celebrity status and behaved in that way.47
40.A significant proportion of stabbings relate to brawling or domestic violence, but the rise in violent knife offences seen over the past few years is associated with street violence between groups of young people who share a territorial identity, often referred to as ‘gangs’. While young people often offend in groups, there may be a tendency to overstate the phenomenon of streets gangs and a danger that categorising groups of young people in that way may glamorise street violence. Random stabbings of innocent bystanders remain extremely rare.
Geography
41.Not surprisingly, London has the greatest volume of ‘most serious’ knife crime (34% of the national total), although the rate of offending per head for London is similar to Greater Manchester and the West Midlands (9.7 per 10,000 population compared to 8.8 and 8.3 respectively). London also has a higher than average proportion of knife-enabled murders (50% in London against a national average of 3%).48 The Youth Justice Board explained
some of the reasons why:
45 Ev 121
46 “Colour”, The Times, 11 July 2008, T2, p 4
47 Qq 406, 410
Evidence from youth justice practitioners supports the widely held belief that knife crime is a far bigger problem in London than in other major cities. There are many reasons for this trend, not least of which are the size of the capital and the proportionally higher number of gangs or other groups. There is evidence to show that other factors contribute to the problem, including the large number of transport links into and around London and the sheer number of postcode areas which young people often associate themselves with. Both of these factors serve to create natural geographical boundaries and generate a greater sense of territorialism, which can result in young people arming themselves with knives when leaving their local area.49
The BBC’s Mark Easton noted that of the 179 under-16s admitted to hospital with knife injuries in 2006/07, 40% were in London, whereas not one child in central and south-east England outside London was admitted.50
42.The 2008 MORI Youth Survey threw up some interesting results, finding that the highest incidence of weapon-carrying was in Wales and the North-East of England, at 35%.51 This may be explained by the fact that the survey included legitimate reasons for
possession. However, other evidence appeared to indicate that, although knife crime is predominantly an issue for large conurbations, it is also rising in other areas. For example, Policy Exchange found from research with youth offending teams (YOTs):
As expected, urban YOTs reported more increases in knife crime than rural ones, but the difference was not pronounced: 67% of urban and 55% of rural YOTs reported an increase in knife crime incidents among young offenders. This suggests that the phenomenon is spreading from urban centres to less densely populated areas.52
[image:25.595.90.507.498.776.2]Dr Lecky presented hospital data showing there has been a rise of knife injuries in rural areas since the mid-nineties, albeit less steep than in urban areas:
Figure 5: Knife injuries as proportion of all serious injuries 1994-2008: Urban/rural divide53
4.5
4.0
3.5
3.0
2.5
2.0
1.5
1.0
0.5
0.0
% knife injuries
1994 1995 1996 1997 1998 1999 2000 2001 2002 2003 2004 2005 2006 2007 2008
Urban 7 10 61 93 93 71 107 157 117 192 174 205 151 183 90 Rural: 1 1 12 11 16 23 12 7 14 9 17 15 20 16 4
Year
Rural Urban
49 Ev 121
50 “Knives, guns and teens”, Mark Easton’s UK blog, www.bbc.co.uk/blogs/thereporters/markeaston, 4 July 2008
51 Youth Justice Board, MORI Youth Survey 2008: Young people in mainstream education, February 2009, p 48
52 Policy Exchange, Going Ballistic: Dealing with Guns, Gangs and Knives (London: 2008), pp 43–4
43.Researchers at the Centre for Crime and Justice Studies have argued that “people living in poor neighbourhoods also stand a far greater chance of finding themselves at the wrong end of a knife”, noting that, in addition to suffering a higher rate of violent victimisation in general, about 60% of murder victims in the poorest fifth of areas in Britain die from being cut with a knife or broken bottle or glass as opposed to 30% in the wealthiest areas.54 The
nature of knife crime can also vary across the country. The Youth Justice Board argued:
It is worth noting that the experience of, and reasons for, knife crime amongst young people can be relatively varied between different cities and regions, and therefore assessments of the causes of knife crime need to take into account the local nature of the issue.55
An example of this is the extent to which knife crime is associated with street violence.
Ethnicity
44.Patterns of knife offending and victimisation tend to reflect the ethnic composition of the local population rather than being linked to any particular culture(s). For example, Professor Brohi told us in relation to the Royal London Hospital, which is in East London, that:
We do not have solid figures but our local area is such that the majority of the youth-related stab victims are Asian or black. 56
Whereas we heard our at Leeds seminar that knife offenders in Manchester, for example, would be more likely to be white. This was supported by evidence from Assistant Chief Constable Crowther of the British Transport Police, in relation to knife-enabled robbery and assault.57
45.In terms of knife-carrying, the 2008 MORI Youth Survey found “no significant difference in terms of carrying a ‘knife or ‘gun’ across ethnicity overall”.58 11 MILLION
found that young people from a black and minority ethnic background were more likely than their white counterparts to say that knife crime was a problem in their area, but the majority of current or former knife carriers were white.59
46.We asked specific questions about the relationship between knife-carrying and immigration, in light of evidence to our inquiry into Policing in the 21st Century which
indicated there could be higher levels of carrying amongst immigrants from Eastern Europe.60 Dr Brohi noted that the Royal London Hospital does see evidence of knife use by
organised criminal gangs originating from the Baltic states and Turkey, but “the rising
54 Chris Eades, Roger Grimshaw, Arianna Silvestri, Enver Solomon, Knife crime: a review of evidence and policy, 2nd
edition (London: Centre for Crime and Justice Studies, 2007), p 24
55 Ev 121
56 Q 65
57 Qq 142–3
58 Youth Justice Board, MORI Youth Survey 2008: Young people in mainstream education, February 2009, p 47
59 11 MILLION/YouGov, Solutions to gun and knife crime, March 2009, Summary p 2
demographic of youth crime tends to be related to the local population who are not really immigrants; they are British Asian, British black or in Manchester British white people.”61
47.Violent knife crime is concentrated in the deprived areas of large cities. The nature of knife crime may vary between cities and is not always linked to street violence. While hospital data show a rise in the number of knife injuries sustained in rural areas since the mid-1990s, the trend does not mirror the rapid rise seen in urban areas since 2006 and incidence remains considerably lower than in urban areas. While some immigrants from countries where knife-carrying is socially acceptable may be more predisposed to carry knives, knife use is not linked to ethnicity but rather reflects the local demography.
Age
48.The largest proportion of offenders and victims affected by knife crime are those in their late teens and twenties. For example, the largest category of both offenders and victims in crimes recorded by the Metropolitan police is 18-29. This conforms with data for overall violent offences which show that more than 85% of violent offenders are between the ages of 16 and 29 and the risk of being a victim of violent crime is almost four times greater for young men aged 16-24. According to data supplied by the Trauma Audit Research Network, the median age of hospitalised victims is 27.8.62
49.However, a clear theme that emerged from our evidence was that knife-carrying and use is increasingly affecting children and younger teenagers. For example, between 2003 and 2007 hospital admissions for knife wounds increased by 62.7% for children under 16, from 110 to 179 (although more recently admissions of teenagers have fallen).63 Dr Iain
Brennan told us at our Bristol seminar that the median age of British Crime Survey victims has declined since 2004/05.64 According to Dr Golding, “one of the issues reported to us is
the increasing youth of some of the people who engage in this type of criminality.”65 Citing
their then-most recent data, between April and August 2008, the Metropolitan Police told us that 24% of knife victims, 31% of knife-enabled offenders and 27% of knife possessors were under 18.66 This trend was corroborated anecdotally, for example according to one
anonymous witness giving evidence with The Prince’s Trust:
People get involved in it earlier. I do not know exactly the statistics or numbers overall, but I think that is what is quite worrying for me.67
50.We tried to establish the age at which young people were most likely to carry a knife. 11 MILLION’s research (with 8-17 year olds) found that the majority of current or former
61 Q 66
62 Ev 130 [Metropolitan Police]; National Audit Office, The Home Office: Reducing the risk of violent crime, February 2008, p 12; KC 26 [Trauma and Audit Research Network]
63 Knife crime statistics, Standard Note SN/SG/4304, House of Commons Library, March 2009, p 13; NHS figures, cited in “Knife hospital admissions down 8%”, BBC News Online, 12 March 2009, http://news.bbc.co.uk
64 Annex D
65 Q 4
66 Ev 130
knife carriers were aged between 15 and 17.68 The 2008 MORI Youth Survey (of 11-16 year
olds) reported that 15-16 year olds were more likely to report having carried some kind of weapon than their younger counterparts, although the difference was not dramatic at 34% versus 30%.69 The most common age at which the excluded pupils and young offenders
interviewed for Why Carry a Weapon?, a piece of research carried out by Nicola Marfleet and published by the Howard League for Penal Reform, had carried a knife for the first time was 11.70 We also heard instances of some really young children carrying knives:
You do get children from the ages of around seven, eight and nine carrying weapons such as knives … You can find people from the age of about seven onwards carrying knives and in not only our estate but around Bootle and other areas. It is horrible.71
Gender
51.Knife-enabled offences are predominantly perpetuated by males on other males. For the most serious cases that end up in hospital, Professor Brohi told us: “Ninety-five per cent of our knife patients are male. The only female patients are those who suffer from domestic violence. Therefore, this is really a male problem.”72 Data from other hospitals
[image:28.595.79.516.376.425.2]corroborates this evidence:
Figure 6: Penetrating Injury Audit: Stabbings by gender, July-December 2008 (Greater Manchester)73
Gender Frequency Percentage
Male 154 89.5
Female 18 10.5
Total 172 100
This mirrors overall violence trends: more than 85% of violent offenders are male.74
52.The 2008 MORI Youth Survey found that boys are predominantly more likely to admit to carrying a knife or gun than girls: 45% of boys compared with 16% of girls. The OCJS 2005 study had similar findings: 5% of boys versus 2% of girls. One anonymous witness told us that in his area of Merseyside girls do carry knives, though maybe for different reasons:
There is a ratio of about 30% of girls that carry around knives and 70% of boys carry around knives because girls have got more reason. Girls have reasons for carrying knives such as rape, assault and other reasons such as that.75
53.Males in their late teens and early twenties constitute the majority of perpetrators and victims of violent knife crime, which is consistent with other types of violent offending. However, the number of under-18s affected has risen. The age at which
68 11 MILLION/YouGov, Solutions to gun and knife crime, March 2009, Summary p 2
69 Youth Justice Board, MORI Youth Survey 2008: Young people in mainstream education, February 2009, p 47
70 Nicola Marfleet, Why Carry a Weapon? A Study of Knife Crime Amongst 15-17-Year-Old Males in London (London:
Howard League for Penal Reform, 2008), p 59
71 Q 338
72 Q 64
73 Ev 194
74 National Audit Office, The Home Office: Reducing the risk of violent crime, February 2008, p 12
young people carry knives is also worrying: the incidence of carrying is highest amongst older teenagers, but we heard instances of carrying by children as young as seven. 11 seemed to be a key risk age for first carrying a knife, presumably linked to the transition from primary to secondary school. Boys are far more likely to carry a knife than girls.
Types of knives
[image:29.595.86.351.265.414.2]54.The 2008 MORI Youth Survey found that the two most common weapons carried were a penknife (17%) and a BB gun (15%). The 2005 and 2006 Offending, Crime and Justice Surveys also found that penknives were carried more commonly than other knives:
Figure 7: Type of knife carried by 10-25 year olds in the last 12 months among those carrying knives, 2005 OCJS76
Pen knife
Flick knife
Other type of knife
Kitchen knife
0% 10% 20% 30% 40% 50% 41%
29%
20%
10%
However, carrying a penknife is usually legal and cannot automatically be linked to sinister intent. 6% of knife-carriers reported carrying a flick knife and 4% a kitchen knife.77
Speaking in reference to the police stop and search operation, Blunt, Dr Golding told us that kitchen knives only constitute “about 10%” of the knives that are used and found, whereas a significant proportion are flick knives and penknives. He noted that about 20% are described as “other”, meaning other illegal weapons, sharp instruments, gravity knives and so forth.78
76 Home Office, Young People and Crime: Findings from the 2005 Offending, Crime and Justice Survey, December
2006, Figure 2.6
77 Youth Justice Board, MORI Youth Survey 2008: Young people in mainstream education, February 2009, p 46
55.In terms of use to cause injuries, Dr Lecky presented Trauma Audit Research Network data indicating that kitchen knives were used most often:
Figure 8: Penetrating Injury Audit: Stabbing assault weapons used July-December 200879
Weapon Total Percentage
Kitchen knife 59 34
Unidentified knives 37 21.5
Other 11 6.5
Flick knife 5 3
Glass 11 6.5
Penknife 2 1.2
Unidentified weapon 47 27.3
172 100
56.Hospital data analysed by the Trauma Audit Research Network indicates that the type of knife used to injure most frequently is the kitchen knife, probably because of its easy availability. However, young people tend to admit to carrying penknives, flick knives and other kinds of knives, which are also more commonly found by the police during stop and search operations. This may suggest that the knives used to cause serious injury may differ from those that are routinely carried. The MORI Youth Survey found that penknives were the most common weapon carried by young people, but to some extent this will be for legitimate purposes: only 1.2% of stab wounds recorded by TARN hospitals during the second half of 2008 were caused by penknives.
4
Causes
In this chapter we explore why young people carry knives and factors influencing violent behaviour.
Protection
57.“Protection” tends to be the number one motive given for illegal knife-carrying. A commonly cited figure, taken from the Home Office’s 2006 Offending Crime and Justice Survey, is that 85% of young people carry to protect themselves. Other studies have discovered similar findings. Behind legitimate use, the most common reason given by knife-carriers to the 2008 MORI Youth Survey was “to protect myself”. In Why Carry a Weapon?, all focus groups bar one stated that “protection” was the primary reason why young people their age chose to carry a knife.80 Young people claim they need a weapon to
protect themselves because they feel unsafe.
58.Ian Levy, the father of stab victim Robert Levy, pointed out the weakness of these surveys: “almost all young people you ask, will say they carry it for protection, because that is the simplest and easiest reason to justify the possession of a knife.”81 We accept that we
should treat the figures with caution, and that fear does not excuse weapon-carrying, but it was clear from other evidence that a perceived need for protection does play a role in the decision of many young people to carry knives.
59.This fear tends to be exacerbated by a presumption that others will be carrying knives. One witness who gave evidence anonymously with The Prince’s Trust and who used to carry a knife compared the situation to an arms race:
It was not like I was carrying it because I was going to go and stab someone, it was just other people were doing it so it was just like an arms race. I think in a way—and this is a personal opinion—to make it equal, governments have nuclear weapons because someone else has got nuclear weapons. It is to defend ourselves. No-one wants to use it but it is just there as a deterrent.82
60.Some witnesses pointed to the issue of “territoriality” as a key factor in why some young people felt the need for protection. A recent study published by the Joseph Rowntree Foundation found that, for 13-17 year old boys and to a lesser extent men in their twenties in particular, identity has become strongly linked to neighbourhood, which often expresses itself through violent conflict with groups from other neighbourhoods. A young offender from London interviewed for Why Carry a Weapon? described how this affected his decision to carry a knife:
In my area, I’m going to see my girl and she lives in Palmers Green, I have to go through Wood Green to get to Palmers Green, and I’ve got beef with Wood Green,
80 Home Office, Young people and crime: findings from the 2006 Offending Crime and Justice Survey, July 2008, p 14;
Youth Justice Board, MORI Youth Survey 2008: Young people in mainstream education, February 2009, p 49; Nicola Marfleet, Why Carry a Weapon? A Study of Knife Crime Amongst 15–17–Year Old Males in London (London: Howard League for Penal Reform, 2008), pp 60–1
81 Q 231
man. I get shot, or like if they don’t have a strap on them then they chasing up trying to move me up. I’d rather have a shank and flick it out and start wetting man than get stabbed myself. Cos if you have a shank, and they haven’t, they’re gonna back off.83
61.Even those who do not form part of a group linked to a territory may find themselves at risk of attack when crossing into another area.84 An anonymous witness giving evidence
with The Prince’s Trust explained that the majority of young people in his community in Basildon would only carry a knife if they were going into an unfamiliar area and another giving evidence with 11 MILLION told us that he was at risk of mugging or assault if venturing onto another estate in Merseyside.85
62.The perceived need for protection is linked to experiences of victimisation: in the 2008 MORI Youth Survey, 27% of young people who claimed to have been a victim of crime reported carrying a knife at least once or twice afterwards, compared to 20% of non-victims; 7% reported carrying a knife three or four times compared to 4% of non-victims.86
Dr Iain Brennan told us that British Crime Survey data also indicated that being a victim of violence in the previous 12 months increased the likelihood of carrying a weapon.87
63.There is also a relationship with lack of trust in ‘natural protectors’, such as the police, as explained in Why Carry a Weapon?:
It was unanimous from all 18 participants that the police and their parents could not protect them, but a knife in some circumstances could … The police are saying that they keep you safe, but the police ain’t gonna protect you 24-7, 52-weeks. Obviously you’ve got to have something to protect you … Several boys mentioned that rather than their parents protecting them, it was their job to protect their mothers and younger siblings.88
Frances Crook, of the Howard League for Penal Reform, told us that the research had also found that parents were not responding in a helpful way to their children’s safety concerns.89 We return to this point in paragraph 128.
Influence of media coverage
64.We heard concerns that intense media coverage of fatal stabbings, particularly over the summer of 2008, may have led to an increase in young people carrying weapons because it fuelled the perception that everyone else was carrying them. The crime reduction charity Nacro, for example, argued:
83 Nicola Marfleet, Why Carry a Weapon? A Study of Knife Crime Amongst 15–17–Year Old Males in London (London:
Howard League for Penal Reform, 2008), pp 77–8
84 Keith Kintrea, Jon Bannister, Jon Pickering, Maggie Reid and Naofumi Suzuki, Young people and territoriality in
British cities (York: Joseph Rowntree Foundation), October 2008
85 Qq 273, 370
86 Youth Justice Board, MORI Youth Survey 2008: Young people in mainstream education, February 2009, p 50
87 Annex D [Bristol seminar notes]
88 Nicola Marfleet, Why Carry a Weapon? A Study of Knife Crime Amongst 15–17–Year Old Males in London (London:
Howard League for Penal Reform, 2008), pp 61, 67
The suggestion that it is in any sense the norm to carry weapons is likely to increase the number of young people who do so, simply because they fear attack and wish to have the means to protect and defend themselves.90
Mothers Against Murder and Aggression Wales explained that when they ask young people “What do you think is the biggest cause of knife crime and why do you think young people carry a knife”:
More and more the answer is 'the media'. On discussing this issue the children tell us that they see so much in the news about knife crime and the way it is portrayed it gives a message that all teenagers are thugs and are armed. They know this is not true about the areas of Wales that they live in but it still frightens them. Almost everyone who has carried a knife or knows someone who does feels they have to protect themselves because everyone else is doing the same 91
Several other organisations, including SmartJustice and World of Hope, expressed concern about the impact of the media’s negative portrayal of young people:
The attitude of the media, who focus very negatively on young people also contributes to the problem. Screaming headlines about a ‘war on young thugs’ contributes to the concept that for some young people there is a war being waged against them and they should be fighting back.92
65.However, other witnesses cited positive aspects of some media coverage. Mrs Oakes-Odger, who has campaigned against knives since the fatal stabbing of her son Westley Odger, described how the media had helped to raise the issue of knife crime up the political agenda, as well as being a conduit for a Home Office campaign to engage community organisations last summer.93 Not all of the media coverage has been sensationalist. The
Daily Mirror, for example, has given practical advice to parents on how to talk to their children about knives.94 Valerie Okoampah and Kane Pierce, pupils at Gladesmore
Community School in Tottenham, London who are part of a student-led anti-knife campaign called Value Life, explained how Choice FM radio station had helped spread their message by covering their campaign and providing DJs for their rallies and marches.95
66.The Royal Armouries Museum, in their literature review of evidence on knife crime, argue that “changing the culture of newspaper reporting is obviously easier said than done but responsible reporting could be facilitated by issuing good quality press briefings about knife-carrying and knife crime that feature reliable research and statistics.” 96 A 2007 report
by the Centre for Criminal Justice Studies gave the example of a Metropolitan Police statement to publicise the national knife amnesty which said that “52 teenagers are victims of knife crime EVERY week in London”: members of the public could reasonably have
90 Ev 104
91 Ev 184
92 Ev 103 [World of Hope]; Ev 106 [SmartJustice]
93 Q 225
94 For an example, see “How parents can win the war against knife crime”, The Daily Mirror, 12 June 2008, p 39
95 Q 471
96 Royal Armouries Museum, Tackling Knife Crime: A Review of Literature on Knife Crime in the UK, December 2007,