The impact of vibration on comfort and bodily stress while cycling
John Parkin, Professor of Transport Engineering, University of the West of England Eugénie Sainte Cluque, Student, London South Bank University
Abstract
This paper reports preliminary work to understand the nature of vibrations from riding a bicycle and how these may impact on human comfort and bodily stress.
There are two parts to the study. The first part comprises results from a survey of cycle users which investigates potential comfort and health factors resulting from cycling and shows that health issues during and after cycling are not uncommon. These issues predominantly concern hand/arm, knee and back pain, and that they are presumed by the respondents to be caused predominantly by rider position and the condition of the road surface.
The second part reports evidence on the nature of vibrations from riding a bicycle in different circumstances. This data has been collected in London on routes of different surface roughness using a bicycle equipped with an accelerometer which measures vertical acceleration amplitude. The data collected shows that workplace vibration Exposure Action Values are exceeded for a typical commute journey and, indeed, Exposure Limit Values may be exceeded. Collecting field data presents challenges in terms of the repeatability of the measurements and comparability between measurements and these challenges are being further considered in order to identify recommendations for more extensive experimentation.
Keywords: vibration, bicycle, human health, human comfort
1 Introduction
There has been an increase in commuter cycling in a number of localities within the UK over the decade to the 2011 census. Bristol, for example has seen a 3 percentage point increase to 8%, and thirteen of the thirty three London Boroughs now demonstrate more than 5% more share for cycling to work, with Hackney at 15% (Goodman, 2013). The mean journey length for those using the Cycle Superhighways in London is in the order of eight miles. As more commuters adopt cycling as their preferred mode of transport, and also as ‘last mile’ delivery and courier work is increasingly being undertaken by bicycle, it is important to understand problems entailed in prolonged physical effort and exposure to vibration. The catalyst of the research presented here has been the personal experiences of the authors where new (ESC) and longer (JP) commuting journeys on a new bicycle led to a severe permanent headache (ESC), and neck discomfort (JP). This is presumed to result at least partly from vibration caused by vertical impact of the bicycle on the irregularities of road surfaces.
Roughness impacts on comfort, effort, and, to some degree, the health of the cyclist as will be seen in the Section 4. However, the methodology for assessing road surface condition is more concerned with motor vehicle performance than bicycle performance. The HARRIS Vehicle (Highway Agency Road Research Information System) vehicle is used to collect data at road speed in a process known as SCANNER (Surface Condition Assessment for the National NEtwork of Roads) (UKPMS, 2005). The Road Condition Index (RCI) is used to prioritize maintenance, and thresholds for intervention are shown in Table 1.
Table 1 Thresholds for road defect types
Defect Investigation
threshold
Maintenance threshold
Rutting 10mm
12mm for B roads
20mm 25mm for B roads 3m Longitudinal profile variance 4mm2 10mm2 10m Longitudinal profile variance 21mm2 56mm2 Whole carriageway cracking intensity 0.15% 2%
Wheel track cracking intensity 0.50% 5%
shown in Table 2.
Table 2 Road Condition Index from SCANNER Data
Defect Importance
factor
Reliability factor
Combined factor
Max. score
Rutting 0.9 1.00 0.9 90
3m Longitudinal profile variance 0.8 1.00 0.8 80 10m Longitudinal profile variance 0.6 1.00 0.6 60 Whole carriageway cracking intensity 0.9 0.55 0.5 50 Wheel track cracking intensity 0.9 0.44 0.4 40
Texture 0.5 1.00 0.5 50
Maximum total RCI score 370
Maximum total RCI score 370
The point to note is that texture has the lowest weighting of all the different factors, but this more microscopically sized defect is of potentially greater importance and a source of discomfort for cycle traffic. Denmark and The Netherlands are further advanced than the UK in considering appropriate measures for road surface condition so far as cycle traffic is concerned. Odense has developed an algorithm to transform laser and accelerometer data into ‘Bicycle Profile Index’ (BPI) (Henriksen, undated). The Dutch Cycle Union, has also developed an index for vibration measurements taken from a bicycle.
Cycling in western societies is being increasingly promoted as a healthy lifestyle with positive impacts on all aspects of the environment and, in times of economic recession, it may also be viewed as a cost effective way to travel short to medium distances. The bicycle manufacturing industry continually develops bicycles to suit all tastes and needs, and local authorities continue to develop dedicated infrastructure for cycle traffic.
Work has been undertaken relating to competitive cycling and comfort (e.g, Chiementin et al., 2012, which considers only to hand-arm vibration) and also work relating to more general cycling (e.g., Hölzela et al., 2012, which considers the additional effort required because of vibration). There is a gap in the literature in relation to whole body vibration for every-day cycling. Ultimately, it will be helpful make recommendations concerning highway surface roughness, however, the aim of the work presented here is to offer a preliminary assessment of the impacts of vibration while cycling on human health. The specific objectives we address are as follows:
• To understand potential vibration induced health consequences of cycling by undertaking a survey of regular cycle users;
• To understand the typical dosage of vibration which a commuter cyclist might be exposed to; and
• To make recommendations for more extensive research in the field.
Section 2 presents the results of responses to a web-based survey of cycle users concerning their experiences of cycling in relation to vibration. Section 3 summarises the methodology for the field work and Section 4 presents the results of fieldwork to assess vibration dosage for a typical commute. Section 5 makes recommendations for further research and Section 6 provides a short conclusion. It should be noted that an earlier version of this paper was presented at the Institute of Acoustics (Sainte Cluque and Parkin, 2013).
2 Survey of cycle users
Of the 644 respondents, 79% were male, and 51% suggested that cycling was their ‘main type’ of transport. 51% were in the age range 46-64, with 24% being older. Only 6% of the sample was in the age range 19 to 30. Figure 1 shows the amount of cycling undertaken per week by the sample.
Figure 1 Percentage by hour bands of cycling activity per week
Approaching a third of the sample cycled for between two and five hours a week, and between five and eight hours per week, with a significant minority, 46%, cycling in excess of eight hours per week. 78% of the sample has cycled for four or more years, with 56% of the sample having cycled for more than ten years. Figure 2 shows the riding positions usually adopted by the sample.
Figure 2 Riding position
The majority of respondents report adopting riding position 2 or 3, and both of these positions place greater force in supporting body weight through the hands and arms than do the higher numbered riding positions. Table 3 shows the materials of the bicycles ridden by the respondents and the type, if any, of suspension.
Table 3 Bicycle materials and degree of suspension
None Fork Seat Post Total
Steel 230 25 29 284
Aluminium 197 63 46 306
Titanium 29 1 0 30
Carbon fibre 50 12 4 66
Unknown 23 9 11 43
Total 529 110 90 729
Note: totals sum to more than the sample size because bicycles with fork suspension may also have seat post suspension.
Respondents report cycling most often on roads with bound surfaces with either minor or major defects, and this suggests that the riders in the sample do not frequently use off-road routes. There may be an element of policy response bias, with respondents perhaps wishing to make a point about the nature of the surfaces they ride on. Nevertheless, it is clear that the majority are of the view that the roads which they use are defective. Table 4 summarises responses concerning discomfort and pains while cycling.
Table 4 Discomfort and pains reported during and after cycling
During cycling After cycling Total
Hand/arm numbness 420 130 550
White fingers 100 40 140
Trapped nerves: hand/arm 38 22 60
Elbow pain 47 38 85
Head Ache 32 40 72
Knee pain 142 125 267
Upper back pain 65 42 107
Lower back pain 136 105 241
Trapped nerves: legs 10 9 19
Total 990 551
Note: Totals sum to more than the sample size because multiple responses were allowed
The majority of respondents reported some sort of discomfort both during and after cycling, with a reduction in continued discomfort after cycling. The most common issues are hand or arm numbness, knee pain and lower back pain. There are 144 cases of reported prolonged pain some hours after cycling, and 70 instances where the issue was taken to a medical practitioner. In addition to the choices offered to respondents, they also reported thirty other types of complaint, with neck pain being the most common. Of these discomfort complaints, respondents associated 25% of them with uneven road surfaces, and 21% of them with body position while riding. Cold weather was associated with causing 12% of the problems.
Overall, it may be concluded that, from a sample of mature and experienced riders who use their bicycles frequently, there are significant issues with discomfort from cycling, some of which may develop into health problems. These issues predominantly concern hand and arm blood flow issues (numbness and white fingers), knee pain and back pain, and that they are caused predominantly by rider position and the condition of the road surface.
3 Field work methodology
3.1 Protocol
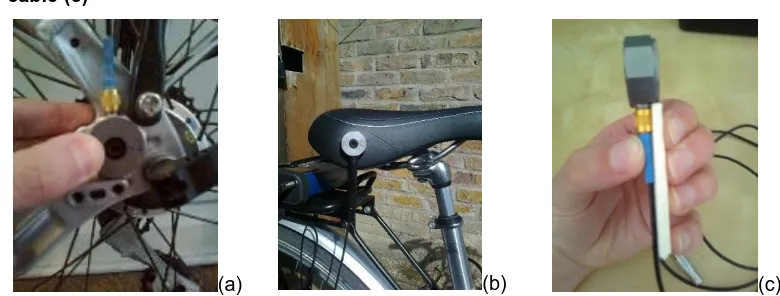
[image:4.595.103.423.82.248.2]Table 5 Summary of variables and illustration
Variable description Abbreviation Illustration Bicycle One: Salcano Liberty steel framed with
Schwalbe Marathon Plus tyres
B1
Bicycle Two: Specialized Hybrid with aluminium frame
B2
Fixed seat-post + basic saddle FP Suspension seat-post + gel saddle Madison L-22 SP Bitumen macadam surface with fine grade
aggregate. Pitshanger Park, W5 London 274.5 m
Very smooth (no photograph available) Bitumen macadam surface with medium grade
aggregate. Eaton Rise, W5 London 612 m
Smooth
Bitumen macadam surface of either fine or medium grade aggregate with minor defects such as re-instatements and small surface defects. Woodfield Road, W5 London 419 m
Medium
Bitumen macadam surface of either fine or medium grade aggregate with major defects such as medium and large pot holes and depressions. Pitshanger Park, London, W5 London 273.7 m
Rough
Notes
1 A designation B1-SP indicates bicycle one with a suspension seat post.
2 The grade of the aggregate and other road surface judgements were performed by eye.
The equipment and parameters of measurements are summarised in Table 6.
Table 6 Summary of equipment setting
Parameters Equipment Svan958 + Dytran3233A 28g
Axis vertical
Weighing wk
Measurements acceleration amplitude expressed as VDV (m/s1.75) acceleration amplitude expressed as r.m.s (m/s2) Frequency range 0.5 Hz to 20 kHz
Frequency bands 1/3 octaves
Integration 100 ms
Range 300 m/s2
Placement of the accelerometer
Rear axle
Seat-post closest to the saddle possible saddle
In addition to the stretches of road described above, data were also collected on a commute journey in London, from Blakesley Avenue, (Ealing), to Uxbridge Road (Hammersmith and Fulham), a distance of 6.6 km.
[image:5.595.121.508.75.362.2]the cable (c)
(a) (b) (c)
Ideally, repeatable tests would have been carried out. However, testing in the ‘natural environment’ meant that there were, to some extent, variations in speed, time of exposure (50 seconds to 2 minutes and 30 seconds) and inconsistent paths along the selected routes dependent on traffic flow and parked cars. As such, the results are not directly comparable to each other. Nonetheless, they provide good indicative results.
The approach taken has allowed for the main parameters of importance for whole-body vibration to be determined. We have analysed the frequency spectrum to identify peaks and their implications for whole-body and head vibration. We have also considered the data in relation to safe limit doses for workers exposed to vibration under health and safety legislation.
3.2 British Standard for human exposure to whole-body vibration
Cycling usually involves a degree of ‘shock’ and also ‘transient vibrations’. In such cases, BS ISO 2631-1:1997 (BS, 1997) on human exposure to whole-body vibration recommends the use of fourth power root mean quad (r.m.q.), and is termed the Vibration Dose Value (VDV) which is estimated using equation 1.
{∫ [ ] } Equation 1
is the instantaneous frequency weighted acceleration and is the duration of measurement. The unit for VDV is ⁄ . This approach is superior for assessing the severity of peaks in vibration as compared with the usual evaluation method of the root mean square (r.m.s.) which tends to underestimate the peak values, as is shown in Equation 2.
[ ∫ ] Equation 2
The r.m.s. and VDV values are also different in the fact that the r.m.s. represents an average value, while the VDV represents a cumulative value.
3.3 Control of vibration exposure in the workplace
Exposure to vibration in the workplace is controlled by European Directive 2002/44/EC11 (European Parliament and European Council, 2002). Values are the acceletation amplitude measured over a period of time Tand expressed over an eight hour period (T0) as shown in
Equations 3 and 4.
√ Equation 3
√ Equation 4
and are the daily exposures to vibration in the i axis, where i is the x, y or z axis, and ki is a multiplying factor determined for each axis. is the duration of exposure to
[image:6.595.85.475.99.247.2]Table 7 EU Directive EAV and ELV for A(8) and VDV(8)
EAV ELV
A(8) 0.5 m/s2 1.15 m/s2
VDV(8) 9.1 m/s1.75 21 m/s1.75
4 Fieldwork results
In this section we present four analyses: time history plots of VDV and r.m.s.; comparisons of VDV against speed and bicycle characteristics; frequency spectrum analysis and finally an analysis of daily vibration dose against regulations.
4.1 Time history plots of VDV and r.m.s.
Figure 5 is the time history plot of 100 millisecond integrations of VDV values over 50 seconds for the z-axis for Bicycle One with a suspension seat-post with the accelerometer placed on the seat-post for the two extreme conditions of a very smooth and a rough road.
[image:7.595.128.513.442.568.2]We have not provided a vertical scale to Figure 5 because the issues of overloading of the accelerometer that we used, but the estimates are appropriate for comparison purposes between the two conditions. Figure 5 confirms that the vibration induced by a rough surface is made of a series of impacts with great variation in amplitude with a number of occasional very large amplitude ‘shocks’ and ‘transient vibrations’. The vibration induced by the smooth surface is relatively low and consistent. Different grades of road surface may require different averaging methods: VDV for rough surfaces and r.m.s for smooth surfaces. However, such an approach would make comparisons difficult.
Figure 5 VDV of 100ms integrations over a 50 second measurement at seat post for Bicycle One with suspension seat post for very smooth and rough roads
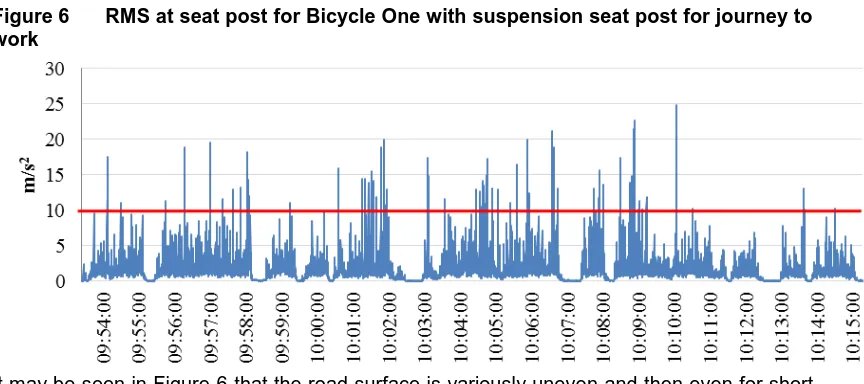
work
It may be seen in Figure 6 that the road surface is variously uneven and then even for short sections, with different degrees of defects up to the category ‘rough’ for the majority of the journey. There a large number of peaks in excess of 10 m/s2, which is an acceleration known to damage heath (Griffin, 1994). Considering that this journey in ridden six times a week by the author (ESC), this finding reveals cause for concern.
4.2 VDV compared with speed and bicycle characteristics
We have undertaken some preliminary comparisons of VDV compared with road surfaces, speed and bicycle characteristics. The estimation of VDV has been difficult because of the inappropriate sensitivity of the equipment which we used. However, the relative results of VDV are, we believe, still an appropriate measure to compare variations against road surfaces speed and bicycle characteristics.
A mixture of Bicycle One and Bicycle Two and fixed and suspension seat-posts was used for this part of the test. The ‘smooth’ and ‘medium’ surfaces were on a gradient and hence allowed for testing over a greater variation in speed than for the ‘very smooth’ and ‘rough’ surfaces. The length of section varied from 245m (very smooth) to 610m (smooth). It should be noted that these variations in length (hence time of exposure) do also have an impact VDV. Other than this, the variations in duration of the tests relate directly to differences in speed.
We found that road surface condition is the greatest source of variation of VDV. There is greater variation in VDV for Bicycle One with a fixed post (B1-FP) where the surface has localised defects (medium surface). Such variability could lead to the perception that vibration is greater where the road surface is not consistently of the same grade.
We also found a positive association between speed and VDV, with variability in association likely to be linked to some extent with the issue of imperfect repeatability between tests (for example not exactly following the same precise course). We also observed a significant decrease of VDV at higher speed.
The measurements taken at the back wheel generally demonstrate a larger VDV than those taken at the seat post. We observed a lesser variation where the bicycle is cycled uphill which represented the lower speeds for the ‘smooth’ and ‘medium’ conditions. Cycling uphill involves more side-to-side swaying motion and this could indicate that such swaying motion has a damping effect on vertical vibration. The lateral axis in the horizontal plane would need, therefore, to be part of the measurement.
[image:8.595.75.507.77.269.2]seat post are the greatest on the rough surface, and for the steel frame. It would seem that the behaviour of the damping changed after a certain threshold. Differences between bicycles are not likely to be confined to their material, but will also be a function of the bicycle geometry (seat and chain stay angles; seat, down and top tube angles; front fork angle and trail) and tube sizing and strength, and all contribute to variations in the damping profile of the system.
[image:9.595.123.509.542.710.2]So far as seat post suspension is concerned, the difference for Bicycle One between a fixed and a suspension post seem to indicate that the effectiveness of shock absorption increases with the level of roughness of the surface. Table 8 summarises the findings from this part of the analysis.
Table 8 Summary of possible sources of impact on VDV
Variable Comment
Road surface condition Greatest source of variation in VDV Variability in road condition (smooth to rough) Possible contribution to VDV
Higher speed Higher VDV up to a threshold, reducing thereafter Measurement position on bicycle Higher VDV at back wheel than seat post Uphill cycling side-to-side swaying motion May impact on VDV in the vertical axis Bicycle material and geometry Impact on VDV in different ways Seat post suspension Reduces amount of VDV
Based on the research having been predicated on the basis of headaches while cycling, it is worth returning to that subject. Measurements with B1-FP, B1-SP, and B2-FP were carried out on different days and a headache was felt by the rider (ESC) after cycling B1-FP and B2-FP, but not with B1-SP. On B1-FP and B2-FP the cyclist assumes a position close to the riding position 4 of Figure 2, whereas on B1-SP, riding position 3 is observed. The other differences are the suspension seat-post and a gel saddle on B1-SP. It should be noted that the weather during the experiment was cold enough to have intermittent snow, which could have increased the likelihood of the development of a headache.
4.3 Frequency spectrum analysis
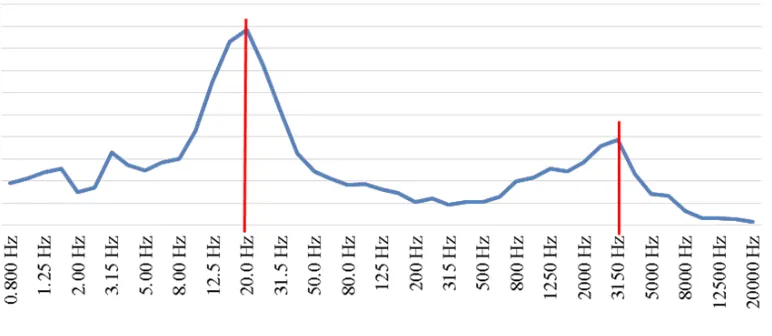
Frequency spectrum analysis has been undertaken to identify resonant frequencies of the Bicycle One/Rider system. Figure 7 shows the frequency spectrum of the r.m.s. acceleration amplitude at the seat post with suspension and a gel saddle, and experienced on the journey to work. Figure 8 shows the same, but for the saddle.
suspension post and gel saddle
In whole-body vibration where the subject is seated, frequencies above 400Hz are not generally considered as the seat usually has padding which acts as an absorber. The accelerometer allowed the measurements to be taken up to 20 kHz, and so the full spectrum was observed.
In Figure 7 there is a resonance at 3.125 kHz but none at this frequency in Figure 8. This tends to confirm that the gel saddle has a high degree of absorption of vibration, for which it was designed, and it can be argued that other saddles might present a different profile and therefore the frequency spectrum should be observed over a larger range than just up to 400Hz.
Figure 7 and 8 show distinct resonances below 400 Hz. Where the accelerometer is placed on the seat-post, the resonance is at 20 Hz, which coincides with the natural resonant frequency of the head: 20 to 30 Hz (Bruel & Kjaer in Peters et al., 1996). Where the accelerometer is placed on the gel saddle, the resonance peaks at a lower frequency: 16 Hz. No measurement was taken at the saddle on Bike 1 with the original setting of fixed post and basic saddle (this was the condition in which a severe headache had been experienced). Nonetheless, it is reasonable to assume that the system has a similar resonance at the seat post, and the reduction of the severity of the headache might be due to a significant shift of the resonance due to the greater absorptive nature of the gel saddle, as much as a reduction in amplitude of vibration.
4.4 Daily vibration dose comparisons with regulations
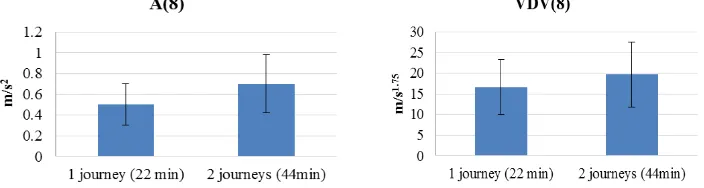
As has been noted, VDV is recommended over r.m.s. as it is a better measure for accounting for repeated ‘shocks’ in a vibration time series. Figure 9 shows the vibration dose in terms of r.m.s. and VDV.
Figure 9 Daily vibration dose estimated at the saddle expressed in terms of A(8) (r.m.s.) and VDV(8) for one and two journeys using Bicycle One (bars represent 95% confidence interval)
[image:10.595.77.468.100.253.2] [image:10.595.100.452.633.727.2]and VDV(8) values higher, hence further beyond the respective EAVs. For VDV(8), the ELV of 21 m/s1.75 lies within the 95% confidence interval. Clearly, many commute journeys may be in excess of 22 minutes, and also surface roughness may be greater than for the particular circumstance recorded in this fieldwork. The bicycle has suspension seat post and a gel saddle, and so the question is: what more can be done? The answer almost certainly relates to road surface condition.
It can be clearly seen from Figure 9 that A(8) underestimates the importance of the problem of cycling vibrations. Despite this fact, only A(8) data has been found for comparative purposes. Table 9 compares the results of A(8) to the vibration dose measured for agricultural tractors incorporating whole-body vibration reduction technology, based on data collected over a half day sampling period.
Table 9 Comparison of A(8) (m/s2) of bicycle with agricultural tractor use (Source: Health and Safety Executive, 2005)
Daily exposure range
Machine X (fore and aft) Y (side-to-side) Z (vertical) Agricultural tractor - ploughing 0.3 to 0.6 0.5 to 0.9 0.3 to 0.5 Agricultural tractor - cultivating 0.3 to 0.9 0.5 to 1.4 0.3 to 0.7 Agricultural tractor - spraying 0.3 to 0.5 0.4 to 0.8 0.3 to 0.4 Agricultural tractor - trailer work 0.5 to 1.1 0.4 to 0.9 0.3 to 0.5
Bicycle for 44 minutes 0.6 0.5 0.7
It can be seen that for the particular bicycle journey and for less than an hour of cycling, the subject received a vibration dose comparable to a half day working in a tractor!
[image:11.595.122.511.249.318.2]5 Recommendations for further experimentation
Figure 10 shows that vibration enters the rider/bicycle system independently at the interface of the front wheel and back wheel. It passes into the frame via the axles. Vibration enters the rider’s body at the interface with the bike: the pedals, the handle bars and the saddle. It is important to understand the contribution to whole-body (and also hand/arm) vibration of each entry point, as well as the independence of vibration profile of the two wheels. The current research has not fully accounted for these different entry points, or the independence of the sources.
Figure 10 Interfaces of interest for vibration propagation
Notes
1 Green circles indicate interface between rider and bicycle
2 Red circles and lines indicate entry points for vibration into the rider/bicycle system
[image:11.595.216.422.486.642.2]the amount of vibration to which a cyclist is subjected. By careful disaggregation of sources of vibration and points of entry into the rider, the research should also be able to say something more about the way that vibration may affect different body parts, including not only whole-body and hand/arm vibration, but also impacts on other parts of the musculo-skeletal system and internal organs. Measurement should be taken in the true x, y and z at all interfaces simultaneously. The measurement of vibration at the pedals is likely to remain problematic. The results may also be compared with the discomfort and pain reported by cyclists to confirm the supposed severity of the measurements.
6 Conclusion
The initial idea for the research was motivated by the experience of one author in particular (ESC) when she began commuting with a new bicycle on a new journey and which led to a severe and permanent headache.
A survey of cycle users has shown that discomfort and health issues during and after cycling are not uncommon. A short fieldwork exercise to collect vibration data from a commute journey and from roads with different surface characteristics shows that exposure to vibration while cycling reaches and exceeds workplace Exposure Action Values and may exceed Exposure Limit Values. Collecting field data presents challenges in terms of the repeatability of the measurements and comparability between measurements. Some findings have been determined for vibration exposure relative to speed, surface roughness, frame type, and body position. The repeatability challenges are being further considered in order to identify a protocol for more extensive experimentation.
7 References
BS (1997) BS ISO 2631-1:1997, Mechanical vibration and shock — Evaluation of Human Exposure to Whole-body Vibration, Part 1: General Requirements. British Standards Institution, London.
Chiementin, X., Rigaut, M., Crequr, S., Bolaers, F and Bertucci, W. (2012) Hand-arm vibration in cycling. Journal of vibration and control published online 11 October 2012 DOI: 10.1177/1077546312461024.
European Parliament and European Council (2002). Directive 2002/44/EC on the minimum health and safety requirements regarding the exposure of workers to the risks arising from physical agents (vibration). 6th individual directive within the meaning of Article 16(1) of Directive 89/391/EEC. Official Journal of the European Communities 25/6/2002. Goodman, A. (2013) Walking, cycling and driving to work in the English and Welsh 2011
Census: trends, socio-economic patterning and relevance to travel behaviour in general. PLoS ONE 8(8): e71790. doi:10.1371/journal.pone.0071790
Griffin, M.J. (1994) Handbook of Human Vibration. Academic Press, London.
Health and Safety Executive (2005) Whole-body vibration: The Control of Vibration at Work Regulations 2005 Guidance on Regulations. L141. Health and Safety Executive http://www.hse.gov.uk/pubns/priced/l141.pdf [Accessed 31st May 2013]
Henriksen, B. (undated) Comfort measurements on bike paths. Dynatest® Denmark A/S Hölzela, C., Höchtla, F. and Senner, V. (2012) Cycling comfort on different road surfaces
Procedia engineering 34 pp479 – 484.
Peters, R.J., Smith, B.J. and Owen, S. (1996). Acoustics and Noise Control. 2nd edition. Addison Wesley Longman Limited.
Sainte Cluque, E. and Parkin, J. (2013) Preliminary research of health issues in whole body vibration induced by cycling. Institute of Acoustics Spring conference 13th May