1
Urban Planning for Healthy Cities
WHO Healthy Cities Phase 4 Review
Hugh Barton a Marcus Grant a
a WHO Collaborating Centre for Healthy Urban Environments
University of West England, United Kingdom. Last updated: 2 May 2012
Address for correspondence:
Marcus Grant, WHO Collaborating Centre for Healthy Urban Environments E: marcus.grant@uwe.ac.uk
Institute for Sustainability, Health and Environment
ABSTRACT
2 INTRODUCTION
What is the purpose of town planning? Is it to create a beautiful environment, or a well-functioning settlement, or a fairer society? It is to facilitate economic development? Or it is to ensure long term sustainability, attempting to reduce our ecological footprint? To some extent it is of course all of these things …, but what is the essence of it? The answer given by the Healthy Cities Project (coordinated by the WHO Regional Office for Europe) is that it is about human health, about planning human settlements that offer the best opportunity for people now and in the future to enjoy a good and equitable degree of health; a good quality of life.
This follows logically from the WHO definition of health enshrined in its constitution in 1948, in the period of determined idealism that followed the Second World War:-
“Health is a state of complete physical, mental and social well-being and not merely the absence of disease or infirmity. The enjoyment of the highest attainable standard of health is one of the fundamental rights of every human being, without distinction of race, religion, political belief, economic or social condition”1
3
URBAN PLANNING AS A DETERMINANT OF HEALTH
The effect of place on health is an important strand of both conceptualisation and policy development2. The environment has long been recognized as a key determinant of health3,4,5
Promoting health solely through programmes of changing the behaviour of individuals or small groups is not very effective, reaching only a small proportion of the population and is seldom maintained in the long term6,7. What is needed is more fundamental re-assessment of the way in which social, economic and environmental impacts shape and are shaped by spatial planning and its result: physical development. This calls for a reassessment of the role of the planning and design of human habitation in promoting health.
Evidence shows that spatial planning, or ‘urban planning, in our towns and cities has a profound effect on the risks and challenges to population health8. The broad nature of multiple impacts of human settlement form on health has been described in a settlement health map 9 (Figure 1). This was developed for the WHO-sponsored practice guide Shaping Neighbourhoods, now in its second edition 10. Inspired in part by Whitehead & Dahlgren’s11 figure of the determinants of health12, the diagram
4
Fig 1 The Settlement Health Map
5
In this context, health is a casualty. The decline in regular daily walking and cycling is resulting in increased obesity and risk of diabetes and cardiovascular diseases14. Health inequalities are exacerbated. People tied to locality – elderly people, children, young parents, unemployed people and immobile people – are especially vulnerable. The decline in local facilities, the reduction in pedestrian movement and neighbourly street life all reduce opportunities for the supportive social contacts so vital for mental well-being15.
The WHO Healthy Urban Planning initiative
Phase IV of the WHO European Healthy Cities programme included healthy urban planning (HUP) as one of the main themes which all member cities should develop. This review should be seen in relation to its emergence in previous phases. The baseline for work of linking health and urban planning was established in 1998 through a questionnaire survey. Respondents were the heads of urban planning departments in 38 cities participating in the second phase (1993–1997) of the WHO European Network. Regular cooperation between health and planning occurred in only 25% of cases. Nearly one third of planning heads considered that planning policies were incompatible with health. Several anti-health issues in the planned urban environment were highlighted: excessive levels of motorized traffic; the focus on private profit; social segregation; the lack of attention to the everyday needs of citizens. 16
A comprehensive definition of HUP was developed to address all the health determinants relating to the physical environment of the cities and to reflect the core principles of the WHO strategy for health for all17, such as equity, community
participation and intersectoral cooperation. A set of 12 objectives were adopted for the HUP themeError! Bookmark not defined., consistent with those of sustainable
development and Agenda 2118
• promoting healthy lifestyles (especially regular exercise);
. The 12 HUP objectives, which relate to the sequence of spheres of the health map, were:-
6 • promoting access to good-quality housing; • promoting access to employment opportunities;
• promoting accessibility to good-quality facilities (educational, cultural, leisure, retail and health care);
• encouraging local food production and outlets for healthy food; • promoting safety and a sense of security;
• promoting equity and the development of social capital;
• promoting an attractive environment with acceptable noise levels and good air quality;
• ensuring good water quality and healthy sanitation;
• promoting the conservation and quality of land and mineral resources; • reducing emissions that threaten climate stability.
Subsequently in phase III, HUP was adopted on an experimental basis. Volunteer cities under the leadership of Milan formed a city action group and progressively developed the principles and practice of health-integrated planning with the aid of the WHO Collaborating Centre for Healthy Cities and Urban Policy, based in Bristol’s University of the West of England.19
Levels of health integration in planning
The experience of the cities in Phase III led us to identify three distinct levels of integration of health and planning. These levels provide a simple classification of HUP development, and are used in the later analysis.
7
are rife. Effective health planning, through well-designed settlements, is difficult to achieve, swamped by the sheer pace of urbanisation.
The second level goes beyond environmental health. There is the recognition that many facets of settlement planning and design affect health and well-being: parks in otherwise dense cities give opportunities for physical activity, contact with nature, fresher air and aesthetic delight; allotments support access to fresh food, physical activity and social cohesion; cycle networks, encourage healthy activity, a safer environment, reduced car reliance, equity in access and combat the rise in greenhouse emissions; housing renewal and economic development projects may reduce health inequalities. With such projects the addition of health is an extra dimension and draws in an extra constituency of political support. However, the effectiveness of this approach is fragmented and limited by the broader drivers and structures of economic and spatial development, which often precipitate change in the opposite direction 15. The focus of this level is to tackle the ‘downstream’
outcomes of poorly integrated planning but not to tackle the ‘upstream’ drivers.
8 METHODOLOGY
This article reviews cities in relation to HUP activity as part of a wider evaluation of Phase IV of the WHO European Healthy Cities network. The review is based on the response to the Phase IV General Evaluation Questionnaire (GEQ) and the Annual Reporting Templates (ARTs) for 2008.
There are several limitations to a methodology assessing multi-sectoral activity in countries across Europe though a questionnaire. To increase the validity for this evaluation results have been triangulated by comparing three overlapping sources of information.
The first source is the answers to the direct questions on HUP in the questionnaire. Of the 79 cities in Phase IV, 51 cities responded to the HUP parts of the questionnaire. The questions sought to find out (a) how far the Healthy Cities project in the municipality was effective in relation to specific strategic HUP priorities; and (b), what the Healthy Cities team considered the most important HUP issues. The second source is the responses to broader questions of health equity where HUP is not the prime focus but we might expect it to feature if the city has a well developed awareness of how planning influences health.
The third source is the responses to related questions in the ART returns. These were collected each year during Phase IV, and provide an overview of progress in terms of the quantity and quality of HUP activity as self assessed by the cities. The criteria used to assess progress were:-
• the number and scale of HUP projects or programmes
• the degree to which all 12 HUP objectives are addressed
• the degree to which the HC team is working with varied planning agencies
9
There will be inevitable discrepancies and limitations to reliability. Each set of responses might well be from different people, reflecting different sectoral knowledge and professional bias. The second set in particular might be from someone with little direct knowledge of HUP, focussing on things they understand best. Due to language and cultural differences, it is not always possible to know for sure what respondents mean and assumptions need to be made in interpreting responses. There is also the problem that some responses may reflect wishful thinking not actual achievement. The triangulated approach has, though, allowed us to reduce error, synthesising data from more than one source when summarising a city’s achievements.
The overall assessment thus involves analysis of the responses in relation to the following key themes – set out in the findings below:-
• significance of Healthy Cities for two key planning goals,
• explicit recognition of HUP issues by the Healthy Cities team,
• implicit awareness of the significance of HUP for health,
• progress with HUP throughout Phase IV.
These allow judgements of the number of cities which are at each of the three levels of HUP engagement referred to in the introduction, and some assessment of general progress through Phase IV.
FINDINGS
Significance of Healthy Cities for key planning policy areas
10
answer if the HUP agenda is actively pursued in the city. For the analysis we allocated responses into five classes:-
• Healthy Cities central to the programme /critical /very important
• Healthy Cities a partner in the process /influential /important
• Healthy Cities involved but not key /quite influential
• Healthy Cities supportive of the programme but only peripherally involved
• Healthy Cities does not yet have significant impact /no relevant programme
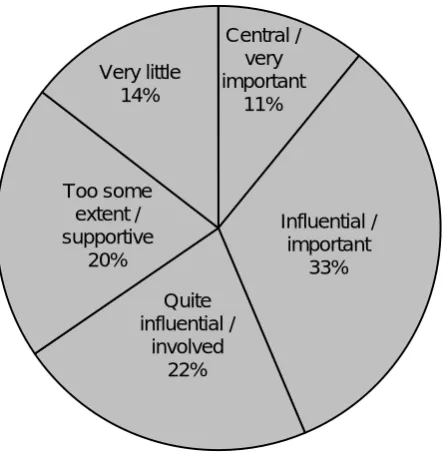
Figure 2.
To what extent has Healthy Cities been influential in advancing strategic HUP priorities to support healthy aging and promote access and mobility for all in the urban environment of
[image:10.595.189.411.373.601.2]your city? (Q6.12)
Figure 2 indicates that almost two thirds (65%) of the respondents consider they are actively involved with planners and are quite/centrally/very influential in shaping such programmes. Others (20%) are aware of policies in these fields and support them, but have little direct involvement. A small minority, 15%, believe that their authority has not yet acted on such concerns.
Central / very important
11%
Influential / important
33%
Quite influential /
involved 22% Too some
extent / supportive
20% Very little
11
Explicit recognition of HUP issues by the Healthy Cities team
[image:11.595.142.505.274.706.2]A second question asked for the three most important HUP issues in your city. In analysing the different answers, they were clustered into 12 topics. Figure 3 indicates in what proportion of the answers a topic was a top priority and also how often it was included in the top three priorities.
Figure 3. What were the three most important HUP issues in your city? (Q6.9)
There were 51 valid responses to this question. The overall planning and urban form topic was highlighted more (22%) than any other topic, though only as a top three
11.9% 18.5% 7.9% 7.9% 4.6% 4.0% 4.6% 11.3% 4.0% 7.3% 4.6% 5.3% 21.6% 11.8% 17.6% 7.8% 5.9% 3.9% 3.9% 13.7% 2.0% 3.9% 3.9% 3.9%
0% 5% 10% 15% 20% 25%
Overall planning & urban form Transport ad accessibility Greenspace, recreation & physical activity Regeneration & neighbourhood plan Training, professional development Housing Infrastructure, water, waste Urban design & environment quality / improvement Co-ordination & politics Misc topics Growth pressures Social issues & community involvement
% of respondents
Identified as issue 1
12
priority in 12% of responses. The greenspace /recreation/physical activity topic accounted for almost 18% of priorities but only 7% included it within the top three. Transport and accessibility accounts for 12% priority and was the most often included in the top three (19%). Urban design and environmental quality/improvement are also given good recognition by cities with over 13% reporting it as a top issue and over 11% of cities putting the issue within the top three.
Issues not ranked so highly included community/social issues, housing, co-ordination/politics, infrastructure, growth pressure and training. A few cities, between 2% and 5%, considered one of these was important.
Implicit awareness of the significance of HUP for health
Another way of assessing the degree to which Healthy City teams are fully aware of the significance of planning for health is to see how far they identify planning policies when discussing a key health issue. Two questions provided an opportunity for this.
Cities were asked whether there were specific policies and programmes that address equity and health inequalities (Q4.4). Despite often giving quite full answers, very few of the Healthy City teams identified any planning-related policies in their response. Yet policies for urban form, transport, housing, regeneration etc. can have a significant impact on equity.
13 Progress with HUP throughout phase IV
Progress of HUP through the duration of Phase IV can be tracked through review of data provided each year in the annual city returns as provided by the Annual Reporting Templates (ARTS). All cities have to provide a detailed return about their activity across the whole programme including the HUP core theme. These replies were looked at in detail and assessments made of the level of activity (i.e. quantity) and the nature of that activity (i.e. quality).
[image:13.595.97.462.521.692.2]Each year the degree of cities’ HUP activity was assessed on a range from very poor to high.’ Very poor’ may mean no reported activity or a single meeting or plan for a small project. A ‘poor’ degree of activity indicates implementation of one small project. The cities scoring ‘fair’ are involved both in meetings/ training and a significant level of project implementation. Cities achieving a high degree of activity all have vibrant HUP programmes: typically an active programme of training and stakeholder meetings and a major project programme, sometimes including fully health-integrated plan-making.
Figure 4 Degree (level) of Healthy Urban Planning activity
11 15
21 26
0 10 20 30 40 50 60 70
2005 18cities
2006 32cities
2007 63cities
2008 55cities Number
of cities
Verypoor
Poor
Fair
High
14
joined in 2006 and 2007. This led to a sharp increase in cities scoring poor and very poor, especially in 2007. In the final year of the phase, 2008, there is a reduction in the number of cities in both these categories. This is mainly due to these new entrants familiarising themselves with HUP and beginning to make better progress.
The quality and range of HUP activity from each city was also assessed from information in the annual city reports. Quality was assessed by the degree to which city HUP activity:-
• addressed the twelve HUP objectives,
• demonstrated integration with Healthy Impact Assessment and Healthy Ageing (two other phase IV themes),
• displayed a range of activity at different spatial scales,
• evidenced both an integrated strategic approach and implementation at the local level,
• involved a good range of relevant planning agencies and community stakeholders.
15
[image:15.595.113.443.132.305.2]Figure 5. Quality of Healthy Urban Planning activity
Figure 5 shows that the quality and range of HUP activity at the high end increased year on year, from 11 cities in 2005 to 29 in 2008. When those 29 are looked at in detail two thirds of them (19) were graded as having very good quality, up from 11 the year before. These are the cities where HUP activity is at level 3, in the previously described three level model.
As with the degree of activity, described above, we see a pattern in 2006 and 2007 of many new cities joining the network and having a fair, poor or very poor quality of activity. All of these categories are reduced in the final year, with a marked increase in high quality.
DISCUSSION
Taken as a whole, results from the General Evaluation Questionnaire give some contradictory messages. Direct questions about HUP often elicit very positive responses. Indirect questions indicate that while some respondents have a formidable grasp of the health and planning interplay, many others do not. Checking the results against a second good source of data, the ARTS, had the advantage of providing a different perspective and providing a time series over Phase IV.
11 15
20
29
0 10 20 30 40 50 60 70
2005 18 cities
2006 32 cities
2007 63 cities
2008 55 cities Number
of cities
Very poor
Poor
Fair
16
There is an encouraging picture of the degree to which each Healthy City team is actively involved in planning policy making. Certainly a level of engagement between planning and health agencies is indicated that did not exist when the first survey was undertaken in 1998.
In terms of the range of HUP, there are examples both of cities concentrating on specific projects and of others with more broad ranging programmes. One of the real problems in developing the HUP programme has been an approach seen in many cities which emphasises action as a series of specific projects such as park improvements, allotment provision, safe road crossings, cycle lanes (i.e. level 2 as defined at the start of this paper). However, all the research suggests that without a strategic (level 3) approach to HUP, the value of individual projects will be limited88.
There is evidence of a high degree of explicit recognition of HUP issues by the Healthy Cities’ teams. It is interesting to note that the environmental health concerns related to water, air and waste – i.e. level 1 of the three HUP levels – are highlighted by only a small number of municipalities. This indicates the degree to which – except in a few mainly eastern countries – basic life-support is not critical. Transport, urban form, urban design and environmental quality issues are given the greatest weight by many. The interest in environmental quality runs in parallel with the emphasis on specific improvement projects (level 2). The degree of significance given to overall planning and urban form was unexpected. Contrary to experience in earlier years, this suggests that now a significant proportion of cities are aware of, and concerned about, strategic planning. However, in many instances strategic awareness is not yet reflected in strategic (level 3) action. The importance given by some cities to the need for training, professional development, inter-departmental co-operation and political awareness reinforces the message that organizational development is necessary to tackle HUP effectively.
17
environment/health relationship. However, there are clear signs of deepening understanding. The quarter of cities that fully recognised the planning /equality relationship were often very strong in their statements – not equivocal at all. The policy areas identified differed somewhat from those given in answer to other questions: employment /economic policies (affecting income and status) and housing policies (affecting affordability, overcrowding, poor living conditions, and fuel poverty) are prominent; transport /accessibility, environmental quality, strategic planning and regeneration policies all also feature significantly.
Two thirds of cities consider that the Healthy Cities programme has been influential in shaping planning policy in the interests of a healthy urban environment. Overall a quarter of cities are already working effectively at level 3. Most of the rest are at level 2. In the main, cities are very comfortable with activity at this level. The challenge is to use the HUP approach to work across disciplinary and professional boundaries as a core spatial planning value, to achieve level 3.
It is also clear that some cities are still at level 1 – i.e. concerned with basic environmental health. This reflects the number of new entrants to the network, in particular the Eastern European cities. At the end of Phase IV, those that had engaged with the programme were already attempting the second level – working on discreet projects that enhance quality of life.
18 CONCLUSIONS
This evaluation indicates that the level of understanding of the significance of planning for health by the Healthy Cities movement has developed significantly over the period of phase IV, but still has some way to go. A broad conclusion is that the Healthy Cities programme can be effective in promoting the critical importance of linking health and planning, and in disseminating and developing good practice. In many cities it has helped to transform the political and professional agenda, integrating health with sustainable development and the planning of the human environment. However, many cities are still struggling with the more strategic and holistic approach of level 3. Two common factors seem to be that they are hampered by internal institutional barriers and by an evolving spatial form which is driven by ‘what the market can deliver’. Such barriers militate against any form of integrated working; it is not just HUP that will be disadvantaged. Any city, as a large complex organisation, will suffer from this to an extent and we can see that the successful cities are those that engage a broad range of stakeholders and form wide ranging partnerships providing a continual bulwark against sectoral silos.
Level 3 brings with it a heavy responsibility: many current policy assumptions, widespread across Europe, like business parks and retail parks, need careful and honest review. The integration of health and planning therefore requires in most cities a fundamental change in organizational structures and remits This type of change can be supported by a programme which promotes knowledge exchange and a reflective discourse on values between public health professionals and planners 20. In democratic societies it depends on strong consensus
19 REFERENCES
1 Constitution of the World Health Organization, 14 U.N.T.S No. 185 (1948), Art. 1. Available at
http://www.who.int/governance/eb/who_constitution_en.pdf.
2 Macintyre, S., Ellaway, A. and Cummins, S., (2002) Place effects on health: how to conceptualise,
operationalise and measure them? Social science and Medicine, 55, 125-139
3 Lalonde M. A new perspective on the health of Canadians. (1974) Ottawa, Healthy and Welfare
Canada.
4 Whitehead M, Dahlgren G. What can we do about inequalities in health? Lancet, (1991), 338:1059–
1063
5 Marmot M, Wilkinson R, eds. (1999) Social determinants of health. Oxford, Oxford University Press.
6 Lawlor D et al. (2003) The challenges of evaluating environmental interventions to increase
population levels of physical activity: the case of the UK National Cycle Network. Journal of
Epidemiology and Community Health, 57:96–101
7 McCarthy M. Transport and health. In: Marmot M, Wilkinson, R, eds. (1999) Social determinants of
health. Oxford, Oxford University Press.
8 Braubach, M and Grant, M. (2010) Evidence Review on the Spatial Determinants of Health in Urban
Settings IN Urban planning, environment and health, From evidence to policy action, Annexe 2
p22-97, Copenhagen: WHO Regional Office for Europe.
9 Barton, Hugh and Grant, Marcus (2006) A health map for the local human habitat. The Journal for
the Royal Society for the Promotion of Health, 126 (6). pp. 252-253.
10
Barton H, Grant M and Guise R, (2010) Shaping Neighbourhoods for local health and global
sustainability London, Routledge.
11 Whitehead M, Dahlgren G. (1991) What can we do about inequalities in health? Lancet, 338:1059–
1063.
12
Dahlgren G, Whitehead M. version published. In: Whitehead M. Tackling inequalities: A
review of policy initiatives, in Benzeval M, Judge K, and Whitehead M eds. Tackling
inequalities in health: An agenda for action. London: Kings Fund; 1991; 1995.
13
Rao, Prasad, Adshead and Tissera, (2007) The built environment and health, The Lancet, Published
Online, September 13, DOI:10.1016/S0140-6736(07)61260-4
14 Franklin T et al. (2003) Walkable streets. New Urban Futures, 10 July:5–7.
15 Barton, H. (2009) Land use planning and health and well-being, Land Use Policy, Volume 26,
Supplement 1 - Land Use Futures, S115-S123
16
Barton H, Tsourou C. (2000) Healthy urban planning – a WHO guide to planning for people.
London, E&FN Spon.
17H
EALTH21 – the health for all policy framework for the WHO European Region. (1999)Copenhagen, WHO Regional Office for Europe,
(http://www.who.dk/InformationSources/-Publications/Catalogue/20020322_1, accessed 17 September 2003).
18 UN (1993), Agenda 21: Earth Summit - The United Nations Programme of Action from Rio, New
York, United Nations Publications.
19
Barton, H., Mitcham, C., and Tsourou, C. (eds) (2003) Healthy Urban Planning in Practice:
Experience of European Cities. Report of the WHO City Action Group on Healthy Urban Planning.
WHO Regional Office for Europe. Copenhagen.
20 Pilkington, P., Grant, M. and Orme, J. (2008) Promoting integration of the health and built