Evaluation of Electrode and Solution Area-Based Resistances
Enables Quantitative Comparisons of Factors Impacting Microbial
Fuel Cell Performance
Ruggero Rossi,
†Benjamin P. Cario,
†Carlo Santoro,
‡Wulin Yang,
†Pascal E. Saikaly,
§and Bruce E. Logan
*
,††Department of Civil and Environmental Engineering, The Pennsylvania State University, 231Q Sackett Building, University Park,
Pennsylvania 16802, United States
‡Department of Chemical and Biological Engineering, Center for Micro-Engineered Materials (CMEM), University of New Mexico,
Advanced Materials Lab, 1001 University Boulevard Southeast, Suite 103, MSC 04 2790, Albuquerque, New Mexico 87131, United States
§Biological and Environmental Sciences and Engineering Division, Water Desalination and Reuse Research Center, King Abdullah
University of Science and Technology, Thuwal 23955-6900, Saudi Arabia
*
S Supporting InformationABSTRACT: Direct comparisons of microbial fuel cells based on maximum power densities are hindered by different reactor and electrode sizes, solution conductivities, and materials. We propose an alternative method here, the electrode potential slope (EPS) analysis, to enable quantitative comparisons based on anode and cathode area-based resistances and operating potentials. Using EPS analysis, the brush anode resistance (RAn= 10.6±0.5 mΩm2) was shown to be 28% lower than
the resistance of a 70% porosity diffusion layer (70% DL) cathode (RCat= 14.8±0.9 mΩm2) and 24% lower than the solution resistance (RΩ= 14 mΩm2) (acetate in a
50 mM phosphate buffer solution). Using a less porous cathode (30% DL) did not
impact the cathode resistance but did reduce the cathode performance due to a lower operating potential. With low-conductivity domestic wastewater (RΩ= 87 mΩm2), both electrodes had higher resistances [R
An= 75±9 mΩm2, andRCat=
54 ±7 mΩ m2(70% DL)]. Our analysis of the literature using EPS analysis shows how electrode resistances can easily be quantified to compare system performance when the electrode distances are changed or the sizes of the electrodes are different.
■
INTRODUCTIONMicrobial fuel cells (MFCs) use bacteria on the anode to produce an electrical current from the degradation of organic matter and a catalyst on the cathode for the oxygen reduction reaction (ORR).1−4Many different anode materials have been examined, including graphite fiber brushes, carbon veils, carbon cloth, carbon paper, and carbon felt, and these materials have often been modified to increase power production.5−8 The materials and catalysts used for the cathode have also varied, with the most common types consisting of Pt catalysts on carbon cloth or activated carbon as both the supporting material and catalyst.9,10 Typically, improved performance caused by electrode modification is demonstrated on the basis of an increase in maximum power production using polarization data.11,12However, when a new anode or cathode material is shown to improve performance in one type of MFC, it is not clear how much that specific change improved performance relative to other differences in reactor design, construction, or operational procedures. For example, the power production can be a function of the size (e.g., projected area) of the electrode, as the power per area can vary inversely with electrode size.13−15Power is also affected by the relative sizes of the two electrodes (e.g., an anode larger than
the cathode).16 Comparisons of performance are particularly difficult for systems that have different distances between the electrodes, as ohmic resistance can greatly limit overall performance in low-conductivity solutions, such as domestic wastewater.17Even when all materials and solutions are kept constant, maximum power densities obtained in the same laboratory can vary by∼15%.9
To better engineer large-scale MFCs, it is necessary to know what specific factors limit performance and how the behavior of the electrodes will change as they become larger or distances change between them.18 As the system scale is increased, the performance of one electrode, for example, the cathode, could change at a rate with size that is different from that of the anode. As a result, reporting the change in maximum power density alone does not provide insight into which electrode might be limiting performance or the extent to which electrode performance changes with reactor size. It is possible to examine abiotic electrode performance using electrochemical
Received: October 24, 2018 Revised: February 21, 2019 Accepted: February 27, 2019 Published: February 27, 2019
Article
pubs.acs.org/est Cite This:Environ. Sci. Technol.2019, 53, 3977−3986
copying and redistribution of the article or any adaptations for non-commercial purposes.
techniques such as potentiodynamic [linear sweep voltamme-try (LSV)] or potentiostatic methods (chronoamperomevoltamme-try at defined potentials).19−22 However, these electrochemical techniques cannot be conducted on the anode before it is fully acclimated in an MFC. Also, evaluating anode perform-ance is more difficult than that of an abiotic cathode as its performance can change over time as a function of its operating conditions (e.g., potential, external resistance, and temperature).23−25Thus, anode performance can be assessed only during actual MFC operation using polarization data and reference electrodes. However, the ohmic drop between the reference and working electrodes must be included in thefinal polarization data to properly evaluate electrode performance as a function of current.17,26Inaccurate electrode potentials can lead to wrong conclusions about the extent that the anode or cathode could be limiting power production.17
A new and more comprehensive analysis was used here to provide quantitative comparisons of electrodes in different types of MFCs. The slopes of electrode polarization data near peak power, based on the linear region, were used to quantify electrode area-based resistances (milliohms square meter), and they-intercepts of the data were used to calculate effective half-cell potentials. While these factors have been included to some degree in previous studies,16,27,28our electrode potential slope (EPS) analysis is unique in terms of the comprehensive nature of the analysis and full use of linearized electrode potential data. In the conventional fuel cell literature, most polarization data have three regions: an initial rapid change in potential at low current densities where the activation losses prevail over the other resistances, a linear region dominated by the ohmic resistances, and a steep decrease in voltage at high current due to mass transfer limitations.29−32 In MFCs, polarization data are usually linear over a wide range of relevant current densities (especially near the peak power).16Anode potentials are linear until very high current densities are reached, where current production can suddenly fail to increase for a variety of reasons (e.g., substrate-limited mass transport, insufficient acclimation, or limiting current densities), causing the power curve to exhibit power overshoot (a doubling back of the power curve).33,34 Cathode potentials typically have an initial rapid drop due to the activation losses of the ORR at low current densities. After this initial drop, the cathode potential tends to be linear at higher current densities (and near peak power production). The slopes of the polarization curve for the whole cell, or for individual electrodes, can therefore be used to obtain area-normalized resistances, with they-intercepts of the potentials providing a useful estimate of the actual working open circuit voltages (OCVs).35The utility of the EPS analysis method was demonstrated here in experiments using MFCs with brush anodes and cathodes with diffusion layers (DLs) that had two different porosities (70% and 30%), in tests with an acetate-buffered medium and with domestic wastewater. Additionally, this approach was shown to be broadly applicable by evaluating data from previous studies and making quantitative comparisons between electrodes of different sizes or materials. These comparisons demonstrate that it was possible to easily quantify how the specific changes in electrodes or materials affect power production for different types of MFCs.
■
MATERIALS AND METHODSCalculations.The overall cell potential (Ecell) with a load on the circuit is usually expressed as a function of the
electromotive force (Eemf) calculated from the anode and cathode half-cell potentials (EAn and ECat, respectively) and
resistances (R) in the circuit as17
(
)
Ecell = Eemf −
∑
ηAn+∑
ηCat +R iΩ (1) where ηAn is the anode overpotential, ηCat the cathodeoverpotential, RΩ the ohmic resistance, and i the current. Although not explicitly shown in these equations, the electrode overpotentials are a function of the current, and thus, they decrease the voltage due to activation losses, pH changes, bacterial metabolic losses, and concentration losses (mass transfer limitations to or from the electrodes). To account for different sizes of electrodes, the current density (amperes per square meter) is used on the basis of the electrode projected area, and therefore, the resistance must also have units of area (milliohms square meter) for a given voltage (millivolts).28
The theoretical Eemf can be calculated from the half-cell
reactions, chemical activities, and operational conditions.
Equation 1can be written in terms of the half-cell potentials for the anode (EAn) and cathode (ECat) as
(
)
Ecell = ECat −EAn−
∑
ηAn+∑
ηCat +R iΩ (2) The typical electrochemical reactions of an MFC are acetate oxidation at pH 7 at the anode1and oxygen reduction at the cathode. Assuming acetate oxidation produces bicarbonate and assuming the ORR occurs with a four-electron transfer that proceeds through either proton uptake or water dissolu-tion,36,37possible reactions and half-cell potentials (25°C and pH 7) are1E
2HCO 8e 9H CH COO 4H O
296 mV
3 3 2
An
F
+ + +
= −
− − + −
(3)
E
O2+4e−+2H O2 F4OH− Cat =815 mV (4a) E
O2+4e−+4H+F 2H O2 Cat =815 mV (4b) where the half-cell potentials are given versus a standard hydrogen electrode (SHE). This results in theoretical Eemf
values of 1111 mV. However, for activated carbon (AC) electrodes, oxygen reduction can also proceed through a two-electron transfer mechanism
E
O2+2e−+2H+F H O2 2 Cat =281 mV (5) E
O2+2e−+2H O2 FH O2 2+2OH− Cat =267 mV
(6)
E
O2+2e−+H O2 FHO2−+ OH− Cat =337 mV
(7) resulting in a range of electrons transferred around 2.1− 3.6.11,38,39 Thus, the measured Eemf (Eemf,m) for the cell, for example, under open circuit conditions (Eemf,m0), does not have
a single predictable value due to the multiple ORRs.
potentialsfit to the linear portion of the measured anode and cathode potentials, producing operational potentials that better describe the working electrode potentials in terms of experimental electrode potential conditions, for the anode (EAn,e0) and cathode (ECat,e0) potentials. Because all changes in electrode and solution potentials are now a linear function of the current,eq 2can now be written as
Ecell = ECat,e0−EAn,e0−i R( Cat +RAn+RΩ) (8)
where the electrode overpotentials that impact the measured cell voltage are quantified in terms of individual resistances of the anode (RAn), cathode (RCat), and electrolyte (RΩ). If a
membrane or separator is used, resistances for these materials would be included in a measuredRΩ, or they would need to be separately determined from the electrolyte resistance. The sum of these three resistances in eq 8 is the total operational internal resistance (Rint).
To evaluate the performance of an MFC, the load on the circuit is typically varied by using an external resistance, and the operational current is calculated from the cell voltage. Thus, we can replaceEcell with the external resistance in the circuit (Rext) as a function of the current, as
iRext= ECat,e0−EAn,e0−i R( Cat +RAn+RΩ) (9)
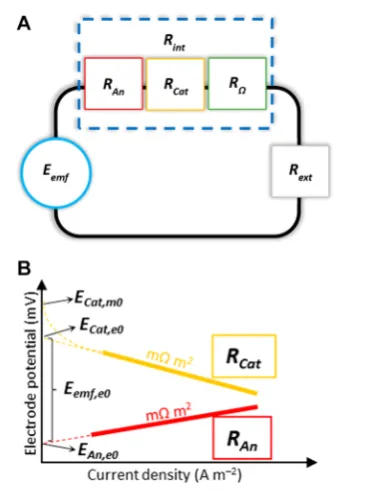
On the basis ofeq 9, a circuit can be drawn that describes the steady performance of the cell (i.e., neglecting sudden changes in the load on the circuit) (Figure 1A). For this EPS analysis of the electrode open circuit potentials and resistances, the electrode potentials were obtained from the polarization test by changing the external resistance in the circuit. The
electrode potentials are then plotted with the potential on the y-axis and the current density on thex-axis. The linear portion of the data is expressed asE=mi+b, where the slopemis the specific resistance of each electrode (RCat or RAn) in units of
milliohms square meters and the y-intercepts are used to calculate the experimental open circuit potentials of the anode (EAn,e0) or cathode (ECat,e0) (Figure 1B). The solution resistance, RΩ (milliohms square meters), can be obtained from the solution conductivity (σ, millisiemens per centi-meter), and the distance between the electrodes (l, centimeters), as
R 100l σ =
Ω (10)
where 100 is used for unit conversion (conversion of millisiemens into siemens, where 1 S = 1 Ω−1, and square centimeters to square meters). For example, for 50 mM PBS (σ = 6.9 mS cm−1) and an electrode spacing ofl= 1 cm,RΩ= 14 mΩ m2. If a membrane or separator is used, electrochemical impedance spectroscopy (EIS) can be used to obtain the membrane resistance from the combined solution and membrane resistance.40
The EPS analysis described above, based on using the slopes andy-intercepts of the polarization data to measure electrode resistances and calculate working half-cell potentials, is different from previous approaches that used area-based electrode resistances. For example, Fan et al. did not directly measure each electrode resistance and instead used only whole cell polarization data.16 This method resulted in errors in calculated electrode resistances, as they were assumed to be constant with changes in conductivity. Sleutels et al. calculated electrode resistances for MECs using a single condition (i.e., one point for each resistance calculated) rather than using many points (i.e., the linearized portion of the polarization data), which reduced accuracy, and theoretical half-cell potentials rather than those obtained from the y-intercept as done here.28 Liang et al. calculated resistances using a slope analysis of the polarization data but also did not use y -intercepts to calculate the experimental electrode potentials, nor did they consistently correct electrode polarization data for ohmic losses or calculate solution resistances from solution conductivities.27 Instead, the current interrupt method was used to estimate ohmic losses.
Construction and Operation of MFCs.MFCs contained 28 mL (empty volume) cylindrical chambers cut into polycarbonate blocks, with a chamber 3 cm in diameter and 4 cm in length.9The anodes were 2.5 cm diameter and 2.5 cm long carbon brushes, which were made by twisting conductive carbon fibers between two titanium wires.5 All brushes were heat treated at 450°C for 30 min in a muffle furnace prior to use.41Anodes were acclimated in MFCs for more than 2 years at a fixed external resistance of 1000 Ω, at a constant temperature (30 °C) prior to use here with new cathodes. Cathodes (7 cm2exposed surface) were made from activated
carbon (AC) and stainless steel mesh, with a cathode-specific surface area per volume of reactor of 25 m2m−3.2
AC cathodes were manufactured by VITO (Mol, Belgium) and had diffusion layers (DLs) with different porosities of 70% or 30% for the study of two different types of cathodes.42 Anode- and cathode-specific resistances were normalized by the cathode projected area (7 cm2).
[image:3.625.93.278.415.662.2]Brush anodes were placed near the cathode (electrode spacing dAn‑Cat of 1 cm in phosphate buffer and 1.3 cm in Figure 1.(A) Microbial fuel cell circuit diagram with anode, cathode,
and ohmic resistances as part of the total internal resistance of the cell. The membrane resistance was not included in the figure as no membrane is currently used in single-chamber MFCs. (B) Schematic representation of the parameters used for the EPS analysis. The dashed lines represent the linearization that would be obtained from polarization tests, while the thick solid lines show the linearized portion of the polarization data that are used to calculate the anode (RAn) and cathode (RCat) resistances.
wastewater tests) with the brush perpendicular to the cathode and the reference electrode (RE) tip touching the titanium wire. The larger spacing used in the wastewater tests was set to match that of a larger-scale MFC, where this distance was chosen to minimize possible clogging with domestic waste-waters.7 The REs used to measure electrode potentials [Ag/ AgCl; model RE-5B, BASi; 0.209 V vs a standard hydrogen electrode (SHE)] were placed in the current path between the electrodes. The RE was 0.5 cm in diameter, with a tip diameter of 0.4 cm. Distances between electrodes are considered to be accurate to within 0.2 cm. All potentials are reported here versus SHE.
Tests were conducted using a medium containing a 50 mM phosphate buffer solution (PBS; 4.58 g of Na2HPO4, 2.45 g of NaH2PO4, 0.31 g of NH4Cl, and 0.13 g of KCl in 1 L of
distilled water, with 12.5 mL of a concentrated trace mineral solution and 5 mL of a vitamin solution) amended with sodium acetate (1 g/L) having a conductivity of 6.93 mS cm−1, or domestic wastewater (WW).43 Wastewater was collected weekly from the primary clarifier of the Pennsylvania State University Waste Water Treatment Plant and stored at 4 °C prior to use. The solution conductivity of the wastewater was 1.51 mS cm−1at 25°C. The MFCs were operated at 30°C in a controlled temperature room.
Electrochemical Measurements.MFCs were acclimated as previously described,44 based on feeding the reactor with medium in fed-batch operation over several weeks, until at least three reproducible and stable voltage profiles were obtained. Single-cycle polarization tests were conducted by feeding the reactor with fresh medium, maintaining the system under open circuit conditions for 2 h, and then steadily reducing the external resistance from 1000, 500, 200, 100, 75, 50 to 25 Ω at 20 min intervals. Polarization tests were
completed before there was an appreciable change in the pH or substrate concentrations that could impact performance.
The current was calculated on the basis of the potential (Ecell) measured across the external resistor and recorded using
a computer-based data acquisition system (2700, Keithley Instrument). Current densities (i) and power densities (P) were normalized to the total exposed cathode area (A= 7 cm2)
and calculated using the equationsi = Ecell/RextAandP = iEcell,
respectively, whereRextis the external resistance.44
During each polarization test, the electrode potentials were recorded using a reference electrode. The RE was used to measure the anode potential (EAn); the cathode potential
(ECat) was then calculated from the anode potential and the whole cell voltage using the equationECat = Ecell+ EAn. The
electrode potential was then corrected on the basis of the conductivity of the solution (∼1.5 mS cm−1for the wastewater and 6.9 mS cm−1 for the PBS) and the distance from each electrode to the RE by rearrangingeq 10and dividing RΩ by the projected area of the electrode.17The measured electrode potentials (not corrected for the solution conductivity) are reported in theSupporting Information.
■
RESULTS AND DISCUSSIONExperimental Whole Cell Polarization Curves in PBS and Wastewater. The measured total cell open circuit potential (Eemf,m0) was 664±11 mV for the 70% DL cathode MFCs fed acetate in PBS, similar to that for the 30% DL (669 ±4 mV) (Figure 2A,B). These values were both∼40% lower than the theoreticalEemfof 1111 mV, assuming a four-electron
transfer at pH 7.36The experimental potential of the 70% DL cathode MFC (Eemf,e0) was 531 ± 5 mV, based on the y
[image:4.625.150.479.65.337.2]-intercept of the cell polarization data (current density range of 3−9 A m−2). When using the less porous 30% DL, the
Figure 2.Modeled polarization and power density curves based on a single internal resistance calculated by the slope of theI−Ecellcurve and several external resistances compared to the data from polarization test in (A and B) PBS and (C and D) wastewater using cathodes with diffusion layer porosities of (A and C) 70% and (B and D) 30%. The dashed lines represent the linearization of the data that would be obtained from polarization tests.
experimental potential was reduced to an Eemf,e0of 467 ±22 mV, suggesting that the less porous DL reduced the maximum working potential of the MFC.
The maximum measured power density was 1.71±0.08 W m−2for the 70% DL and 1.38±0.04 W m−2for the 30% DL, consistent with previous reports on improved performance with a more porous DL.42 The internal resistances obtained from the linearized polarization data for these MFCs with the two different cathodes, however, were quite similar: 41 ± 1 mΩ m2(70% porosity) and 39± 4 mΩm2(30% DL). The similar area-specific resistances suggest that the lower power density with the cathode with 30% DL was due to a decrease in theEemf,e0of >60 mV compared to that of the 70% DL and not to differences in electrode resistances. However, this requires measurement of electrode potentials, as shown below. Using the circuit shown inFigure 1and the experimental potentials and total specific resistances (obtained from the lines), the calculated maximum power densities were 1.71 W m−2(70% porosity) and 1.40 W m−2 (30% porosity), showing good agreement with the experimental results (Figure 2).
The measured open circuit whole cell potentials in wastewater of the MFCs with the two different cathodes (Eemf,m0) were 617±2 mV (70% DL) and 632±2 mV (30%
DL) (Figure 2C,D). These potentials were slightly lower than those measured using acetate in PBS, likely reflecting the less thermodynamically favorable oxidation of wastewater organics compared to that of acetate alone. The experimental Eemf,e0 values were the same for the MFCs with the different cathodes (574±22 mV with 70% DL and 574±16 mV with 30% DL). The internal resistance of the MFCs based on the slopes of the polarization data with wastewater was 223±16 mΩm2for
the 70% DL, which was only 11% lower than that of the MFCs with the 30% DL (249±12 mΩm2). As a result of the similar experimental potentials and internal resistances, the maximum power densities were also quite similar to 0.34±0.01 W m−2 (70% DL) and 0.31 ± 0.01 W m−2 (30% DL). The ohmic resistance of the wastewater (87 mΩ m2) was much higher than that of PBS (14 mΩm2). The impact of this large ohmic
resistance of the wastewater, coupled with the low current density, likely reduced the impact of the different DL porosities on power production. The maximum power densities calculated from theEemf,e0 and the internal resistance in each
configuration resulted in similar maximum power densities of 0.37 W m−2(70% porosity) and 0.33 W m−2(30% porosity), which were in good agreement with polarization data.
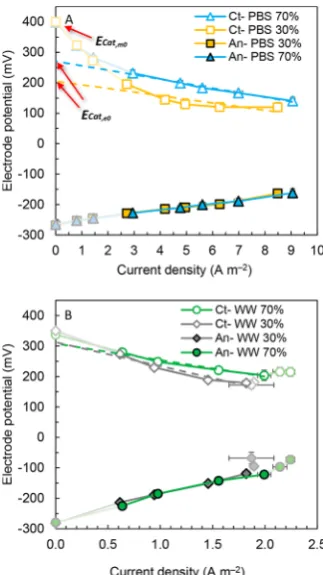
Electrode Potentials and Specific Resistances. The measured cathode potentials under open circuit conditions using acetate and PBS (ECat,m0) were 399± 11 mV (70% DL cathode) and 401 ± 2 mV (30% DL cathode), which were around 400 mV lower than the theoretical value at pH 7 (for example 815 mV using eq 4b). The experimental cathode potential with the 70% DL cathode (ECat,e0= 271±6 mV) was 32% higher than that of the 30% DL cathode (ECat,e0= 205±
27 mV) (Figure 3A), while the area-specific resistances of the two different cathodes were quite similar (14.8±0.9 mΩm2,
70% DL; 12 ± 5 mΩ m2, 30% DL cathode). The anode potentials did not change when using the different cathodes (EAn,e0=−260±3 mV, 70% DL;EAn,e0=−262±7 mV, 30%
DL), nor did the anode area resistances (10.6±0.5 mΩ m2, 70% DL; 11 ± 1 mΩ m2, 30% DL). This conclusively
demonstrated that the differences in power production using the two different cathodes were specifically due to the cathode and not to any changes in the anode potentials (for example
due to greater oxygen transfer through the higher-porosity cathode). The slightly higher resistances for the cathodes than the anodes suggest that the cathode limited power production only slightly more than the anodes.
Using the EPS analysis, the power density curve was accurately reproduced, allowing clear identification of both the individual resistances and the working potentials. The sum of the singular resistances (RAn,RCat, andRΩ= 14 mΩm2) from
the electrode slopes and solution conductivity was 39.4 mΩ m2, which was within 4% of that calculated from the slope of the whole cell polarization curve (41 ± 1 mΩ m2, 70% DL
cathode). With the 30% DL cathode, a value of 37 mΩm2was calculated from the sum of the individual resistances compared to 39±4 mΩm2using the whole cell polarization curve. The use ofECat,e0based on experimental polarization data has the advantage of using most of the polarization data to obtain the working potentials rather than just a single point as done by Sleutels et al.28In studies by others, theoretical or measured open circuit cathode potentials were used,16,27 which would have resulted in potentials that did not accurately predict MFC performance.
Using wastewater, the measured cathode potentials (ECat,m0)
of 337±1 mV (70% DL cathode) and 350±2 mV (30% DL cathode) were slightly higher than those obtained from the slope analysis (ECat,e0) of 308±10 mV (70% DL) and 313± 18 mV (30% DL). The measuredECat,m0and the experimental
[image:5.625.362.524.66.354.2]ECat,e0 cathode potentials were quite similar to each other in wastewater tests, compared to PBS whereECat,e0differed from Figure 3. Anode (An) and cathode (Ct) potentials following correction for ohmic resistance in (A) PBS and (B) wastewater using cathodes with 70% or 30% DL porosities. Anode and cathode potentials not corrected for ohmic losses are reported inFigure S1. The dashed lines represent the linearization of the data that would be obtained from polarization tests, while the thick solid lines show the linearized portion of the slopes that are used to calculate the anode (RAn) and cathode (RCat) resistances.
ECat,m0as much as 50% (cathodes with 30% DL). The narrower differences between the experimental and measured ECat for
the wastewater samples could have been due to the low current densities, as this results in operation of the MFC in a region of current that includes activation losses in the final RCat and
ECat,e0 (see the Supporting Information and Figure S2). The measured anode potentials in wastewater (EAn,m0) were both
−280 ±3 mV, with more positive anode potentials from the slope analysis (EAn,e0) of−266±13 mV (70% DL) and−262
±3 mV (30% DL). These anode potentials were quite similar to the operational potentials obtained using PBS.
The cathode-specific resistances RCat in wastewater were both substantially higher than in PBS, 54± 7 mΩ m2 (70%
DL) and 78±14 mΩm2(30% DL). These cathode-specific resistances were 4−7-fold higher in wastewater than those obtained in PBS. The anode-specific resistances were also greatly increased, with similar resistances obtained of 75± 9 mΩm2(70% DL) and 78±2 mΩm2(30% DL). Thus, a
6-fold increase in the solution-specific resistance of the wastewater (RΩ = 87 mΩ m2) compared to that of PBS (R
Ω
= 14 mΩ m2) led to 4−7-fold higher cathode resistances and 7-fold higher anode resistances, although it did not greatly impact the measured electrode open circuit potentials. The anode and cathode resistances with 30% or 70% DL cathodes were both lower than the solution-specific resistance in wastewater, suggesting a large impact of the solution conductivity on the MFC performance. This was different from the case with PBS and acetate in which the cathodes primary limited power production. The sums of the individual area-based resistances were 216 mΩ m2(70% DL) and 243 mΩm2(30% DL), both in good agreement (∼4% lower) with
the whole cell area-specific resistances calculated from the slopes of the whole cell polarization curves (223±16 mΩm2 for the 70% DL and 249±12 mΩm2for the 30% DL).
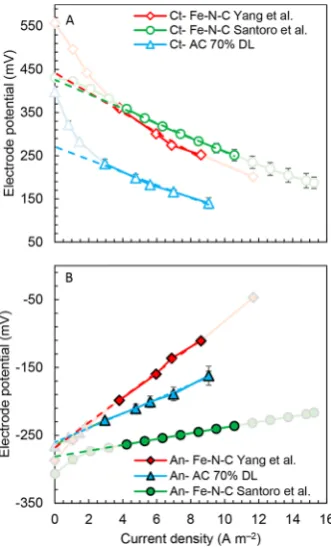
Comparison of Different Cathode Catalysts and MFC Architectures and Configurations.The EPS analysis makes it possible to quantify electrode performance and compare the results with those of other studies and determine how the individual electrode area resistances impacted overall power production. For example, maximum power densities in two studies were reported to be similar, but the EPS analysis shows that this was for different reasons. In one study by Yang et al.,11 the maximum power density was 2.60±0.05 W m−2using an activated carbon cathode with an Fe−N−C catalyst (28 mL MFC, anode projected areaAAnof 4.9 cm2, cathode projected areaACatof 7 cm2, an electrode spacingdAn‑Catof 0.5 cm, and a
solution conductivityσof 6.94 mS cm−1). This was similar to another study by Santoro et al.45that gave values of 2.62 ± 0.04 W m−2 with a different MFC configuration (120 mL MFC;AAn= 18 cm2;A
Cat= 2.8 cm2;dAn‑Cat= 4.5 cm;σ= 16.4
mS cm−1) and a different Fe−N−C ORR catalyst. Thus, on the basis of the maximum power density alone, the performances of the two systems were quite similar, suggesting that the cathodes performed equally well in the two different MFCs. However, the MFC used by Santoro et al. was designed to have a much larger anode than cathode area (An:Cat projected area ratio of 6.4), so that the anode would not limit power production, while the MFC used by the reactor of Yang et al. had more similar-sized projected electrode areas (An:Cat = 0.82). Using the EPS analysis and polarization data corrected for ohmic losses between the working and reference electrodes, the anode area resistance (RAn) was 4.30±0.02 mΩm2for the
MFC of Santoro et al. (Figure 4). This was ∼4 times lower
than that obtained by Yang et al. (RAn = 19 ± 1 mΩ m2),
demonstrating the impact of the different relative electrode sizes on the resistances. The anode experimental potentials were similar, withEAn,e0values of−281.4±0.2 mV (Santoro et
al.) and−268±7 mV (Yang et al.). The results obtained here for the 70% DL MFCs (RAn = 10.6 ± 0.5 mΩ m2; EAn,e0 =
−260±3 mV, 70% DL) are also shown inFigure 4to provide a comparison to these previous two studies.
For the cathodes, the EPS slope analysis revealed that the main differences in the cathode performance were due to the working potentials of the cathodes (y-intercepts) and not their resistances (polarization data slopes). The measured and experimental cathode potentials were 557 ± 1 mV (ECat,m0) and 442 ± 19 mV (ECat,e0) in the study of Yang et al.,
compared to lower values of 431±2 mV (ECat,m0) and 426±3 mV (ECat,e0) determined by Santoro et al. The resistances of
the cathodes were 23±3 mΩm2for the study of Yang et al.,
higher than the values of 16.7± 0.4 mΩ m2 determined by Santoro et al.
[image:6.625.361.527.67.341.2]This comparison of the two studies using the EPS analysis demonstrated that electrode performance can be compared even when the MFC architectures are different. Although the power densities were similar, both the anodes and cathodes had different electrochemical characteristics. The experimental cathode potentials in the study of Yang et al. were higher, and thus, the cathodes had electrochemical performances that were
Figure 4.(A) Cathode (Ct) and (B) anode (An) potentials following correction for ohmic resistance using an Fe−N−C catalyst developed by Yang et al.11and Santoro et al.45compared to plain AC cathodes with 70% DL porosities. The results obtained here for the 70% DL MFCs are also shown to provide a comparison of the results of these previous two studies. Anode and cathode potentials not corrected for ohmic losses are reported inFigure S3. The dashed lines represent the linearization of the data that would be obtained from polarization tests, while the thick solid lines show the linearized portion of the slopes that are used to calculate the anode (RAn) and cathode (RCat) resistances.
better than those determined by Santoro et al. The power densities were only similar due to the lower area resistance of the anodes in the work of Santoro et al. (RAn= 4.3±0.02 mΩ m2) because this system was optimized to reduce anode limitations by using a much larger anode than cathode. However, the advantage of the larger anodes was partly nullified by a larger electrode spacing of 4.5 cm in the work of Santoro et al., as this produced a total anode and solution resistance of 31 mΩ m2 compared to the 0.5 cm spacing of
Yang et al. [resistance (RAn+RΩ) of 26 mΩm2]. As a result of
these differences, the total internal specific resistances were comparable (49 mΩ m2 for Yang et al. and 48 mΩ m2 for Santoro et al.), resulting in similar maximum power densities.
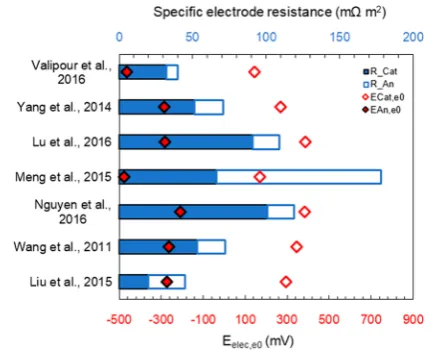
Comparison of Pt/C Cathodes in 28 mL MFCs. The utility of the EPS analysis was further demonstrated by using it to compare the performance of Pt/C cathodes in MFCs for several studies by different research groups (all 28 mL cube reactors, with brush anodes in 50 mM PBS and acetate media) (Figure 5). The average electrode area-based resistances
among these studies (RCat) was 59 ± 27 mΩ m2 (range of
20 mΩ m2< R
Cat < 101 mΩ m2), but the cathode working
potentials varied over a much larger range of 242 mV (387 mV <ECat,e0< 145 mV; average of 286±90 mV). The reason for this large range of working potentials could be a lack of proper correction for the ohmic losses between the electrodes17 or aging of the cathode, which weakens the performance over time.9The potentials presented infigures for the anodes in two of the studies were clearly wrong (EAn,e0values of −463 mV
determined by Valipour et al.46and−475 mV determined by Meng et al.47), as they were 200 mV lower than the thermodynamic potential for acetate oxidation (−296 mV,eq 3). In thefive other studies,32,48−51the anodes had relatively similar anode potentials (EAn,e0) of −262 ± 28 mV and a specific anode resistance (RAn) of 20±3 mΩm2. The reason
for the very high anode resistance (RAn) of 112 mΩm2based
on data in ref47is unknown.
Impact of Electrode Dimensions on Area-Based Resistances Using Wastewater. Analyzing the slope of similar electrode materials with different dimensions allows us to understand how the electrode resistance impacts perform-ance using larger electrodes. In a recent study, we examined power generation using brush anodes and cathodes with
projected sizes of 7 or 6200 cm2in MFCs treating domestic
wastewater.15,52Although the same materials were used for the electrodes (brush anodes and activated carbon cathodes), the large cathode had a stainless steel frame to hold multiple cathode panels, so the working area was reduced to 4800 cm2
(Figure S4). The maximum power density decreased from 0.304± 0.009 to 0.101 ± 0.006 W m−2 with an increase in electrode size. The experimental cathode potentials were different;ECat,e0= 368±8 mV for the large cathode, andECat,e0 = 265±22 mV (70% DL) for the 7 cm2cathode (Figure 6).15
If the electrode performance remained constant with increases in electrode size, then the area resistances should be constant. However, the large electrode cathode-specific resistance was 555±24 mΩm2, compared to a value of 66±17 mΩm2for
the smaller cathode. Thus, we can directly quantify the cathode performance using the EPS analysis as an area resistance that increased by 8-fold using the larger cathode.
The anode performance was also impacted by using larger electrodes but to a lesser extent than with the cathodes. The resistance for an array of 22 brush anodes (each 5.1 cm in diameter and 61 cm long) in the larger MFC was 238 ±18 mΩ m2, which was 3-fold higher than that of the smaller
anodes (71±3 mΩm2, 2.5 cm in diameter and 2.5 cm long). The experimental anode potential (EAn,e0) was−296±6 mV, which was similar to that of the small anode (EAn,e0=−301±
[image:7.625.339.548.186.341.2]4 mV). The impact of the increase in the electrode-specific resistance on the sizes of the electrodes has previously been compared only in terms of current or power densities. For example, it was estimated that the electrical power loss could be as much as 47% with an increase in the size of a carbon mesh anode from 10 to 10000 cm2 (current density of 3 A m−2), based on only one connection to the electrode.14The EPS analysis, however, makes it possible to directly compare the anode or cathode resistances rather than just the overall performance. Overall, for the large MFC, the cathode resistance was 2.3 times that of the anode resistance and 6.4 times larger than the solution resistance; thus, the main resistance in the large MFC was clearly the cathode. This is different from the case for the small chamber MFC in which
[image:7.625.71.290.287.462.2]Figure 5.Comparison of Pt/C cathode and brush anode potentials and specific resistances in 28 mL MFCs.
Figure 6. Comparison of anode (An) and cathode (Ct) potentials with projected areas of 7 and 0.62 m2 in wastewater following correction for ohmic resistance. Anode and cathode potentials not corrected for ohmic losses are reported inFigure S5. The dashed lines represent the linearization of the data that would be obtained from polarization tests, while the thick solid lines show the linearized portion of the slopes that are used to calculate the anode (RAn) and cathode (RCat) resistances.
the solution resistance using wastewater was larger than the individual anode- and cathode-specific resistances.
Recommendations for Future MFC Studies.The EPS analysis allows a simple and quantitative comparison of the performance of electrodes or whole cells for a wide range of MFC configurations. The analysis is based on the use of the polarization data near peak power; therefore, no additional electrochemical tests such as EIS or LSVs are needed. However, the analysis requires specific and accurate data for making the calculations, including the projected areas of both electrodes, the solution conductivity, and the spacing between the reference and working electrodes. Providing solution conductivities is even more important when working with wastewater, which may have different characteristics not only for different locations in the treatment plant but also at different times of the day. The impact of the solution conductivity on the electrode performance was clearly shown in this study, as the solution-specific resistance of the MFCs with PBS (14 mΩ m2) was 6.2 times lower than that of the MFCs with wastewater (87 mΩ m2). The polarization tests
conducted in wastewater resulted in anode- and cathode-specific resistances that were 7 times larger in wastewater (for the 30% DL,RAn= 78±2 mΩm2andR
Cat= 78±14 mΩm2)
than in PBS (for the 30% DL,RAn= 11±1 mΩm2andRCat= 12±5 mΩm2).
By using the EPS analysis to determine electrode potentials and area-based resistances, the reasons for the different performance in each configuration can be easily assessed on the basis of electrode potentials and resistances, or possible errors can be identified. For example, while the working potentials and area-based electrode resistances obtained by an EPS analysis of the electrodes were seen to be similar in several studies that were examined (Figure 5), errors were clearly obvious for two studies in which theEAn,e0was more negative than that possible based on a thermodynamic calculation.46,47 If theEAn,e0had been calculated in that study, this error could
likely have been avoided as it would have been more obvious that the value was not possible. For the anodes, the area resistances in the studies examined here were fairly similar, and thus, the main differences were due to the cathode potentials and area-based resistances. The EPS analysis makes it possible to quantify these individual resistances, when ohmic resistances are separately reported and electrode potentials are corrected for ohmic drops between the reference and working electro-des.17Thus, the use of this method enables an easier and more direct comparison of performances of these different electrode materials based on the quantitative analysis of components rather than the overall power density.
■
ASSOCIATED CONTENT*
S Supporting InformationThe Supporting Information is available free of charge on the
ACS Publications websiteat DOI:10.1021/acs.est.8b06004.
Threefigures showing anode and cathode potentials not corrected for the solution conductivity, one figure showing the impact of the current density range on the electrode resistance and the experimental potentials, and onefigure showing the air and the solution side of a scaled-up cathode (PDF)
■
AUTHOR INFORMATIONCorresponding Author
*E-mail: [email protected]. Phone: 814-863-7908. Fax: +1-814-863-7304.
ORCID
Ruggero Rossi:0000-0002-3807-3980
Carlo Santoro:0000-0002-0944-4500
Pascal E. Saikaly: 0000-0001-7678-3986
Bruce E. Logan: 0000-0001-7478-8070
Notes
The authors declare no competingfinancial interest.
■
ACKNOWLEDGMENTSThe research was supported by funds provided by the Environmental Security Technology Certification Program via Cooperative Research Agreement W9132T-16-2-0014 through the U.S. Army Engineer Research and Development Center.
■
REFERENCES(1) Logan, B. E.; Hamelers, B.; Rozendal, R.; Schröder, U.; Keller, J.; Freguia, S.; Aelterman, P.; Verstraete, W.; Rabaey, K. Microbial Fuel Cells: Methodology and Technology.Environ. Sci. Technol.2006,40 (17), 5181−5192.
(2) Logan, B. E.; Wallack, M. J.; Kim, K. Y.; He, W.; Feng, Y.; Saikaly, P. E. Assessment of Microbial Fuel Cell Configurations and Power Densities.Environ. Sci. Technol. Lett.2015,2(8), 206−214.
(3) Lovley, D. R. Bug Juice: Harvesting Electricity with Micro-organisms.Nat. Rev. Microbiol.2006,4(7), 497−508.
(4) Li, W.-W.; Yu, H.-Q.; He, Z. Towards Sustainable Wastewater Treatment by Using Microbial Fuel Cells-Centered Technologies.
Energy Environ. Sci.2014,7(3), 911−924.
(5) Logan, B.; Cheng, S.; Watson, V.; Estadt, G. Graphite Fiber Brush Anodes for Increased Power Production in Air-Cathode Microbial Fuel Cells.Environ. Sci. Technol.2007,41(9), 3341−3346. (6) Cheng, S.; Logan, B. E. Ammonia Treatment of Carbon Cloth Anodes to Enhance Power Generation of Microbial Fuel Cells.
Electrochem. Commun.2007,9(3), 492−496.
(7) Santoro, C.; Arbizzani, C.; Erable, B.; Ieropoulos, I. Microbial Fuel Cells: From Fundamentals to Applications. A Review.J. Power
Sources2017,356, 225−244.
(8) Zhang, F.; Yuan, S. J.; Li, W. W.; Chen, J. J.; Ko, C. C.; Yu, H. Q. WO3 Nanorods-Modified Carbon Electrode for Sustained Electron Uptake from Shewanella oneidensis MR-1 with Suppressed Biofilm Formation.Electrochim. Acta2015,152, 1−5.
(9) Yang, W.; Kim, K. Y.; Saikaly, P. E.; Logan, B. E. The Impact of New Cathode Materials Relative to Baseline Performance of Microbial Fuel Cells All with the Same Architecture and Solution Chemistry.Energy Environ. Sci.2017,10(5), 1025−1033.
(10) Pant, D.; Van Bogaert, G.; De Smet, M.; Diels, L.; Vanbroekhoven, K. Use of Novel Permeable Membrane and Air Cathodes in Acetate Microbial Fuel Cells.Electrochim. Acta2010,55 (26), 7710−7716.
(11) Yang, W.; Logan, B. E. Immobilization of a Metal−Nitrogen− Carbon Catalyst on Activated Carbon with Enhanced Cathode Performance in Microbial Fuel Cells.ChemSusChem2016,9, 2226− 2232.
(12) Zhang, X.; Pant, D.; Zhang, F.; Liu, J.; He, W.; Logan, B. E. Long-Term Performance of Chemically and Physically Modified Activated Carbons in Air Cathodes of Microbial Fuel Cells.
ChemElectroChem2014,1(11), 1859−1866.
(13) Dewan, A.; Beyenal, H.; Lewandowski, Z. Scaling up Microbial Fuel Cells.Environ. Sci. Technol.2008,42(20), 7643−7648.
Leading-out Terminal of Anode. J. Power Sources2014, 248, 931− 938.
(15) Rossi, R.; Jones, D.; Myung, J.; Zikmund, E.; Yang, W.; Alvarez Gallego, Y.; Pant, D.; Evans, P. J.; Page, M. A.; Cropek, D. M.; Logan, B. E. Evaluating a Multi-Panel Air Cathode through Electrochemical and Biotic Tests.Water Res.2019,148, 51−59.
(16) Fan, Y.; Sharbrough, E.; Liu, H. Quantification of the Internal Resistance Distribution of Microbial Fuel Cells Quantification of the Internal Resistance Distribution of Microbial Fuel Cells.Environ. Sci.
Technol.2008,42(21), 8101−8107.
(17) Logan, B. E.; Zikmund, E.; Yang, W.; Rossi, R.; Kim, K.-Y.; Saikaly, P. E.; Zhang, F. Impact of Ohmic Resistance on Measured Electrode Potentials and Maximum Power Production in Microbial Fuel Cells.Environ. Sci. Technol.2018,52, 8977−8985.
(18) Logan, B. E. Scaling up Microbial Fuel Cells and Other Bioelectrochemical Systems.Appl. Microbiol. Biotechnol.2010,85(6), 1665−1671.
(19) Ribot-Llobet, E.; Nam, J. Y.; Tokash, J. C.; Guisasola, A.; Logan, B. E. Assessment of Four Different Cathode Materials at Different Initial pHs Using Unbuffered Catholytes in Microbial Electrolysis Cells.Int. J. Hydrogen Energy2013,38(7), 2951−2956.
(20) Zhang, Y.; Merrill, M. D.; Logan, B. E. The Use and Optimization of Stainless Steel Mesh Cathodes in Microbial Electrolysis Cells. Int. J. Hydrogen Energy 2010, 35 (21), 12020− 12028.
(21) Aulenta, F.; Catapano, L.; Snip, L.; Villano, M.; Majone, M. Linking Bacterial Metabolism to Graphite Cathodes: Electrochemical Insights into the H2-Producing Capability of Desulfovibrio Sp.
ChemSusChem2012,5(6), 1080−1085.
(22) Velasquez-Orta, S. B.; Curtis, T. P.; Logan, B. E. Energy from Algae Using Microbial Fuel Cells.Biotechnol. Bioeng.2009,103 (6), 1068−1076.
(23) Yan, H.; Yates, M. D.; Regan, J. M. Effects of Constant or Dynamic Low Anode Potentials on Microbial Community Develop-ment in Bioelectrochemical Systems.Appl. Microbiol. Biotechnol.2015, 99(21), 9319−9329.
(24) Jung, S.; Regan, J. M. Influence of External Resistance on Electrogenesis, Methanogenesis, and Anode Prokaryotic Commun-ities in Microbial Fuel Cells.Appl. Environ. Microbiol.2011,77(2), 564−571.
(25) Lewis, A. J.; Borole, A. P. Adapting Microbial Communities to Low Anode Potentials Improves Performance of MECs at Negative Potentials.Electrochim. Acta2017,254, 79−88.
(26) Zhang, F.; Liu, J.; Ivanov, I.; Hatzell, M. C.; Yang, W.; Ahn, Y.; Logan, B. E. Reference and Counter Electrode Positions Affect Electrochemical Characterization of Bioanodes in Different Bioelec-trochemical Systems.Biotechnol. Bioeng.2014,111(10), 1931−1939. (27) Liang, P.; Huang, X.; Fan, M. Z.; Cao, X. X.; Wang, C. Composition and Distribution of Internal Resistance in Three Types of Microbial Fuel Cells. Appl. Microbiol. Biotechnol. 2007, 77 (3), 551−558.
(28) Sleutels, T. H. J. A.; Hamelers, H. V. M.; Rozendal, R. A.; Buisman, C. J. N. Ion Transport Resistance in Microbial Electrolysis Cells with Anion and Cation Exchange Membranes.Int. J. Hydrogen
Energy2009,34(9), 3612−3620.
(29) Wen, Q.; Wu, Y.; Cao, D.; Zhao, L.; Sun, Q. Electricity Generation and Modeling of Microbial Fuel Cell from Continuous Beer Brewery Wastewater.Bioresour. Technol.2009,100(18), 4171− 4175.
(30) Rismani-Yazdi, H.; Carver, S. M.; Christy, A. D.; Tuovinen, O. H. Cathodic Limitations in Microbial Fuel Cells: An Overview. J.
Power Sources2008,180(2), 683−694.
(31) Feng, C.; Li, F.; Liu, H.; Lang, X.; Fan, S. A Dual-Chamber Microbial Fuel Cell with Conductive Film-Modified Anode and Cathode and Its Application for the Neutral Electro-Fenton Process.
Electrochim. Acta2010,55(6), 2048−2054.
(32) Nguyen, M. T.; Mecheri, B.; Iannaci, A.; D’Epifanio, A.; Licoccia, S. Iron/Polyindole-Based Electrocatalysts to Enhance
Oxygen Reduction in Microbial Fuel Cells. Electrochim. Acta2016, 190, 388−395.
(33) Watson, V. J.; Logan, B. E. Analysis of Polarization Methods for Elimination of Power Overshoot in Microbial Fuel Cells.Electrochem.
Commun.2011,13(1), 54−56.
(34) Zhu, X.; Tokash, J. C.; Hong, Y.; Logan, B. E. Controlling the Occurrence of Power Overshoot by Adapting Microbial Fuel Cells to High Anode Potentials.Bioelectrochemistry2013,90, 30−35.
(35) Shao, Z.; Haile, S. M. A High-Performance Cathode for the next Generation of Solid-Oxide Fuel Cells.Nature2004,431(7005), 170−173.
(36) Popat, S. C.; Ki, D.; Rittmann, B. E.; Torres, C. I. Importance of OH− Transport from Cathodes in Microbial Fuel Cells.
ChemSusChem2012,5(6), 1071−1079.
(37) Rojas-Carbonell, S.; Artyushkova, K.; Serov, A.; Santoro, C.; Matanovic, I.; Atanassov, P. Effect of pH on the Activity of Platinum Group Metal-Free Catalysts in Oxygen Reduction Reaction. ACS
Catal.2018,8(4), 3041−3053.
(38) Watson, V. J.; Nieto Delgado, C.; Logan, B. E. Influence of Chemical and Physical Properties of Activated Carbon Powders on Oxygen Reduction and Microbial Fuel Cell Performance.Environ. Sci.
Technol.2013,47, 6704−6710.
(39) Santoro, C.; Kodali, M.; Kabir, S.; Soavi, F.; Serov, A.; Atanassov, P. Three-Dimensional Graphene Nanosheets as Cathode Catalysts in Standard and Supercapacitive Microbial Fuel Cell. J.
Power Sources2017,356, 371−380.
(40) Min, B.; Cheng, S.; Logan, B. E. Electricity Generation Using Membrane and Salt Bridge Microbial Fuel Cells.Water Res.2005,39 (9), 1675−1686.
(41) Feng, Y.; Yang, Q.; Wang, X.; Logan, B. E. Treatment of Carbon Fiber Brush Anodes for Improving Power Generation in Air-Cathode Microbial Fuel Cells.J. Power Sources2010,195(7), 1841− 1844.
(42) Zhang, F.; Pant, D.; Logan, B. E. Long-Term Performance of Activated Carbon Air Cathodes with Different Diffusion Layer Porosities in Microbial Fuel Cells.Biosens. Bioelectron.2011,30(1), 49−55.
(43) Lovley, D. R.; Phillips, E. J. P. Novel Mode of Microbial Energy Metabolism: Organic Carbon Oxidation Coupled to Dissimilatory Reduction of Iron or Manganese.Appl. Environ. Microbiol.1988,54 (6), 1472−1480.
(44) Rossi, R.; Yang, W.; Setti, L.; Logan, B. E. Assessment of a Metal−Organic Framework Catalyst in Air Cathode Microbial Fuel Cells over Time with Different Buffers and Solutions. Bioresour.
Technol.2017,233, 399−405.
(45) Santoro, C.; Kodali, M.; Herrera, S.; Serov, A.; Ieropoulos, I.; Atanassov, P. Power Generation in Microbial Fuel Cells Using Platinum Group Metal-Free Cathode Catalyst: Effect of the Catalyst Loading on Performance and Costs.J. Power Sources2018,378, 169− 175.
(46) Valipour, A.; Ayyaru, S.; Ahn, Y. Application of Graphene-Based Nanomaterials as Novel Cathode Catalysts for Improving Power Generation in Single Chamber Microbial Fuel Cells.J. Power
Sources2016,327, 548−556.
(47) Meng, K.; Liu, Q.; Huang, Y.; Wang, Y. Facile Synthesis of Nitrogen and Fluorine Co-Doped Carbon Materials as Efficient Electrocatalysts for Oxygen Reduction Reactions in Air-Cathode Microbial Fuel Cells.J. Mater. Chem. A2015,3(13), 6873−6877.
(48) Yang, W.; Zhang, F.; He, W.; Liu, J.; Hickner, M. A.; Logan, B. E. Poly(vinylidene Fluoride-Co-Hexafluoropropylene) Phase Inver-sion Coating as a DiffuInver-sion Layer to Enhance the Cathode Performance in Microbial Fuel Cells. J. Power Sources 2014, 269, 379−384.
(49) Lu, G.; Zhu, Y.; Lu, L.; Xu, K.; Wang, H.; Jin, Y.; Jason Ren, Z.; Liu, Z.; Zhang, W. Iron-Rich Nanoparticle Encapsulated, Nitrogen Doped Porous Carbon Materials as Efficient Cathode Electrocatalyst for Microbial Fuel Cells.J. Power Sources2016,315, 302−307.
Catalyst in Microbial Fuel Cells.Bioresour. Technol. 2011,102 (8), 5093−5097.
(51) Liu, Q.; Zhou, Y.; Chen, S.; Wang, Z.; Hou, H.; Zhao, F. Cellulose-Derived Nitrogen and Phosphorus Dual-Doped Carbon as High Performance Oxygen Reduction Catalyst in Microbial Fuel Cell.
J. Power Sources2015,273, 1189−1193.