The Effect of Microstructure on Mechanical Properties
of Forged 6061 Aluminum Alloy
Manabu Nakai
1,2and Goroh Itoh
1 1Ibaraki University, Hitachi 316-8511, Japan 2Kobe Steel, Ltd., Mooka 321-4367, JapanThe relationship between the microstructure and the yield strength after T6 tempering was investigated using 6061 aluminum alloy manufactured at various levels of temperature and strain rate during hot forging. Non-recrystallized structures (continuous recrystallization structure) were formed by hot forging at low ZenerHollomon parameter (Zparameter) conditions, which consisted offine grains surrounded by high angle grain boundaries and contained low angle grain boundaries inside. Increasing the Zparameter formed fine-grained structures, resulting in increased yield strength. Increasing further the Z parameter formed recrystallization, having coarse recrystallized structures (discontinuous recrystallization structure) of hundreds of micrometers in diameter with high angle grain boundaries, resulting in significantly reduced yield strength. The yield strength of the material with recrystallized grain structures was less dependent on the grain size. On the other hand, the yield strength of the material with non-recrystallized structures was severely dependent on the grain size, roughly in accordance with the previous data. Subgrain strengthening appeared to be more effective than recrystallized grain strengthening. In consideration of the effect of the texture on the yield strength using Schmidt factor,¸Acrss (the value equivalent to critical resolved shear stress in the slip direction.
¸ACRSS¹¸ACRSS0=kAdA¹mA,¸ACRSS=s··0.2,s: the averaged Schmidt factor in the tensile direction.dA: grain sizes in the slip direction) was less
dependent ondA. In consideration of the texture, the yield strength of 6061-T6 is essentially less dependent on the grain size as reported previously. [doi:10.2320/matertrans.MA201324]
(Received September 2, 2013; Accepted November 1, 2013; Published December 25, 2013)
Keywords: 6061 aluminum alloy, HallPetch relation, subgrain, ZenerHollomon parameter
1. Introduction
In 6XXX aluminum alloys, high strength is obtained by increasing the amount of Mg2Si. It is reported that, however,
there are problems of reduced fracture toughness and corrosion resistance in 6X51 type aluminum alloy with excess Si.1)The requirement is for materials which have not
only high strength but high fracture toughness and corrosion resistance for applications. It is known that those aluminum alloys which have high stacking fault energy easily form subgrains due to polygonization during hot working. Forged material is manufactured mainly by hot forging and subsequent T6 tempering. Generally, mechanical properties of hot forged material of heat-treatable aluminum alloy are greatly affected by the substructure formed during hot forging.
The 6061 moderate strength aluminum alloy have been extensively used in vehicles, ships, land structures, etc. since it was AA registered in 1954. As a result of investigating the relationship between the microstructure and the properties of 6061-T6,25)hot forging at high temperature and low strain
rate formed mainly subgrains, resulting in significantly increased yield strength, compared to the recrystallized grains obtained at low temperature and high strain rate conditions. Both the fracture toughness and the resistance to intergranular corrosion were also increased. It was proved that a high strength and reliable material could be obtained by control-ling microstructures, but not by increasing alloy constituents. A modified HallPetch relation (eq. (1)) has been proposed for improving the yield strength by subgrain formation.6,7)
·0:2¼·0þK dSPd1=2¼·0þK dSm ð1Þ
Where, ·0 is the yield stress of the tempered material that
does not contain any substructure, and k and m are
experiment constants. When m=0.5 (p=0), eq. (1) repre-sents the HallPetch relation. This means that the subgrain boundary is more effective as a resistance to dislocation than the recrystallized grain boundary. On the other hand, it is supposed that the dislocation tends to pass, but not be piled, at a low angle grain boundary that forms subgrains, and the low angle grain boundary does not contribute to improve the yield strength so much as the high angle grain boundary. Furthermore, deformation texture may be developed in a non-recrystallized structure where such subgrains are formed.
The object of the present paper was to clarify the interrelationship among alloy/process-subgrain microstruc-ture and mechanical properties combined with microme-chanics, and to improve strength and fracture toughness of forged 6061 aluminum alloy.
2. Material and Methods
2.1 Processing and experimental procedure
The present work has been carried out on an AA6061 alloy. The chemical composition is shown in Table 1. The material which was prepared by melting and DC casting as ¤80 mm billets were homogenized at 773 K for 4 h, and were then hot forged. The hot forging conditions were as follows: All the specimens were hot forged at 583773 K, at initial strain rates of 2.7©10¹42.7©10¹1s¹1, with 71.1% reduction. Table 2 shows the detailed forging conditions. In this work, the hot forging conditions are expressed by Zener Hollomon parameter, as shown by the following eq. (2):
Z ðd¾=dtÞ expðQ=RTÞ; ð2Þ
where Z is ZenerHollomon parameter, d¾/dt is the initial strain rate (s¹1),Tis the temperature (K) in hot forging,Qis
the activation energy (144 kJ/mol),8) R is the gas constant
(8.31 J/mol·K). The hot forged specimens were solution heat
Special Issue on Strength of Fine Grained Materials®60 Years of HallPetch®
treated at 813 K for 3 h and subsequently quenched in water at 298 K. All the specimens were then aged at 453 K for 8 h in T6 temper. Microstructure characterizations of the specimens were made by optical microscopy (OM) and scanning electron microscopy (SEM). OM observations were prepared using caustic soda etching. Tensile tests were carried out at 3.3©10¹3s¹1in the long transverse (LT) direction according
to ASTM-E8. The fracture toughness Kc was estimated by
the following eq. (3):
Kc¼36:6NTR20:82; ð3Þ
where NTR is Notch tensile strength/Tensile yield strength Ratio. Figure 1 shows the observation part of microstruc-tures, geometry of tensile test piece, and its sampling part.
3. Results
[image:2.595.47.549.94.150.2]3.1 Microstructure
Figure 2 shows the relationship between the fraction recrystallized and the hot forging conditions, including other
test materials examined in the past. The judgment about whether or not it was recrystallized was made using OM micrographs after electrolytic etching. The fraction recrystal-lized increases sigmodially with the increasingZ parameter. The fraction recrystallized is almost zero when the Z
parameter is 108s¹1or less, whereas it is almost 100%when
theZparameter is 1010s¹1or more.
3.2 SEM-EBSD micrographs
In Fig. 3, the grain boundary with an angle of 15° or more is indicated with a thick line, whereas the grain boundary with an angle of 2 to 15° is indicated with a thin line. HighZ
(2) shows recrystallized structures consisting mostly of high angle grain boundaries, where high angle (15° or more) grain boundaries account for about 98%. In addition, some coarse grains with Y orientation and Z orientation were observed in HighZ(2), which are usually observed in the surface layer of rolled materials.9) Here, textures are displayed in the same
way as for rolling textures, where the compressive surface and the grain flow correspond to the rolled surface and the rolling direction, respectively. Middle Z(2) and Low Zalso consist mostly of high angle grain boundaries, where they account for about 75 and 85%, respectively. The grain sizedL
(ª=15) is 13 and 20 µm, respectively. The grain size d
S
(ª=2) is 10 and 14 µm, respectively. Either grain size is the
smallest in Middle Z (2), with intermediate Z parameter among the 3 types of specimens. Middle Z (2) and Low Z
form an ¡-orientation group from the Goss to the Brass orientation,9) which is usually observed in cold-rolling
materials with high deformation. They are piled as high as about 24%in MiddleZ(2), compared to about 19%in Low
[image:2.595.315.541.119.348.2]Z. Table 3 shows the grain size measurement results along with various microstructure parameters described later.
Table 2 Testing conditions of hot forging,T: temperature,¾0_: initial strain rate,Z: ZenerHollomon parameter.
Specimens T/K _¾0/s¹1 Z/s¹1
LowZ
773
2.7©10¹4 1.1©106
MiddleZ(1) 2.7©10¹3 1.1©107
MiddleZ(2) 2.7©10¹2 1.1©108
MiddleZ(3) 2.7©10¹1 1.1©109
HighZ(1) 698 2.7©10¹1 1.1©1010
HighZ(2) 638 2.7©10¹1 1.1©1011
HighZ(3) 583 2.7©10¹1 1.4©1012
Tensile direction (T) Section for microstructural charcterization (L-ST)
(L) Flow direction (L)
(L)
Forged plate of ϕ120mm×t26mm
Tnesile test piece
Fig. 1 Configuration of the tensile test piece and the section for microstructural characterization with respect to the forged plate.
0 20 40 60 80 100
Z / s-1
Fraction Recrystallized (%)
Present study
Hosoda & Nakai2)
5 6 7 8 9 10 11
10 10 10 10 10 10 10 1012
Fig. 2 A fraction recrystallized as function ofZ. Previous results2)are also
shown.
Table 1 Chemical composition of the 6061alloy specimen in mass%. Composition range standardized by Aluminum Association is also indicated.
Alloys Si Fe Cu Mn Mg Cr Zn Ti
Specimen 0.74 0.22 0.23 ® 0.96 0.12 ® 0.02
Standard 0.40 50:7 0.15 50:15 0.80 0.04 50:25 50:15
[image:2.595.46.291.206.319.2] [image:2.595.47.288.222.499.2]3.3 Mechanical properties
Table 4 shows the tensile characteristics of HighZ, Middle
Z, and Low Z. The yield strength of Middle Z with fine subgrained structure is as high as 345 to 354 MPa. Low Z
with slightly coarse subgrained structure shows 333 MPa, and HighZ with coarse recrystallized structure shows as low as 308 to 310 MPa.
3.4 Strengthening mechanism
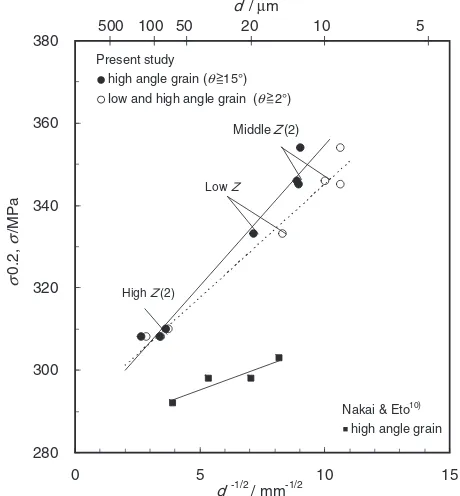
The relationship between the yield strength · and grain sizedof the test materials, including HighZ, Middle Z, and LowZ was analyzed following the HallPetch relation:
· ¼·0þKyd1=2 ð4Þ
where·is yield strength,·0is yield strength of the materials
with single crystal,Ky is the constant and d is the subgrain
or grain sizes. The results are shown in Fig. 4. Solid line shows the grain sizedL(ª²15°) only, and broken line shows
the grain sizedS(ª²2°). Figure 4 shows also the previous
data by Nakai and Eto10)using material with recrystallized
Low Z
Middle Z
Brass (110)[1-12]
Goss (110)[001]
P (101)[-1-11]
PP (101)[-2-12]
RG (101)[-101]
RW (001)[-1-10]
SA (321)[-1-39]
SF (123)[-1-43]
Y (111)[-1-12]
Z (111)[0-11]
(2)
High Z
(2)
LST
[image:3.595.90.511.70.269.2]Fig. 3 Inverse polefigure maps of the three specimens. Grain boundary map is superimposed. :ª=15, :15>ª=2, whereªis misorientation angle.
Table 3 Microstructural parameters of each specimen.dst: grain size in ST
direction,ª: misorientation angle,s: Schmidt factor averaged based on volume fraction of each grain.
Specimen
Optical
microscope SEM-EBSD TEM
dST/µm
dST/µm
s μ/cm¹2
ª=2 ª=15
LowZ 14 14 20 0.432 7.2©108
MiddleZ(1) ® 9 12 0.425 ®
MiddleZ(2) 9 10 13 0.430 7.5©108
MiddleZ(3) ® 9 12 0.426 ®
HighZ(1) ® 71 75 0.452 ®
HighZ(2) 121 123 141 0.447 6.1©108
[image:3.595.311.541.327.575.2]HighZ(3) ® 84 86 0.464 ®
Table 4 Mechanical properties of each specimen T6-tempered.·u: ultimate
tensile strength,·0.2: 0.2%proof stress,¤: elogation to failure.
·u/MPa ·0.2/MPa ¤(%)
LowZ 364 333 15.6
MiddleZ(1) 379 354 16.4
MiddleZ(2) 373 346 15.9
MiddleZ(3) 373 345 14.5
HighZ(1) 327 310 16.0
HighZ(2) 328 308 17.8
HighZ(3) 339 308 17.5
280 300 320 340 360 380
0 5 10 15
d -1/2 / mm-1/2
σ
0.2,
σ
/MPa
High Z(2) Low Z Present study
high angle grain (θ
low and high angle grain (θ
Nakai & Eto10) high angle grain
500 20 10
d / μm
Middle Z(2) 15°)
2°)
100 50 5
Fig. 4 ·0.2vs.d¹1/2plots of each specimen.drepresentsdstmeasured by
SEM-EBSD. Solid curve:ª=15, broken curve:ª=2. Previous data4)
[image:3.595.46.291.360.498.2] [image:3.595.47.292.566.665.2]grains only. The yield strength of the material with recrystallized grains only is less dependent on the grain size, and the increase in yield strength is as small as several MPa even when the grain size is reduced to the minimum of 15 µm (d¹1/2=8 mm¹1/2). On the other hand, the yield strength of the material with subgrains is severely dependent on the grain size, even with high angle grain boundaries only. This means that high yield strength of subgrained 6061-T6 alloy were due to subgrain strengthening. However, when the grain size is reduced to approximately 10 µm (d¹1/2²
9 mm¹1/2), the relationship between the yield strength and the grain size (d¹1/2) is not linear, where the yield strength
increases significantly with the slightly decreasing grain size, and it can no longer be represented by the HallPetch relation.
The increase in yield strength by subgrains is often represented by the modified HallPetch relation (eq. (1)) as described in the introduction. Whenm=0.5 (p=0), eq. (1) represents the HallPetch relation.·0is the yield stress of the
material that does not contain any substructure. Accordingly, ·0 was calculated using the relationship between the yield
stress and grain size of High Z mostly with recrystallized grain only. Firstly, the yield stress and grain size were analyzed using the HallPetch relation, and·0was calculated
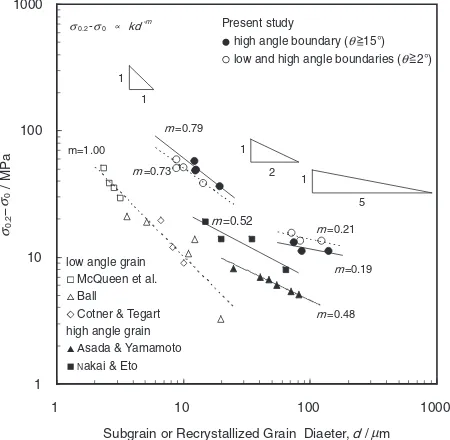
when d¹1/2=0. Then, the slope m was determined from a double logarithmic plot of ·¹·0=k·d¹m, using the ·0
calculated above. Then, with thism, the yield stress and grain size were analyzed using the relation of·¹·0=k·d¹m, and
·0 was calculated when d¹m=0. mand ·0 were calculated
in the same way until «m(n+1)¹m(n)«<0.01.n was 25 times. The values of ·0 corresponding to the grain sizes dL
and dS are 297 and 295 MPa, respectively. For High Z (2),
MiddleZ(2) and LowZ, the yield stress and grain size were analyzed using the relation of ·¹·0=k·d¹m, and plotted
on a double logarithmic chart in Fig. 5. In the same way as shown in Fig. 4, solid line shows the grain size dL, and
broken line shows dS. For reference, Fig. 5 shows also the
related data in the previous studies.1013)
In the previous studies, m is as large as 1.00 when
dS¯10 µm. Also, m is as large as 0.79 and 0.73, when
d¯20 µm in this study. It is believed that the strength of the subgrain boundary increases with the decreasing subgrain size. However, the orientation difference of the subgrains with low angle grain boundaries is as small as several degrees. It is supposed that the dislocation tends to pass, but not be piled at such boundaries. Therefore, it is difficult to attribute the increased yield strength in Low Z rather than HighZ, and further more in MiddleZ, only to the growth of subgrains i.e., low angle grain boundaries. According to the both studies by Nakai and Eto using the recrystallized material with high angle grain boundaries,10) and by Asada and Yamamoto using the material with high angle grain boundaries,13) the results correspond to the HallPetch relation as m=0.5. Even when the data in this study is analyzed in terms of the relationship (solid line) between the yield strength and the grain size dL with high angle grain
boundaries only, mis as large as 0.79, when dL¯20 µm, in
the same way as low angle grain is included. The recrystal-lized material used by Nakai and Eto was T6 tempered after cold rolling. The solution heat treatment was by a rapid
heating process in a salt bath. Deformation textures are hardly developed since recrystallization occurs in a high deforma-tion area around coarse second phase crystals. On the other hand, deformation structures after hot forging remains in the developed subgrain structure in Low Z and Middle Z, as shown in Fig. 2.
To take into consideration the effect of the texture on the yield strength, the relationship between the yield strength and grain size was analyzed using the following relation (eq. (4)).
¸0
CRSS¼¸0CRSS0þk0dslip0m0 ð5Þ
¸0
CRSS¼s· ¸0
CRSS0¼s·0
Where,¸ACRSSis the value equivalent to the critical resolved
shear stress, andsis the averaged Schmidt factor. The¸ACRSS
was determined by multiplying the yield stress by the averaged Schmidt factor. s is the averaged Schmidt factor in the tensile direction (LT direction) of each specimen calculated based on the volume fraction in each orientation, which is shown in Table 3.¸ACRSS0is the value equivalent to
the critical resolved shear stress of the material that does not contain any substructure.kAandmAare the constants.dslipAis
the grain size in the slip direction. The grain sizesdl and dS
are the values measured in the thickness direction (ST). Assuming that is the angle between the slip direction and the tensile direction (LT), the grain size in the slip direction is represented as dLslipA=dL/cos and dSslipA=dS/cos.
Assume thatªis the angle between the normal line to the slip plane (111) of a grain and the tensile direction (LT). There are 4 equivalent slip planes: cosª1, cosª2, cosª3, cosª4, and
the maximum cosª. cos was determined based on the relation of s=cosª· cos, and the grain sizes in the slip direction dLslipA (=dL/cos) and dSslipA (=dS/cos) were
calculated. The crystal orientation {hkl} huvwi of a grain
1 10 100 1000
1 10 100 1000
m=1.00
m =0.79
σ0.2-σ0 kd
-m Present study
high angle boundary (θ low and high angle boundaries (θ
m =0.19 m =0.73 m=0.52 m =0.21 2 1 m =0.48 low angle grain
McQueen et al. Ball Cotner & Tegart high angle grain
Asada & Yamamoto
Nakai & Eto 1 1 1 5 σ0.2 − 0 / MPa σ 15°) 2°)
Subgrain or Recrystallized Grain Diaeter, d / mμ
Fig. 5 Double logalithmic plots between ·0.2¹·0 vs.d, assuming that
·0:2·0/dm. ·
0: stress derived from HallPetch relationship by
extrapolating d¹1/2¼0. Previous data are also shown. Solid line: for
[image:4.595.315.540.72.292.2]representing each specimen was assumed to be the crystal orientation with the highest strength distribution by the ODF analysis. The {hkl} plane is parallel to the forging surface corresponding to the rolling surface, whereas the huvwi direction is parallel to the tensile direction (LT). As shown in Table 3, the averaged Schmidt factor is low for Middle Z
with high yield strength, but high in High Z for low yield strength, as 0.464 for High Z(2), 0.426 for Middle Z (2), and 0.432 for LowZ.
Figure 6 shows the relationship between ¸ACRSS and dA
(grain sizes in the slip direction) in a double logarithmic chart. Where,mis lower than the HallPetch relation as 0.39,
but not as high as about 0.7. With high angle grain boundaries only, m corresponds almost to the HallPetch
relation as 0.47. Consequently, it is supposed that the lowest yield strength (LT direction) in High Z, and increasingly higher yield strength in Low Z and Middle Z in this order are caused by the development of the texture corresponding to low Schmidt factor (LT direction), since deformation structures after hot forging remain due to continuous recrystallization. The development of such textures relates to the formation of subgrains, and further fine subgrained structures. ¸ACRSS in consideration of the texture is less
dependent on the grain size.
3.5 Fracture toughness
As shown in Fig. 7, estimated fracture toughness Kc of
subgrained Middle Z(2) and Low Z(2) were higher than for recrystallized High Z. Kc was calculated by eq. (3). The
fracture toughness of three materials, recrystallized High Z, subgrained Middle Z(2) and Low Z(2) were 39.0, 40.5, 40.0 MPa·m0.5, respectively. In conventional alloys, if yield
strength heightens, fracture toughness is lowered. But the subgrained materials lead to both high strength and high fracture toughness.
4. Conclusions
The results of examining and analyzing the relationship between the microstructure and yield strength after T6 tempering, using the specimens of 6061 alloy manufactured at various levels of temperature and strain rate during hot forging, are as follows.
(1) When the Z parameter was 1.1©106, 1.1©108, and
1.1©1011s¹1, the grain size (SEM-EBSD) was 14 µm,
10 µm, 123 µm, and the yield strength was 333, 346, and 308 MPa, respectively. The smallest grain size d
and the highest yield strength were achieved when using the intermediateZparameter during hot forging. (2) The yield strength of the material with recrystallized grain structures was less dependent on the grain size. On the other hand, the yield strength of the material with fine grains containing subgrain boundaries was severely dependent on the grain size, roughly in accordance with the previous data. Accordingly, fine subgrain strengthening appeared to be more effective thanfine recrystallized grain strengthening.
(3) However, when the grain size is reduced to approx-imately 10 µm, the relationship between the yield strength and the grain size (d¹1/2) is not linear, where
the yield strength increases significantly with the slightly decreasing grain size, and it can no longer be represented by the HallPetch relation.
(4) In consideration of the effect of the texture on the yield strength using Schmidt factor,¸Acrss was less dependent ondA. The yield strength of 6061-T6 is essentially less dependent on the grain size as reported previously. (5) Fracture toughness of subgrained materials were higher
than for recrystallized. The subgrained materials have high yield strength combined with high fracture toughness.
1 10 100 1000
1 10 100 1000
τ
'CRSS
-τ
'CRSS0
/ MPa
τ' CRSS - τ'CRSS0∝ k'd ' -m'
Present study high angle boundary (θ low and high angle boundaries (θ
m' =0.36 m' =0.39
m' =0.34 m' =0.47
3 2
1 1
τCRSS0 = sσ0 τ'
'
CRSS = sσ0.2 15°)
2°)
d ' / μm
Fig. 6 Double logarithmic plots between¸ACRSS¹¸ACRSS0anddA, assuming
thats ð·0:2·0Þ /d0m0.s: average Schmidt factor,¸A
CRSS¹¸ACRSS0is
equal tos· (·0.2¹·0).dA: grain size in the slip direction. Solid line: for
recrystallized grains. Broken line: for subgrains.
38 39 40 41 42
280 300 320 340 360
σ0.2 / MPa
Kc
/ MPam
1/2
High Z (2)
Low Z Sub-grained
recystallized
Middle Z(2)
Fig. 7 Kc vs. ·0.2 plots of each specimen. The fracture toughness
Kc=36.6©NTR¹20.82, NTR: Notch tensile strength/Tensile yield
[image:5.595.53.284.67.293.2] [image:5.595.317.534.70.297.2]REFERENCES
1) Y. Baba and H. Yoshida:J. Jpn. Inst. Light Met.31(1981) 195.
2) N. Hosoda and M. Nakai: Proc. 104th Light Metal Conference, (2003) p. 145.
3) N. Hosoda and M. Nakai: Proc. 105th Light Metal Conference, (2003) p. 61.
4) N. Hosoda and M. Nakai: Proc. 106th Light Metal Conference, (2004) p. 97.
5) N. Hosoda, M. Nakai and T. Eto: ICAA-9, 1382, (2004).
6) O. Kosik, D. J. Abson and J. J. Jonas: J. Iron Steel Inst.209(1971) 624. 7) C. M. Young and O. D. Sherby: J. Iron Steel Inst.211(1973) 640. 8) S. Fujikawa: J. Jpn. Inst. Light Metal46(1996) 202.
9) K. Ito:J. Jpn. Inst. Light Metal43(1993) 285.
10) M. Nakai and T. Eto: Proc. 97th Light Metal Conference, (1999) p. 37. 11) C. J. Ball:Philos. Mag.2(1957) 1011.
12) J. R. Cotner and W. J. McG. Tegart: J. Inst. Metals97(1969) 73. 13) H. Asada and K. Yamamoto: Strength Group Committee of Aluminium