Factors Affecting Texture Memory Appearing through
!
!
Transformation in IF Steels
Naoki Yoshinaga
1, Hirofumi Inoue
2, Kouichi Kawasaki
3,
Leo Kestens
4and B. C. De Cooman
4;*1Steel Research Labs., Technical Development Bureau, Nippon Steel Corporation, Futtsu 293-8511, Japan
2Department of Materials Science, Graduate School of Engineering, Osaka Prefecture University, Sakai 599-8531, Japan
3Advanced Research and Technology Center, Niihama National College of Technology, Niihama 792-8580, Japan
4Department of Metallurgy and Materials Science, University of Ghent,
Technologiepark 9, BE-9052, Zwijnaarde (Gent), Belgium
In case where IF steel is heat treated in region,! and!transformation during heating and cooling,i.e.!!
transformation, take place during heating and cooling, respectively. The initial texture of is potentially weakened due to two times transformation in general. On the contrary, the !! transformed texture resembles the initial texture clearly under specific circumstances. Authors call this phenomenon ‘‘texture memory’’. A very distinct texture memory effect was found in IF steels. Lowering the
!transformation temperature pronounces texture memory significantly. The variant selection at grain boundary ofseems to play an important role. Moreover, it is considered that the initialtexture has to be sharp to in order to realize texture memory.
[doi:10.2320/matertrans.MA200704]
(Received February 13, 2007; Accepted April 3, 2007; Published July 25, 2007)
Keywords: texture memory,!!transformation, ferrite, austenite, recrystallization, ultra low carbon steel, Interstitial Free steel, cold rolled sheet steel, synchrotron radiation, high strength steel, variant selection, Kurdjumov-Sachs relationship
1. Introduction
It is well known that heat treatment in the single phase
region randomizes the h111i==ND texture through !
! transformation in deep-drawable cold-rolled sheet
steels.1,2) On the other hand, it has been observed that the
initialtexture hardly changes in microalloyed low-carbon
steels with a considerable amount of Mn such as 0.09
mass%C-0.62 mass%Mn-0.03 mass%Nb,3)0.1 mass%C-1.35
mass%Mn-0.03 mass%Nb4) and 0.19 mass%C-1.35 mass%
Mn-0.06 mass%Nb5)controlled-rolled sheet steels, in which
martensitic transformation took place during cooling. In these studies, the mechanism was not discussed. One of the present author6–8)has found that the initial recrystallization
texture is almost completely recovered even after!!
transformation in ultra low-carbon sheet steels without
need for a martensite-like transformation. This phenomenon
will be called texture memory,7,8) hereafter. Some factors,
which may affect texture memory, were investigated in order to understand its mechanism.
2. Experimental Procedure
2.1 Influence of Mn on !! transformation
texture formation
Vacuum melted ultra low carbon steels were used. The chemical compositions and processing conditions are listed in Table 1. Steel NT is a Nb and Ti added ultra low carbon mild steel. Steel MP contains Mn and P. The ingots were hot-rolled, heat treated for coiling simulation and cold-rolled.
After cold-rolling, the heat treatments, which are shown in Fig. 1, were performed. In order to complete recrystallization
before transformation, the heat treatment in ferrite region at
880C and 840C for 60 seconds were performed in steels NT
and MP, respectively. It was confirmed by dilatometry that
960C was the temperature of the single region for both
steels.7)Conventional X-ray diffraction method was used to
measure pole figures. In case where the!!
trans-formation texture resembles the recrystallization texture, the texture memory effect is considered to appear. The samples used for the texture measurement were taken from the quarter-plane of the thickness. Orientation distribution
functions (ODFs13)) were calculated from the {110}, {100},
{211} and {310} complete pole figures.
2.2 Measurement of austenite texture at high
temper-ature by synchrotron radiation
The high temperaturein-situtexture measurement in the
single phase region by synchrotron radiation (SR) was carried out at Photon Factory in National Laboratory for High Energy Physics in Japan. Using the advantage of the high brightness of SR, a method for rapid projection of crystal orientation distribution was developed.9–11)Figure 2 gives a
schematic drawing of the equipment used in this technique. The cold-rolled steels were mechanically and chemically polished to obtain a thickness of 0.15 mm. The quarter-plane of the thickness in the cold-rolled sheet was taken as a center of the specimen for SR measurement. The sample sheet was set on the sample stage of the diffractometer and a screen with an arc-shaped window was fixed behind the sample stage to detect a part of the {100} diffraction cones. An Imaging Plate (IP) was positioned behind the screen to project the crystal orientation distribution. The samples were heated to 960C at the rate of 2C/s and kept at 960C for 60
seconds in a furnace with a carbon heater. Argon gas was fed into the furnace to protect the sample against oxidation. The X-ray beam, which was monochromatized to a wavelength of
*Present address: Materials Design Laboratory, Graduate Institute for Ferrous Technology, Pohang University of Science and Technology
Special Issue on Crystallographic Orientation Distribution and Related Properties in Advanced Materials
0.06 nm, was focused on the sample. The IP was rotated with an angular velocity synchronized with the velocity of the sample rotation. The crystal grains were projected over an angle range of 52. The texture measurement started just after
the heat treatment at 960C for 60 seconds, mentioned above,
and then took 110 seconds at the same temperature.
2.3 Influence of!transformation temperature
The following attempt was made to confirm the influence
of the !transformation temperature on texture memory.
Vacuum-melted ingots of steels TB, NB1 and NB2 (Table 2), were hot-rolled and cold-rolled under the conditions listed in Table 3. The specimens were heated up to the temperatures
ranging fromto followed by cooling at the various rates
from 1 to 80C/s.
2.4 Influence of heating condition in austenite region
The industrially produced hot-rolled IF high strength steel with the chemical composition listed in Table 4, was used to investigate the influence of the heating temperature and time
in the phase region. For this purpose, cold-rolled sheets
were heat-treated at higher temperatures or for longer times, as indicated in Fig. 3.
2.5 Influence of externally applied elastic stress
The IF-260 material industrially hot-rolled and cold-rolled in a laboratory mill (Table 4) was used to investigate the
influence of an external elastic stress on the ! !
transformation texture formation. Figure 4 represents the
kinetics of the !transformation at 750C. After holding
for 60 seconds at 750C, the transformation progressed more
than 50%. Therefore, the nucleation of the !
trans-formation is thought to be almost completed, thus the transformation variant should already be selected after 60 s. Furthermore, it is important not to introduce significant
amount of plastic deformation to the transformed grains
since the texture ofcan be changed as a result. For these
[image:2.595.49.550.84.126.2]Fig. 2 Schematic illustration showing the equipment for texture measure-ment at high temperature using SR.
Table 2 Chemical compositions. (mass%)
Samples C Si Mn P S N Al Ti Nb B
[image:2.595.51.550.173.226.2]TB 0.0017 0.01 0.04 0.004 0.0049 0.0023 0.051 0.042 — 0.0032 NB1 0.0016 0.01 0.05 0.005 0.0049 0.0023 0.046 — 0.011 0.0031 NB2 0.0015 0.01 0.04 0.005 0.0048 0.0023 0.046 — 0.021 0.0031
Table 3 Hot-rolling and cold-rolling conditions. Sanples SRT,C FT,C CT,C CR, %
TB 1100 912 730 80 NB1 1100 906 730 80 NB2 1100 908 730 80
T°C, 60s
80°C/s
Figure 4 10°C/s
T°C, 60s
80°C/s 960°C, 60s
10°C/s
(a) (b)
Fig. 1 Heat treatment after cold-rolling. T: 880C for steel NT, 840C for
steel MP. (a) heat cycle for recrystallization, (b) heat cycle for
!!transformation.
Table 1 Chemical compositions and processing parameters.
C Si Mn P S N Al Ti Nb SRT,C FT,C CT,C CR, %
[image:2.595.305.549.258.434.2]NT 0.0021 0.04 0.10 0.007 0.0002 0.0013 0.040 0.009 0.010 1100 922 730 80 MP 0.0022 0.02 1.55 0.065 0.0036 0.0021 0.036 0.016 0.017 1200 908 630 80 SRT: Slab Reheating Temperature, FT: Finishing Temperature, CT: Coiling Temperature, CR: Cold-Rolling Reduction
Table 4 Chemical compositions of steels used (mass%) and processing parameters.
C Si Mn P S N Al Ti Nb B SRT,C FT,C CT,C CR, %
IF-260 0.0036 0.01 0.96 0.071 0.0038 0.0023 0.041 0.010 0.025 0.0010 1250 943 685 70
T, °C: 1000, 1050, 1100
10°C/s 10°C/s
T °C-60s
850°C-60s 10°C/s (a)
t, min : 10, 30, 60, 180
10°C/s 10°C/s
950 °C-t(min)
850°C-60s 10°C/s (b)
[image:2.595.70.269.397.498.2] [image:2.595.48.548.755.784.2]reasons, the experimental conditions were determined as described in Fig. 5. The stress level was changed from the
elastic to the plastic region, i.e. in the range from 25 to
100 MPa, the temperature was 750C and the time for which
the stress was applied was 60 s.
3. Experimental Results
3.1 Influence of Mn on recrystallization and!!
transformation textures
The textures obtained after recrystallization and!!
transformation in steels NT and MP are shown in Figs. 6
and 7, respectively. It is clear that the h111i==ND fiber is
sharply developed in both steels. In steel NT, however, the
texture is weakened remarkably after the ! !
transformation. On the other hand, the !!
trans-formation texture is very similar to the recrystallization
texture in steel MP, although the intensity of thef100gh011i
component increases slightly. In other words, the
recrystal-lization texture is memorized even after the ! !
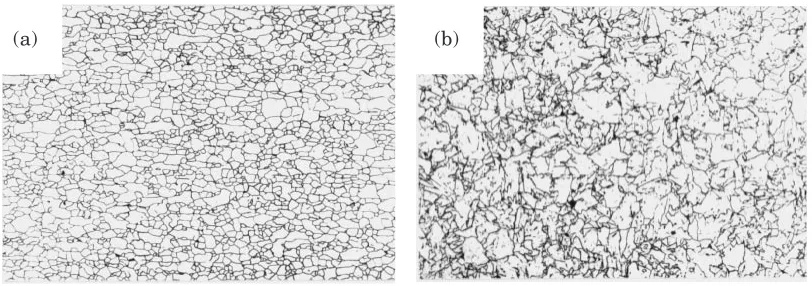
transformation in steel MP, which is a Mn-added steel. It is worth mentioning that the microstructure of steel MP after
the! !transformation is significantly different from
the recrystallization microstructure (Figs. 8 and 9).
3.2 Texture ofat high temperature measured by SR
In order to clarify the mechanism of texture memory
mentioned above, the high temperature in-situ texture
measurement in the single region was carried out by
means of SR X-ray diffraction. After the background was subtracted, the intensity was normalized under the assump-tion that the average intensity of the whole area is 1.0. An absorption correction was also made. Comparison between
the texture of steel NT and that of steel MP reveals no
essential differences, as seen in Fig. 10.
10°C/s
950 °C-60s 850°C-60s
10°C/s
750°C-180s
10°C/s
0.0 0.2 0.4 0.6 0.8 1.0
1 10 100 1000
Fraction transformed
Time at 750°C, t/s
Fig. 4 Isothermal!transformation kinetics at 750C.
Unload after 60s
10°C/s
10°C/s 950°C-60s
850°C-60s
Load stress at 750 °C σ: 25~100MPa Strain rate : 3×10⁻³ /s
10°C/s 750°C-60s
Fig. 5 Experimental conditions to examine the effect of external stress applied during!isothermal transformation on!! trans-formation texture trans-formation in IF-260.
0 90
90 0
16
0 90
90 0
6
(a) (b)
PHI2= 45 PHI2= 45
Fig. 6 Recrystallization texture (a) and!!transformation tex-ture (b) (’2¼45section) in steels NT.
0 90
90 0
14 14
0 90
90 0
14
(a) (b)
PHI2= 45 PHI2= 45
Fig. 7 Recrystallization texture (a) and!!transformation tex-ture (b) (’2¼45section) in steels MP.
(a) (b)
[image:3.595.48.294.74.167.2] [image:3.595.308.545.76.195.2] [image:3.595.69.267.214.298.2] [image:3.595.310.545.250.368.2] [image:3.595.98.502.627.770.2]3.3 Influence of !transformation temperature on texture memory
The !transformation temperature of the cold-rolled
sheet, whose chemical compositions are listed in Tables 1 and 2, were measured by dilatometry. The factor R in equation (1), which represents the appearance of the texture memory, was calculated and plotted in Fig. 11. The
param-eter R is defined by equation (1). It means that texture
memory appears more significantly, when theRis closer to 1.
It is clear from Fig. 11 the texture memory appears when Ar3
transformation temperature is below around 800C.
R¼I1=I0 ð1Þ
I0: Integrated intensity of orientations 28, 35 and 36 (Fig. 12)
in the recrystallization texture.
I1: Integrated intensity of orientations 28, 35 and 36 (Fig. 12)
in the!!transformation texture.
In order to assess the effect of the !transformation
temperature more critically, the following test was
conduct-ed. Steel NT was water-quenched after holding at 930C
where it is in the single phase range. The texture memory
occurs even in steel NT if a sufficiently rapid cooling rate,
which results in the lowering of the !transformation
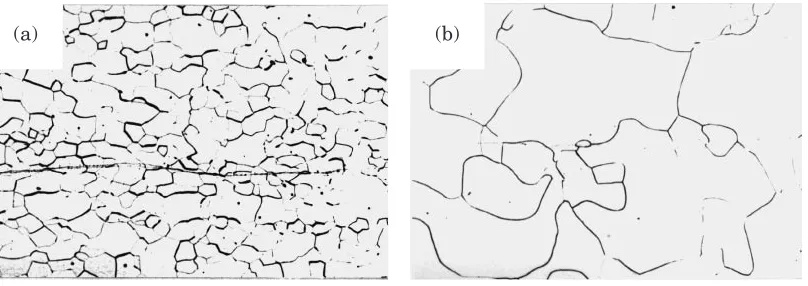
[image:4.595.96.502.72.215.2]temperature, is used. This effect can be clearly seen in Fig. 13. It should be noted that the microstructure is still polygonal even though water quenching is carried out and the grain size is smaller compared to the specimen cooled at 80C/s.
3.4 Influence of heating temperature and time in the
austenite region
Figure 14 represents the influence of holding temperature
and time in the range. It is obvious from Fig. 14 that the
recrystallization texture formed at 850C is weakened as the
heating temperature and the holding time increase. This
result is different from the results obtained by Hutchinsonet
al.12) There are a couple of differences between their
experiment and the present one. Although they used a similar
chemical composition, their Ti content was much higher,i.e.
Fe-0.003 mass%C-0.002 mass%N-1.2 mass%Mn-0.07 mass%
Ti. Moreover, their austenization temperature was 925C
whereas it was 950C or higher in the present study. The
(a) (b)
Fig. 9 Microstructures after recrystallization texture (a) and!!transformation texture (b) (’2¼45section) in steels MP.
RD
TD RD
TD
[image:4.595.339.509.257.387.2](a) (b)
Fig. 10 {100} pole figures ofmeasured by SR, (a) steel NT and (b) steel MP.
0 0.2 0.4 0.6 0.8 1 1.2 1.4
600 650 700 750 800 850 900
R
Steel TB Steel NB1 Steel NB2 Steel MP Steel NT
Ar3 temperature, °C
Fig. 11 Relationship between Ar3temperature and R (Recovery ratio, see eq. (1)).
1 3
2 4
5 6
10
9
8
7 15
14
13
12
11 16
17 18 19 20 21
22 23 24 25 26 27 28
36
35
34
33
32
31
30
29 111
101 001
[image:4.595.48.287.258.375.2] [image:4.595.100.239.429.577.2]chemical composition and the temperature could directly correlate to the grain growth behavior or stress and strain
condition in region. It is speculated, therefore, that these
difference could bring about the different observations.
3.5 Influence of external elastic stress
The ! !transformation textures when the
exter-nal stresses are applied during the isothermal transformation
at 750C are shown in Fig. 15. The yield strength of at
750C in IF-260 is approximately 75 MPa. Therefore, the
textures shown in Fig. 15(a), (b) and (c) are formed under the influence of elastic stress. The results of Fig. 15 therefore prove that the external stress does not have significant effect
on the formation of a!!transformation texture.
4. Discussion
4.1 Characteristics of thetexture
A prediction of the phase texture was made using the
ODF13) to understand the measured texture shown in
Fig. 10. In this calculation the measured recrystallization
textures shown in Figs. 6 and 7 were used as initial textures.
The K-S relationship14,15)without variant selection was used
to convert the recrystallization textures to textures. It is
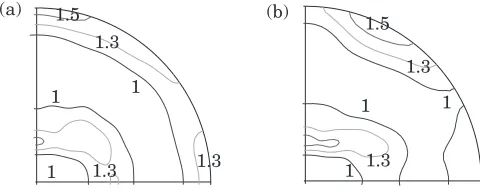
obvious from the calculated results in Fig. 16 that there is a
very good agreement between the measuredtextures shown
in Fig. 10 and the simulated ones. Therefore, it can be
concluded thattextures of both steels are formed by!
transformation based on K-S relationship without any
[image:5.595.111.484.73.195.2](a) (b) (c)
Fig. 13 Influence of cooling rate after soaking in the singleregion (930C–60 s) on!!transformation texture of steel NT
(Table 1). {100} pole figures. (a) recrystallization texture, (b) cooled at 80C/s from 930C, (c) water quenched from 930C.
1
0 90
90 0
1 1
2
4
4
(a) 0 90
90 0
5 5
1
1 1
2 1
(b) 0 90
90 0
1 1 2
2
1 1
(c) 0 90
90 0
1 1
2
1
2 1 1 (d)
[image:5.595.111.486.243.336.2]PHI2= 45 PHI2= 45 PHI2= 45 PHI2= 45
Fig. 14 Changes in!!transformation texture in IF-260 (Table 4) with changes in holding temperature and time inregion. a: 850C–60 s, b: 950C–60 s, c: 950C–180 min., d: 1100C–60 s.
0 90
90 0
(a) 0 90
90 0
(b) 0 90
90 0
(c) 0 90
90 0
(d)
[image:5.595.111.486.383.473.2]PHI2= 45 PHI2= 45 PHI2= 45 PHI2= 45
Fig. 15 Effect of the external tensile stress applied during the ! isothermal transformation at 750C on the !!
transformation texture in IF-260. (a) 25 MPa, (b) 50 MPa, (c) 75 MPa and (d) 100 MPa. Yield strength ofat 750C is around 75 MPa in
this material. Contour levels: 1 - 2 - 3 - 4 - 5 - 6 - 7 - 8.
1.3 1
1 1.3
1.5
1 1.3 (a)
1
1 1.3
1.5
1 1.3 (b)
[image:5.595.306.546.540.637.2]specific variant selections. In the textures, theh110i==ND
fiber whose main component isf110gh113iis observed. This
h110i==ND fiber is considered to originate from theh111i==
ND fiber in therecrystallization texture.
4.2 Possible mechanisms for texture memory
The following experimental facts were obtained: a) Mn addition enhances the texture memory effect,
b) if a sufficiently rapid cooling rate is applied during !
transformation, the texture memory takes place even in a steel without Mn,
c) the texture of in Mn alloyed steel is not different from
that in the steel without Mn,
d) the texture of is quite weak, which can be predicted by
converting the initial recrystallization texture according to the K-S relationship without variant selection,
e) the ! transformation temperature has a dominant
effect on the texture memory, i.e. when the !
trans-formation temperature is lower than approximately 800C,
the texture memory is always observed regardless of chemi-cal composition,
f) holding at a higher temperature and a longer period in
region suppresses the texture memory and
g) an external elastic tensile stress does not influence on the texture memory significantly.
From the results c) and d), the texture memory is considered to arise from a specific variant selection mechanism during
! transformation. The results a) and b) can be
considered equivalent to the observation e). Therefore, the model for the texture memory has to be developed for the
variant selection during!transformation. Moreover, it
has to be consistent with the observations e), f) and g).
Numerous models for the formation of !
trans-formation texture have been proposed so far.2,15–23)Since the
texture in the present study is very weak as shown in
Fig. 10, the model is required to deal with the behavior of
!!transformations of individual grains or colony
of grains in order to predict the distinct texture after
transformation. From this aspect the conventional models which required either a macroscopic deformation such as rolling and tensile strain15,16,18,19)or a cleartexture prior to
the transformation20,22) cannot be applicable. The model,
which is only useful for the martensitic transformation
related phenomenon17)should be also ruled out because the
texture memory effect is observed in the material in which the martensitic transformation is not involved. Surface effect
related model2) cannot be applied either as the texture
memory occurs in the bulk. As a consequence, the conven-tional models applicable to the texture memory effect could be the followings:
1) the grain boundary model,21,24–26)
2) the internal stress based model.6–8)
The likelihood of 2) above mentioned has been already
discussed in the previous papers.6–8) However, if the stress
might play a potential role in texture memory the external stress also has to influence on it. Nevertheless, the exper-imental result g) above mentioned clearly shows this is not
the case. Therefore, hereafter, the model 1), i.e. the grain
boundary model, will be discussed.
The grain boundaries could play a role since the grain
boundaries are commonly recognized as one of the most potential nucleation site. Ameyamaet al.21,24)and Hakata25)
have investigated the variant selection according to the grain boundary characteristics precisely.
The essence of their variant selection model is the
following. Considering the grain nucleates at the grain
boundary between two ferrite grains, i.e. A andB, there
are in principle 48 variants which the grain may choose
from since for eachgrain 24 variants can occur. The first
principle which grain must obey is that the {111} plane of
the new grain satisfies the K-S relationship with one of the
{110} planes of A orB which has smallest angle to the
grain boundary plane. The new grain selects one of twelve
{110} planes ofA orB so that only 4 variants out of the 48
variants are possible. The second principle which is to be
taken into account is the orientation relationship between
andA in the case that a {111} plane of obeys the first
condition with respect to the B grain. Among 4 possible
variants, the one which results in the smallest angle between
the {111} plane of thegrain and the {110} plane ofA is
selected. If there is the variant of which can satisfy K-S
relationship with both A and B grains it is natural to
consider this grain has to precipitate most likely. In fact,
Ameyama and Maki27) have clearly observed in duplex
stainless steel.
Considering the ! ! transformation in general,
the crystal orientation of grain A is not equal to that of grain B in Fig. 17. Therefore, there is no specific orientation
relationship between grains a and b of , generally. In this
case there is no need that the orientation of A0, nucleus of
ferrite, coincides with that of grain A or B. On the contrary, when the orientation of grain A is very similar to that of grain
B,i.e.a rather small angle grain boundary exists between the
grains A and B, the grains a and b have ones of the 24 K-S variants of orientation of grain A (or B). This situation can be
realized when therecrystallization texture is significantly
sharp. In this specific case, the grain A0 has common K-S
variant for the grain a and the grain b. Namely this is the B
A
a b
Rex- α
→
α γ
→α
[image:6.595.338.512.72.268.2]γ a A’ b
Fig. 17 Schematic drawing of microstructure change through!!
transformation. Thegrains ‘‘a’’ and ‘‘b’’ have ones of the K-S variants of
grains ‘‘A’’ and ‘‘B’’, respectively. A0 indicates the nucleus of
orientation of grain A (or B). This way the texture memory can appear. It can be therefore concluded that the distinct
texture memory after!!transformation can appear
only when initialhas a significantly sharp texture.
Next, the consistency of this mechanism with respect to the experimental results e), f) and g) mentioned above will be
checked. When the ! transformation temperature
decreases the interfacial energy due to generation ofnuclei
must increase, since atomistic accommodation by diffusion becomes difficult to occur at the interface. K-S relationship
must be obeyed more critically in case where the !
transformation temperature becomes lower in order to minimize the interfacial energy. Therefore, it is considered that the texture memory can be more pronounced, when the transformation temperature decreases.
The increase in holding temperature and time in region
can lead to grain growth. Therefore the orientation relation-ship between the adjacent 2 grains can change. At such newly formed grain boundaries, the variant selection rule at the grain boundary mentioned above cannot hold in most cases. In this manner, the texture memory tend not to appear clearly
in case that the holding temperature and time in region.
Since the orientation relationship between the 2 grains
does not seem to change due to the externally applied elastic stress the variant selection rule at grain boundary can still hold. Therefore, the texture memory can appear even when
the macroscopic stress is applied during !
transforma-tion.
Thus, the mechanism for the texture memory proposed above is considered to be consistent to the experimental results e), f) and g).
5. Conclusion
The texture memory effect, whereby the recrystallization
texture is completely recovered after an!!
trans-formation, was found to occur in ultra low carbon cold rolled sheet steels. Systematic investigations were carried out in order to reveal the mechanism of the texture memory. The following experimental facts were obtained.
(1) Mn addition enhances the texture memory effect. (2) If a sufficiently rapid cooling rate is applied during
!transformation, the texture memory takes place
even in the steel without Mn.
(3) Thetextures at high temperature were measured using
synchrotron radiation. The texture of in Mn alloyed
steel is not different from that in steel without Mn.
(4) The texture of is quite weak, which can be predicted
by converting the initial recrystallization texture ac-cording to K-S relationship without variant selection.
(5) The!transformation temperature has a significant
effect on the texture memory, i.e. when the !
transformation temperature is lower than approximately
800C, the texture memory is always observed
regard-less of chemical composition.
(6) Holding at a higher temperature and a longer time in the
region suppress the texture memory.
(7) The external elastic tensile stress does not influence on the texture memory significantly.
The texture memory arises clearly from a specific variant
selection mechanism occurring during the !
trans-formation. The variant selection at grain boundaries is
considered to play an essential role in texture memory. When the initial texture is very sharp the probability, which the K-S
variant of common to both grains at grain boundary
exists, is considered to increase. This variant should coincide
with the main orientation of the sharply developed initial
texture. The influence of the initial texture should be investigated in detail in the future.
Acknowledgments
We are grateful to Prof. T. Maki in Kyoto University for his useful comments on the present work. Thanks are also extended to Dr. M. Takahashi for his helpful advice.
REFERENCES
1) R. M. S. B. Horta, D. V. Willson and W. T. Roberts: J. Iron and Steel Inst.210(1972) 42.
2) O. Hashimoto, S. Satoh and T. Tanaka: Tetsu-to-Hagane66(1980) 102. 3) U. Lotter and L. Meyer: Met. Technology4(1977) 27.
4) H. Inagaki: Trans. ISIJ23(1983) 1059.
5) R. Schofield, G. Rowntree, N. V. Sarma and R. T. Weiner: Met. Technology4(1974) 325.
6) N. Yoshinaga, K. Ushioda, A. Itami and O. Akisue: ISIJ Int.34(1994) 33.
7) N. Yoshinaga, K. Ushioda and O. Akisue: High-Strength Sheet Steels for the Automotive Industry, (36th MWSP Conf., ISS, Baltimore, 1994) 149.
8) N. Yoshinaga, K. Kawasaki, H. Inoue, B. C. De Cooman and J. Dilewijns: Modern LC and ULC Sheet Steels for Cold Forming: Processing and Properties, (Aachen, 1998) 569.
9) K. Kawasaki, H. Iwasaki, H. Kawata and K. Nose: Rev. Sci. Instrum.
63(1992) 1110.
10) K. Kawasaki and H. Iwasaki: J. Synchrotron Radiation2(1995) 49. 11) K. Kawasaki, H. Iwasaki and N. Yoshinaga: Rev. Sci. Instrum.66
(1995) 1404.
12) B. Hutchinson, L. Ryde and D. Artymowicz: Modern LC and ULC Sheet Steels for Cold Forming: Processing and Properties, (Aachen, 1998) 203.
13) H. J. Bunge: Texture Analysis in Materials Science, (Butterworths, London, 1982) 188.
14) G. Kurdjumov and G. Sachs: Z. Phys.64(1930) 325.
15) H. Kubotera, K. Nakaoka and T. Nagamine: Tetsu-to-Hagane52(1966) 1171.
16) J. C. Bokros and E. R. Parker: Acta Metall.11(1963) 1291. 17) Y. Higo, F. Lecroisey and T. Mori: Acta Metall.22(1974) 313. 18) E. Furubayashi, H. Miyaji and M. Nobuki: Trans. ISIJ27(1987) 513. 19) M. P. Butro´n-Guille´n, C. S. D. C. Viana and J. J. Jonas:Texture and Anisotropy of Poly Crystalline Materials, (Clausthal, Germany, 1997) 151.
20) B. Hutchinson, L. Ryde, E. Lindh and K. Tagashira: Materials Science and Engineering A257(1998) 9.
21) K. Ameyama, T. Maki and I. Tamura: J. Japan Inst. Metals50(1986) 602.
22) M. Humbert, F. Wagner, W. P. Liu, C. Esling and H. J. Bunge: Textures of Materials, (8th ICOTOM Conf., AIME, Warrendale, PA, 1988) 743. 23) J. W. Glen and S. F. Pugh: Acta Metall.2(1954) 520.
24) K. Ameyama, M. Minagawa, T. Maki and I. Tamura: Tetsu-to-Hagane
74(1988) 139.
25) K. Hakata: Master Thesis, Materials Science and Engineering, Kyoto University, (1997).
26) G. Bru¨ckner and G. Gottstein: ISIJ Int.41(2001) 468.