Ultrasonic Testing Method for Detection of Planar Flaws in Graphite Material
*1Eiichi Sato
1;*2, Mitsuharu Shiwa
2, Yoshio Shinagawa
3, Takashi Ida
3,
Satoshi Yamazoe
4and Akiyoushi Sato
41
Institute of Space and Astronautical Science, Japan Aerospace Exploration Agency, (ISAS/JAXA), Sagamihara 229-8510, Japan
2NDE Center, Japan Power Engineering and Inspection Corp., Yokohama 230-0044, Japan 3GNES Co., Ltd., Seika 619-0237, Japan
4IHI AeroSpace Co., Ltd., Tomioka 370-2398, Japan
An ultrasonic inspection method for a graphite ingot was developed to detect internal planar flaws that are oriented in various directions; this method is necessary to perform quality assurance of throat inserts of solid rocket motors. Major problems that are unique to this graphite inspection were solved. An ultrasonic beam in graphite shows uneven propagation behavior both within and among individual ingots. That individual unevenness engenders variation in echo heights of flat-bottomed holes, which can be compensated through two-dimensional scanning accompanying a change in incident angles of two directions. This scanning procedure is therefore necessary to detect internal planar flaws that orient in various directions. The unevenness among ingots can be compensated by measuring the wave velocity and attenuation coefficient in the test block itself before inspection. A test block including artificial internal flaws was fabricated and inspected using the developed method. It was then sliced into several thin disks. The sliced disks were inspected using the conventional ultrasonic testing method using a normal beam technique. The two methods detected identical flaws, thereby validating the developed method. The technique described here has been enacted as JIS Z 2356 under the title, ‘‘Method of automatic ultrasonic inspection for graphite ingot’’. [doi:10.2320/matertrans.I-MRA2007851]
(Received June 15, 2006; Accepted March 6, 2007; Published May 25, 2007)
Keywords: aerospace engineering, solid rocket motor, graphite, non-destructive inspection, ultrasonic testing, internal planar flaw
1. Introduction
On 10 February 2000, the Institute of Space and Astronautical Science (ISAS, now, Institute of Space and Astronautical Science, Japan Aerospace Exploration Agen-cy) launched the M-V-4 rocket, which failed to put a satellite into orbit because of the fracture of a graphite nozzle throat
insert of the first-stage rocket motor.1)A survey of causes
clarified, through re-evaluation of thermal input to the nozzle throat insert and strength analysis based on fracture statistics, that the probability of fracture of a sound graphite nozzle throat insert was extremely small during the initial 4 s after lift-off, when the first fracture phenomenon occurred. It was concluded that the most likely cause of fracture was an intrinsic flaw within the material or a surface flaw imparted
during processing or assembly.1)
After this launch failure, a study to develop non-destruc-tive inspection of graphite nozzle throat inserts was initiated with the intention of using them for the S-310 sounding
rocket of ISAS2,3)because graphite nozzle throat inserts, for
which brittle materials are used under heavy load, are essential to secure the rocket systems’ reliability. Detailed load estimation and strength analyses revealed that cracks larger than 3 mm diameter and oriented in various directions should be eliminated. The Japan Atomic Energy Research Institute has studied ultrasonic testing of graphite material for use in the core structure of the High Temperature
Engineer-ing Test Reactor (HTTR).4–6)This testing was undertaken to
detect 5 mm or larger diameter cracks in axial and radial directions in cylindrical test blocks. Recently, similar testing
to detect tiny defects in titanium billets for aircraft
applica-tion was studied.7,8)Nevertheless, no testing to detect
3-mm-diameter cracks orienting in various directions in graphite material has been reported so far.
The following procedure was established for quality assurance of a graphite nozzle throat insert: First, internal flaw inspection (volumetric inspection) of the graphite ingot shall be executed before machining the ingot into the shape of nozzle throat insert; then surface flaw inspection after
machining shall be employed.2,9) Surface flaw inspection
shall be performed by eddy current testing. For volumetric inspection, radiographic testing (RT) and ultrasonic testing (UT) were studied. It was noticed that RT is unsuitable to detect planar flaws that orient in various directions in a thick ingot. It was therefore decided to develop a UT method to detect planar flaws that orient in various directions (all-directional flaw detection method).
Finally, a method of ultrasonic inspection for a graphite ingot was established and enacted sequentially as an ISAS
Standard,10) a Standard of the Japanese Society for
Non-Destructive Inspection (NDIS),11)and a Japanese Industrial
Standard (JIS).16)This paper summarizes technical aspects of
this inspection method. In section 2, we discuss ultrasonic propagation characteristics in graphite. The ultrasonic de-tection principle of reflectors oriented in various directions is addressed in section 3. Then we show the inspection results of actual test blocks in section 4.
2. Ultrasonic Wave Propagation Characteristics in Graphite
2.1 Materials and experimental apparatus
The graphite material used in this study is the one presently used in the nozzle throat insert of the S-310 sounding rocket; *1This Paper was Originally Published in Japanese in JOURNAL OF
JSNDI55(2006) 483–491.
*2Corresponding author, E-mail: [email protected]
it is called isostatic graphite because it is formed into an ingot by isostatic pressing and has smaller anisotropy than other artificial graphite. Table 1 presents its mechanical
properties.12)Graphite is a porous material and gives larger
property fluctuation among ingots than that of metal ingots. In addition, ultrasonic propagation behavior in graphite is not
as simple as that in metals.4–6)
This study uses immersion testing with a single probe, pulse echo technique. An ultrasonic flaw detector (USD 15; Krautkramer GmbH & Co.) was used. Three types of ceramics-polymer composite, immersion probe were exam-ined and mutually compared: 1K25.4I (non-focused probe having 1 MHz nominal frequency and 25.4 mm diameter), 2.25K25.4I (non-focused probe having 2.25 MHz nominal frequency and 25.4 mm diameter) and 2.25K25.4IPF152.4 (focused probe having 152.4 mm focus depth and 2.25 MHz nominal frequency and 25.4 mm diameter).
The graphite test block surfaces were machined to a
roughness of Ra 3.2mmor smoother and were then thinly
coated with an epoxy resin (Epico No. 2000; NOF Corp.) for
waterproofing to a thickness of about 10mm(so-called
epoxy-coating).
2.2 Results and discussion 2.2.1 Selection of probe
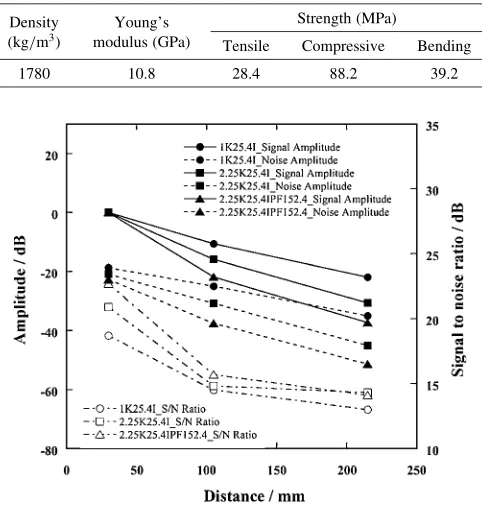
Figure 1 shows distance-amplitude curves for flat-bot-tomed holes of 2 mm diameter, the corresponding noise, and their signal to noise ratios measured by the three probes. Here the flaw echo heights of the 25 mm beam path are adjusted to 0 dB.
The echo heights of long beam paths are in the order
of 1K25.4I>2.25K25.4I>2.25K25.4IPF152.4, but the
S/N ratios of long beam paths are differently ordered as
2.25K25.4I>2.25K25.4IPF152.4>1K25.4I. For that
rea-son, probe 2.25K25.4I was selected as the probe that offers both high sensitivity and a high S/N ratio, with better resolution. This probe was used in all tests conducted in this study. The FFT analysis of echoes indicated that the center frequency was reduced to less than 1.7 MHz if the beam path was longer than 10 mm in the test block.
2.2.2 Water absorption
Figure 2 shows C-scan displays of (a) the surface echo from a test block without epoxy coating, (b) the surface echo from a test block with epoxy coating and (c) the bottom echo from a test block with epoxy coating. The block without epoxy coating gave the same surface echoes as the epoxy-coated block during the initial immersion period, but after some elapsed time it started to show variation of surface echo heights depending on the location. On the other hand, the epoxy-coated block maintained even surface-echo heights regardless of immersion time. However, the two blocks show variation by location of the bottom echo heights, showing an expanded stripe pattern (Fig. 2(c)), which represents fluctua-tion of apparent attenuafluctua-tion characteristics.
[image:2.595.49.290.93.347.2]2.2.3 Anisotropy in wave velocity
Figure 3 shows the relationship between the echo height of 2-mm-diameter flat-bottomed holes of normal incidence and wave velocity in the machined cuboidal blocks of 45– 402 mm thickness. Here, the ultrasonic propagation direction is arranged in three independent orthogonal directions: A, B and C. Direction A is the vertical direction during ingot production; directions B and C are horizontal directions that are orthogonal to each other. The wave velocity is calculated from the beam path and the propagation time. No correlation was found between the echo height and the velocity in any direction of A, B and C, but the data spread to a certain degree. The velocities in B or C varied from 2510 to 2580 m/ s, whereas those scattered more in A: 2400–2510 m/s. This fact suggests the creation of only slight anisotropy between vertical (gravity) and horizontal directions during the ingot production process.
2.2.4 Apparent attenuation characteristics (local fluctu-ation of echo height)
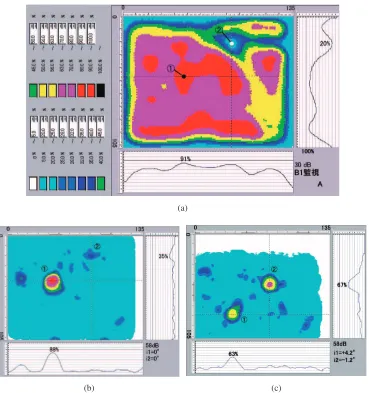
In the C-scan display of the bottom echo in Fig. 2(c), we observe an expanded strip pattern, which represents fluctua-tion of apparent attenuafluctua-tion characteristics. A test block of 120 mm thickness was prepared to investigate the cause of this fluctuation. Figure 4(a) shows a C-scan display of the bottom echo of normal incidence. The maximum and minimum echo heights were 91% and 20%, respectively,
indicating that the apparent attenuation differed in a 1 : 4:6
ratio, depending on location.
A 2-mm-diameter flat-bottomed hole was drilled at the 91% spot, (1) and the 20% spot (2). The maximum echo height was sought and obtained for each flat-bottomed hole by changing incident angles of two independent directions
(i1, i2) accompanied by two-dimensional scanning at each
angle setting.
Figure 4(b) shows that the maximum echo height of 88% was obtained from the flat-bottomed hole (1) at incident
angles of i1¼0 andi2 ¼0 (vertical incidence). Another
echo height of 35% was obtained from hole (2) at the same vertical angle. On the other hand, the maximum echo height
Table 1 Mechanical properties of isotropic graphite shown in a manufac-turer’s catalogue.12Þ
Density Young’s Strength (MPa) (kg/m3) modulus (GPa)
Tensile Compressive Bending
1780 10.8 28.4 88.2 39.2
(a) (b) (c)
Fig. 2 C-scan displays of (a) surface echo from a test block without epoxy coating, (b) surface echo from a test block with epoxy coating, and (c) bottom echo from a test block with epoxy coating.
(b) (c)
(a)
[image:3.595.112.485.73.316.2] [image:3.595.115.484.364.757.2]of 67% was obtained for the hole (2) at the angles of i1¼ þ4:2andi
2¼ 1:2, as shown in Fig. 4(c). At these angles,
the echo height of the hole (1) was 63%. Similar tests were conducted on several specimens that had been cut from ingots in different production lots. Results indicate that the echo height fluctuation of flat-bottomed holes was less than 3 dB
by swiveling the incident angles within4.
Microstructural observations using a polarizing micro-scope revealed dispersions of small grains of graphite crystals in some locations of a graphite sample. Those
grains’c-axes were oriented in one direction.13)Visualization
of ultrasonic propagation behavior in a different graphite sample showed that the maximum amplitude position in the
wave front drifts sideways.13)Thec-axis of graphite crystal
shows different elastic modulus than other axes, which engenders the difference in wave velocity. Therefore, we concluded that the fluctuation of apparent attenuation is attributable to interference of waves at the reflection surface
according to the local fluctuation of wave velocity.13)
To obtain the maximum echo height of a planar flaw in graphite, compensation for fluctuation of apparent attenu-ation characteristics is necessary; it is carried out by changing
incident angles of two independent directions (i1,i2) within
4, accompanied by two-dimensional scanning at each
incident angle setting. This procedure is designated as
two-axis swivel scanningin JIS Z 2356.16)
3. Development of a Detection Method for All-Direc-tional Planar Flaws
For practical internal-flaw detection, a cylindrical block is treated as a test object because the nozzle throat inserts are machined from cylindrical blocks of graphite. Here, it is necessary to detect all planar flaws without missing any of their directions, taking account of the local fluctuation of echo height discussed in section 2.2 4). Achieving this, we employ a procedure comprising two-axis incident-angle scanning and two-dimensional scanning to catch the max-imum echo height of planar flaws in various directions, using an ultrasonic beam that enters the test block both from the top and bottom surfaces and from the side-wall surface. To determine measurement conditions, we discuss the following factors in this section:
1) Distance-amplitude compensation for various incident angles (section 3.2)
2) Pitches of two-dimensional scanning and incident-angle change (section 3.3)
3) Echo-height dependency of various-sized disk-type reflector on the incident angle (section 3.4)
4) Determination of working sensitivity (section 3.5)
3.1 Flaw inspection of cylindrical test block
Figure 5 shows (a) a block diagram of ultrasonic testing equipment, and scanning diagrams of two scanning methods,
(b) R-X scanning, and (c)R-Z scanning. The testing
equip-ment itself is a common apparatus for a single-probe, pulse-echo immersion method. In this study, USD 15 was used as an ultrasonic flaw detector, and 2.25K25.4I was used as a probe.
Fig. 3 Relationship between echo height of 2-mm-diameter flat-bottomed holes and wave velocity in three directions: A, B and C.
(a)
(c) (b)
Rotation, R
Incident angle, i1
Water
Water path Probe
Z Y
X Water
Probe
Transverse, X
Swivel, i2
Offset,off
Probe
Water
Incident angle, i1
Water path
Rotation, R
Water
Transverse, Z
Z Y
X
Probe
Probe
Test block Scanner
Water tank 6 axes (X, Y, Z, i1, i2, R)
Controller C−scope display Ultrasonic
pulser/receiver
[image:4.595.65.271.64.217.2] [image:4.595.325.527.71.531.2]R-X scanning is applied when an ultrasonic beam enters the test block from the top and bottom surfaces, over which
the probe traverses along the X-axis as the block is rotated.
The incident anglei1 is changed gradually so that the beam
angle (angle of refraction) in the test block becomes 0 to
+60. Similarly, the rotation angle of the projected beam axis
i2 is changed gradually from 0 to 360. When an ultrasonic
beam enters the test block from the side-wall curved surface,
R-Zscanning is applied: the probe traverses along theZ-axis
as the block is rotated. The incident angle i1 is changed
gradually so that the beam angle becomes60to +60. The
offsetoffis changed gradually so that the angles of refraction
in the test block become60to +60. The pitches of
two-dimensional scanning (probe traverse and block rotation) and incident-angle change are determined based on the measure-ment discussed in section 3.3. The echo height data obtained by the ultrasonic pulser/receiver are exhibited in a C-scan display on the control/display equipment. The water path is set to 165 mm.
For R-X scanning of flat-surface incidence, six cuboidal
reference blocks with 3-mm-diameter flat-bottomed holes were prepared corresponding to STB-G type calibration block specified in JIS Z 2345:2001; they covered the beam
path range of 10 mm to 215 mm. ForR-Zscanning of
curved-surface incidence, two cylindrical reference blocks of 225 mm diameter were prepared with 2-mm-diameter, 40-mm-deep side-drilled holes.
3.2 Distance-amplitude characteristics at various inci-dent angles
Figure 6 shows a distance-amplitude curve for 3-mm-diameter flat-bottomed holes of flat-surface normal incidence (0 FBH) and curves for 2-mm side-drilled holes of
curved-surface incidence and various incident angles (0—
34.3 SDH). The numerical notations of 0 to 34.3 indicate the angles of incidence in degrees. The literal notations FBH and SDH respectively indicate the reflectors: a 3-mm-diameter flat-bottomed hole and a 2-mm-3-mm-diameter side-drilled hole. To obtain the maximum echo height, the flat-bottomed holes are detected using two-axis swivel scanning. The side-drilled holes are detected using linear scanning in the hole-axis direction.
Because Fig. 6 indicates a large attenuation of30dB at
the 250 mm beam path for flat-bottomed holes of normal incidence, the flaw detector is required to have a distance-amplitude compensation capability that is larger than 30 dB. In distance-amplitude characteristics of various incident
angle, there was no great difference up to 20 of incident
angle, but a substantial drop of echo height was apparent at
28.6 and 34.3 because a larger incident angle engenders
less transmittance of sound pressure and a smaller apparent dimension of transducer. The resultant wider beam spread brings larger sound-pressure drop. Consequently, results show that respective distance-amplitude compensations are necessary for varying an incident angle.
3.3 Determination of the pitch of incident-angle change Pitches of two-dimensional scanning (probe traverse and block rotation) and incident-angle change are determined based on the measured echo-height dependences on both a
traverse distance and incident angle of flat-bottomed holes. This section presents detailed discussion of the measurement of the incident-angle dependence of echo height, which is unique for this flaw detection method.
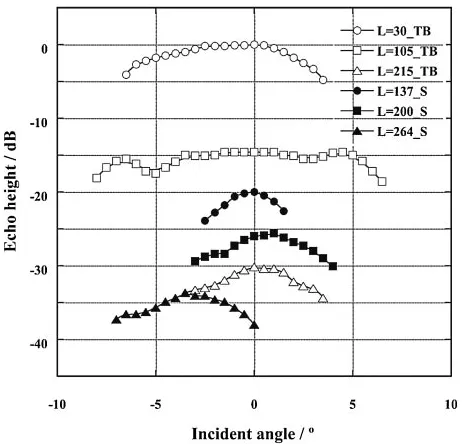
Figure 7 shows echo-height profiles of 3-mm-diameter
flat-bottomed holes for various incident angles (i1 in
Fig. 5(b)) in case of top/bottom-surface incidence. Figure 7 also shows profiles of 2-mm-diameter side-drilled holes for various incident angles (calculated from the offset distance
off in Fig. 5(c)) for side-surface incidence. The numerical
notations of 30–264 indicate beam paths in millimeters. The literal notations TB and S respectively indicate top/bottom-surface (flat-top/bottom-surface) incidence and side-top/bottom-surface (curved-surface) incidence. The echo-height dependence is evaluated by finding the incident-angle range within which the attenuation is less than the specified level (3 dB).
The obtained incident-angle range is smaller for side-surface incidence than for top/bottom-side-surface incidence. It is attributed to a lens effect of a curved incident surface in the case of side-surface incidence. The obtained incident-angle range also shows fluctuation depending on beam paths, though in far field in homogeneous material, the beam spread should be constant independently from beam paths; it is attributed to a local variation of echo height mentioned in section 2.2 4). Therefore the minimum value among the obtained ranges of each surface incidence is employed to determine the pitch of the incident-angle change.
Table 2 shows the incident-angle ranges within which the attenuation of echo height is less than 3 dB, of both top/ bottom-surface incidence and side-surface incidence for various beam paths. The minimum values among various
beam paths are 8 and 3.5, respectively, for
top/bottom-surface incidence and side-top/bottom-surface incidence. Table 2 also shows the incident-angle ranges within which the attenuation of echo height is less than 1 dB, among which the minimum
values for the two incident surfaces are 3.0and 1.5.
[image:5.595.311.541.70.280.2]3.4 Echo-height dependence on incident angle from tilted disk-type flaw
In section 3.3, we obtained, by experimentation, the echo-height dependence on incident angle, using a 3-mm-diameter flat-bottomed hole of flat-surface incidence. Here we exam-ine the adequacy of applying the same dependency to larger flaws by checking the relation between echo height of a disk type flaw and its tilt angle, in a theoretical manner.
In a single probe technique, the reflection directivity factor
DHð;Þof a disk type flaw of radiusaand tilt, placed on
the beam axis, is expressed by the following equation:
DHð;Þ ¼
2J1ð2kasinÞ
2kasin ; ð1Þ
where k¼2= is a wave number and J is the Bessel
function.14)Providing that the echo height is P
F0 for a 0
-tilted flaw and PF for an -tilted flaw, the relative echo
height for tilting a flaw of,PF=PF0, will be obtained by the
following equation becauseDHð0;0Þ ¼1:
PF
PF0
¼2J1ð2kasinÞ
2kasin cos: ð2Þ
The distance-amplitude compensation is based on a disk type
flaw of radiusa0 and tilt 0as a reference. Provided that the
reference echo height isPR0, the relative echo height of a flaw
of radius a and tilt,PF=PR0, in a far field, is obtainable
using the following equation:
PF
PR0
¼ a
2
a02
2J1ð2kasinÞ
2kasin cos: ð3Þ
Figure 8 shows a contour map of the relative echo height
obtained using eq. (3) when 2a0¼3mm and 2a¼3 to 10
mm. Here, the frequency is set as 1.7 MHz, the velocity in graphite is 2400 m/s, and the velocity in water is 1450 m/s. If
the flaw is vertical (a¼0), the relative echo heightP
F=PR0
increases with increased flaw size; however, if the flaw size is constant, it decreases slowly with an initial increase in the tilt angle, decreases steeply at a certain value of the tilt angle, and then fluctuates along with a further increase in the tilt angle. The tilt angle for the steep decrease in the echo height becomes smaller when the flaw size becomes larger. For
example, the tilt angle at which PF=PR0 decreases below
3dB is 6.9 for a 3-mm-diameter flaw and 4.6 for a
10-mm-diameter flaw.
Measurement using 3-mm-diameter flat-bottomed holes, shown in Table 2, reveals that the incident-angle ranges within which the attenuation of echo height is less than 3 dB
is 8.0; thereby, we infer that the incidence angle at which
PF=PR0 becomes 3dB is 4.0 and the reflection angle in
graphite is 6.6. This beam-axis reflection angle, 6.6, well
coincides with the theoretically calculated tilt angle of a flaw,
6.9. On the other hand, the incident-angle ranges within
which the attenuation of echo height is less than 3 dB is 10.0
in other data of 10-mm-diameter flat-bottomed-holes, which
corresponds to a flaw-tilt angle of 8.3; that angle does not
match the calculated tilt angle of 4.6. One reason for the
mismatch is that the calculation is for a continuous wave, whereas the actual flaw detection employs short pulse wave, which has a wider beam spread than a continuous wave.
The pitch of incident-angle change in flaw detection is determined based on the minimum value of the measured
[image:6.595.53.284.70.292.2]Fig. 7 Echo-height profiles along an incident angle: (a) those of 3-mm-diameter flat-bottomed holes in case of top/bottom-surface incidence ( TB), and (b) those of 2-mm-diameter side-drilled in case of side-surface incidence ( S).
Table 2 Incident-angle ranges within which the attenuation of echo height is less than 3 dB or 1 dB, of both top/bottom-surface incidence and side-surface incidence for various beam paths.
Range of incident angle ()
Propagation Plane of incidence
distances Top/bottom surface Side surface
(mm) Echo height Echo height
1dB 3dB 1dB 3dB
10.2 4.5 8.5 — —
26.3 5.0 8.5 — —
60.0 5.5 8.5 — —
108.3 4.5 8.0 — —
137 — — 1.5 3.5
156.7 3.0 8.5 — —
200 — — 2.0 5.0
264 — — 4.1 6.0
3 4 7 92
3 4 5 6 7 8 9 10
+3dB
0dB
−3dB
−6dB −6dB −3dB 0dB
Angle of disk-shaped reflector / °
Diameter of disk-shaped reflector / mm
5 6 8
[image:6.595.313.540.75.207.2] [image:6.595.47.291.397.562.2]incident-angle range among those of 3-mm- and
10-mm-diameter holes (i.e.8.0) so that all flaws of radius 3 mm to
10 mm would be detected without omission.
3.5 Adjustment of working sensitivity
Ultrasonic propagation characteristics of graphite material tend to depend on the ingot production lot. In such a case, it is desirable to prepare reference blocks from the same lot and establish the specified working sensitivity and distance-amplitude characteristic curve. Unfortunately, that would not be practical because it would require a larger number of reference blocks than the number of single ingots necessary for a single rocket. An alternative procedure is adopted, by which the working sensitivity is adjusted for each production lot, where the reference distance-amplitude curves have been prepared in advance. The working sensitivity is adjusted by a propagation characteristic test that is conducted in the test block itself prior to flaw detection.
Figure 2(c) shows the fluctuation of the apparent attenu-ation characteristic observed within an ingot. However, as shown in Fig. 4, the fluctuation of echo heights of flat-bottomed holes is limited to less than 3 dB when employing two-axis swivel scanning. Therefore the local fluctuation of echo height of 3-mm to 10-mm-diameter tilted planar flaws can be kept within 3 dB when two-dimensional scanning is combined with gradual change in incident angles in two
directions, as in the R-X scanning and the R-Z scanning
shown in Fig. 5.
The actual working sensitivity is calibrated by the attenuation compensation for individual production lots and by the difference compensation of sound-pressure trans-mittance between flat-surface and curved-surface incidence, the difference compensation of sound-pressure transmittance among different incident angles, and the compensation for an intensity drop when the beam enters near test-block corners. It is necessary to add a compensation of intensity drop (3 dB) at the beam edge for each scanning axis. Adding all these compensations enables the comprehensive detection of
planar flaws in all directions.15)
In the developed flaw detection method, however, the pitch of incident-angle change is determined based on measure-ment of the reference blocks, but no compensation for an individual test block is considered. Because the echo-height dependence on incident angle would possibly be affected by propagation characteristics of individual test blocks, the pitch determination remains as a subject for further study. For more reliable inspection, it is also necessary to accumulate data of ultrasonic propagation characteristics of test blocks and to evaluate the flaw detection probability taking into account the fluctuation distribution of propagation character-istics.
4. Examples of Actual Test Block Inspections
4.1 Ultrasonic propagation characteristics
Lot-to-lot variation of ultrasonic propagation in graphite material was checked prior to flaw detection. Twenty 3-mm-diameter flat-bottomed holes were provided both on the bottom and the side surfaces of two cylindrical test blocks of 240 mm diameter and 235 mm height (marked No. 1 and
No. 2). The flaw echo heights of normal incidence and the wave velocity were measured. After measurement, the test block surfaces were machined so that the holes were removed prior to flaw detection.
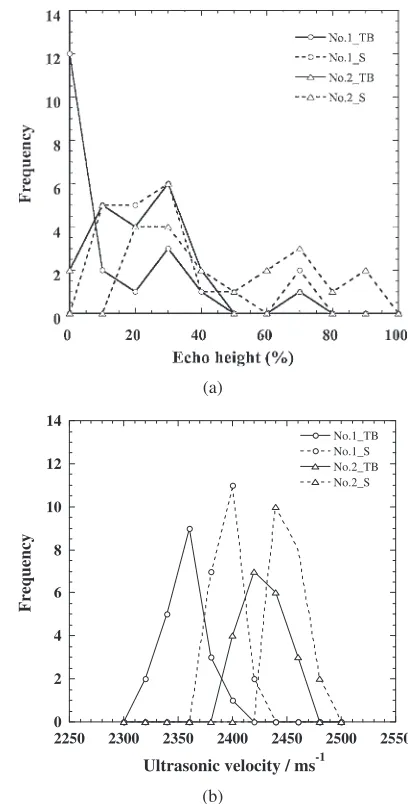
Figure 9 shows measured results of (a) the frequency distribution of echo height and (b) the wave velocity distribution. The literal notation TB indicates flat top/ bottom-surface incidence and S indicates curved side-surface incidence. Figure 9(a) shows that the echo height varied substantially.
On the other hand, as shown in Fig. 9(b), the wave velocity was smaller by about 40 m/s in the vertical direction than in the horizontal direction, as in Fig. 3. The velocity in test block No. 1 was smaller by about 60 m/s than that of test block No. 2. However, the velocity distribution fell in a range
of 100m/s, which was about 2% of the velocity.
Therefore, the average velocity is adopted for flaw detection.
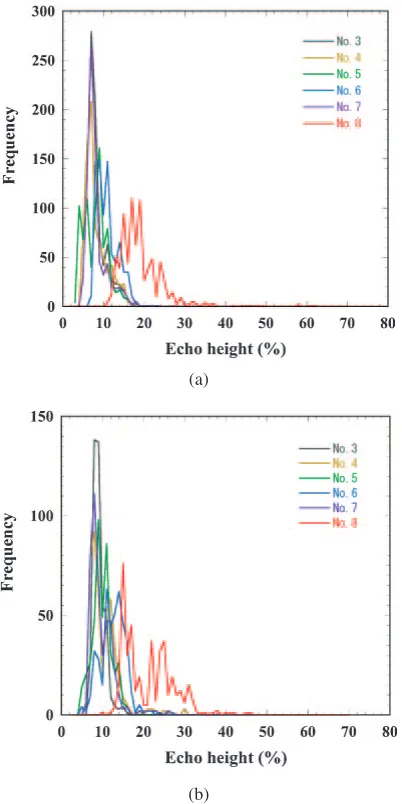
4.2 Echo height distribution in actual flaw detection Figure 10 shows the echo height distribution of six cylindrical test blocks of 225 mm diameter and 220 mm
0 2 4 6 8 10 12 14
2250 2300 2350 2400 2450 2500 2550
No.1_TB No.1_S No.2_TB No.2_S
Frequency
Ultrasonic velocity / ms-1
(a)
(b)
[image:7.595.320.524.69.471.2]height, obtained by (a) flat top/bottom-surface incidence and (b) curved side-surface incidence. Each of these echo heights is the maximum echo height obtained by one-rotation
detection (R-scanning) for every (i1, i2) angle setting at an
Xposition of Fig. 5(b), or the maximum echo height obtained
by one-rotation detection (R-scanning) for every (i1, off)
angle and offset setting at aZposition of Fig. 5(c). No echo
greater than 80% was detected in any test block when all the compensations described in §3.5 were added to the specified sensitivity with which the echo height of 3-mm-diameter flat-bottomed hole became 80%. As shown in Fig. 10, however, the upper limit of the echo height distribution differs from lot to lot in a range of 10–25%, though microstructural observation has not revealed any difference among the lots. The cause of the difference in the echo height distribution would be investigated in future.
In the developed method, secondary inspection shall be made on the indications recognized in this primary inspec-tion. Secondary inspection scanning shall be conducted using smaller pitches of two-dimensional scanning and incident-angle change so that the S/N ratio for 3-mm-diameter flat-bottomed hole is larger.
5. Detection Test Result of Test Blocks Containing Artificial Flaws
A graphite ingot with artificial flaws was produced by mixing cardboard flakes in raw material powder before isostatic pressing and burning for graphitization. The graphitized ingot had flaws at the cardboard flake positions, of which the position and direction were uncontrolled. A cylindrical block of 225 mm diameter and 220 mm height was cut out of the ingot and tested using the flaw detection method of this study. The detected flaws were three (marked Nos. 1, 2 and 3); their center positions are presented in
Table 3 as distances along the X, Y and Z axes from the
datum point.
Next, a 46-mm-thick disk was sliced out of the block so that both No. 1 and 2 flaws occurred approximately in the
center in theZaxis; another 48-mm-thick disk was sliced out
so that No. 3 flaw occurred approximately in the center in the
Z axis. The two disks were subjected to X-ray radiography,
but no flaw was detected. Then, ultrasonic testing of a single-probe, pulse-echo, and normal beam technique was tried by manual scanning from the top and the bottom surfaces of the disks. Using sliced disks, flaw echoes were detected because the S/N ratio was greatly increased. Here an ultrasonic detector (EPOCH-4; Panametrix Co.) and a ceramics-polymer composite probe 2.25K12.7I were used. The results were presented in C-scan displays, the center positions of the flaws were measured, and the flaw sizes were determined using a 6-dB-drop method. However, the orientation direc-tions of the flaws were unidentifiable by this procedure. The results are summarized in Table 3.
Table 3 shows that three artificial flaws were detected at well coincident positions both by the method of this study applied to a large cylindrical test block and by the normal incidence method employed to thin disks. Because no other methods can detect, in a non-destructive way, all flaws situated in various directions in a large test block, this proposed method cannot be verified as detecting all flaws without omission. However, at least it was shown that this flaw detection method precisely detects the positions of artificial flaws lying in various directions.
6. Conclusions
For development of an ultrasonic detection method of planar flaws lying in various directions in graphite ingots (JIS (a)
[image:8.595.69.270.71.473.2](b)
Fig. 10 Frequency distributions of echo height of top/bottom-surface incidence (a) and side-surface incidence (b) in six test blocks.
Table 3 Comparison between ultrasonic testing results by the method described in this paper for a large cylindrical block and those by the normal beam technique for sliced disks.
Normal beam technique Method described herein for sliced blocks for a large cylindrical
Flaw block
No. Location (mm) Size (mm) Location (mm)
X Y Z X Y X Y Z
1 108 118 123 2 4 110 118 120
2 205 177 126 24 25 200 188 126
[image:8.595.302.549.106.207.2]Z 2356),15) major technical problems of graphite flaw detection were solved and verification of the developed method was tried:
(1) The intrinsic graphite property of water absorption caused uneven ultrasonic propagation characteristics in immersion testing, but epoxy coating over all surfaces solved the problem.
(2) The echo heights of flat-bottomed holes showed substantial fluctuation by location, but the maximum echo height detected by two-dimensional scanning accompanying a change in incident angles of two directions gave good results of minimizing the fluctua-tion within 3 dB.
(3) In consideration of this echo height fluctuation in 2), a process of detection was developed that misses no flaws that are oriented in various directions: two-dimensional scanning is conducted at every incident-angle setting changed in two independent axial directions.
(4) Distance-amplitude characteristics for various incident angles were studied because this method requires changing of the incident angle. The echo-height dependence on the incident angle was also studied to determine the changing pitch of the incident angle. (5) To compensate the lot-to-lot fluctuation of ultrasonic
propagation characteristics, a process was developed in which the test blocks themselves were used to deter-mine the specified sensitivity to compensate distance-amplitude curves.
(6) A large test block containing artificial flaws was produced and tested by the developed methods. It was then sliced into thin disks to allow inspection by a common normal incidence method. These two methods gave very well-conformed locations of the three existent flaws.
This work resulted from collaboration of three organiza-tions: the Institute of Space and Astronautical Science, National Aerospace Laboratory, and the National Space
Development Agency (now Japan Aerospace Exploration Agency).
REFERENCES
1) E. Sato and J. Onoda: Materia Japan40(2001) 723–730 (in Japanese). 2) A. Sato, E. Sato, K. Kitazono, M. Shiwa, Y. Shinagawa and T. Ida: Proc. 23rd Int. Symp. Space Technology and Science (Japan Soc. Aeronautical and Space Science, 2002) pp. 449–453.
3) E. Sato: J. JOURNAL OF JSNDI53(2004) 389–390 (in Japanese). 4) J. Toyoda, T. Iyoku, M. Ishihara, N. Kitagawa and S. Shiozawa:
JAERI-M, Vol. 91-102, (Japan Atomic Energy Research Institute, 1991) (in Japanese).
5) N. Owoka, T. Iyoku, T. Ishii, N. Kitagawa, S. Shiozawa, M. Kanbe, T. Miki, T. Ogata and H. Kawae: JAERI-M, Vol. 93-003, (Japan Atomic Energy Research Institute, 1993) (in Japanese).
6) M. Ishihara, S. Hanawa, T. Iyoku and S. Shiozawa: Tanso196(2001) 39–48 (in Japanese).
7) J. H. Friedl, T. A. Gray, P. Khandelwal and T. Dunhill:Review of QNDE, Vol. 23A, ed. D. O. Thompson and D. E. Chimenti (2004) pp. 809–816.
8) F. J. Margetan, R. B. Thompson, M. Keller and W. Hassan:Review of QNDE, Vol. 23B, ed. D. O. Thompson and D. E. Chimenti (2004) pp. 1091–1098.
9) S. Yamazoe: J. JOURNAL OF JSNDI 53 (2004) 391–394 (in Japanese).
10) E. Sato, T. Mihara, M. Shiwa, A. Sato, S. Yamazoe, Y. Shimada, Y. Shinagawa and T. Ida:ISAS Report, Vol. 126, (The Institute of Space and Astronautical Science, 2003) (in Japanese).
11) NDIS 2425:2004: Method of automatic ultrasonic inspection for graphite ingot, (The Japanese Society for Non-destructive Inspection, 2004) (in Japanese).
12) Toyo Tanso Co., Ltd.: Graphite Applications, TN-01-10 (1999) (in Japanese).
13) T. Furukawa, M. Shiwa, A. Sato, S. Yamazoe and E. Sato: Proc. of the 5th National Symposium of Structural Safety and Reliability, (2003) pp. 727–728 (in Japanese).
14) Ultrasonic Testing III, (The Japanese Society for Non-Destruction Inspection, 2001) p. 77 (in Japanese).
15) T. Ida: J. JOURNAL OF JSNDI53(2004) 395–399 (in Japanese). 16) JIS Z 2356:2006: Method of automatic ultrasonic inspection for