Finite Element Simulation with Coupled Thermo-Mechanical Analysis
of Superplastic Dieless Tube Drawing Considering Strain Rate Sensitivity
*Tsuyoshi Furushima and Ken-ichi Manabe
Department of Mechanical Engineering, Tokyo Metropolitan University, Tokyo 192-0397, Japan
The deformation behavior in superplastic dieless tube drawing is studied numerically by the finite element method (FEM). The FEM with coupled thermo-mechanical analysis is conducted considering strain rate sensitivity to clarify the effect of dieless tube drawing conditions such as tensile speed and material properties on the deformation behavior of the tube. In the calculation, the material properties were dealt with as a function of temperature in a special subroutine, whose constitutive equation considering strain rate sensitivity and strain hardening was used, and was linked to the solver. FEM results for both heat transfer and the deformation profile are in good agreement with experimental results. Therefore, the validity of FE modeling of superplastic dieless drawing is demonstrated. In addition, the effect of material propertiesmandn
values on the deformation profile is demonstrated numerically. As a result, a highermvalue constrains the local instability deformation. In cases where themvalue is high, thenvalue has little effect on the deformation profile. Consequently, it is found that analysis considering strain rate sensitivity is important for the prediction of the deformation profile in the dieless drawing process. [doi:10.2320/matertrans.P-MRA2008837]
(Received January 25, 2008; Accepted September 29, 2008; Published December 3, 2008)
Keywords: dieless tube drawing, finite element method, strain rate sensitivity, heat transfer
1. Introduction
Recently, the manufacture of ultrafine and high-precision processed components has led to the enhancement of the functions of medical and biological equipment, and equip-ment used for communication and measureequip-ment, and has contributed to developments in the fields related to micro-electro-mechanical systems (MEMS). In particular, ultrafine microtubes are expected to be applicable in various devices, such as mechanical/structural components in cooling micro-nozzles, electrode tubes used in electric discharge machining, contact probes, and painless needles.1)
We proposed superplastic dieless drawing for fabricating microtubes and succeeded in fabricating a microtube with an outer diameter of D¼343mm and an inner diameter of d¼161mmwithout using fine dies, which otherwise cause various problems at micro-scale, while maintaining the ratio of the inner to outer diameters. Thus, the effectiveness of superplastic dieless drawing was demonstrated.2,3)Moreover,
the effects of the drawing conditions on the deformation profiles were examined.
Investigating the effects of various factors independently, such as processing conditions and material properties, by means of experiments is, however, limited. In addition, it is very difficult to experimentally observe in detail the deformation behavior of tubes during dieless drawing at micro-scale. Therefore, no detailed experimental study was presented in the previous report,2,3)indicating the necessity of
a numerical investigation.
In a numerical study on dieless drawing, Kobatakeet al. calculated temperature distribution by the finite element method (FEM) considering heat transfer obtained by the deformation profiles during dieless drawing experimentally.4)
The temperature distribution in the axial direction obtained by the analysis showed good agreement with experimental results, indicating the effectiveness of the analysis. However,
only heat conduction was considered and deformation behavior was not included in the analysis; therefore, the effects of each factor on the deformation behavior were not investigated. Wanget al.calculated the dieless drawing force in a steady state on the basis of the energy principle and studied the effects of various factors on the drawing force.5) However, the effect of heat transfer and the deformation behavior in an unsteady state were not considered, resulting in an insufficient analysis. Moreover, we previously carried out the FE simulation coupled with the thermo-mechanical analysis of dieless drawing, taking heat conduction inside a tube into consideration.6) However, in the conventional
model, the temperature distribution on the tube surface had to be determined beforehand by presetting the heating and cooling temperatures and the distance between the heater and the cooler. In fact, the temperature distribution on the tube surface was unknown because the temperature distribution should be determined by the amount of heat supplied from the heating coil and the heat transfer between the tube surface cooling air and atmosphere. Therefore, the conventional model was ineffective for studying the effects of the conditions, such as the amount of heat supplied from the heating coil and the efficiency of the cooling coil, on the temperature distribution.
In this study, we made a new heat transfer model in which we consider the amount of heat supplied from the heating coil and the heat transfer between the tube and the cooling coil and that between the tube and the atmosphere. A material with strain rate sensitivity and strain hardening dependence, as well as their temperature dependences, were considered was modeled as a tube. The FE simulation coupled with the thermo-mechanical analysis of superplastic dieless drawing, in which the evaluation of the heat transfer on a tube surface and the heat conduction inside the tube was coupled with the deformation analysis, was carried out. More concretely, we analyzed the dieless drawing of the Al-78Zn superplastic alloy, which was also used in the previous study, compared the results with the previous experimental results,2,3) and demonstrated the effectiveness of the present analysis. The *This Paper was Originally Published in Japanese in J. JSTP48(2007) 51–
55.
effects of each factor on the drawing behavior were then investigated. In particular, for the effects of drawing conditions and material properties on the deformation profile, the aspects that cannot be elucidated in detail by experiments were numerically studied.
2. Superplastic Dieless Drawing
Superplastic dieless drawing is a method of fabricating a thin tube by the following procedure: fix one end of a superplastic alloy tubular material, as shown in Fig. 1, heat part of the material and then draw the other end of the material at speed V1. Simultaneously move the heated
deformation region at speed V2. The cross-sectional areas
of the tube before and after deformation are A1 and A2,
respectively. The reduction in arearis obtained as7)
r¼1A2=A1 ¼V1=ðV1þV2Þ: ð1Þ
It is possible to obtain a largerusing a superplastic material with a high ductility for the original tube.
3. FE Analysis of Superplastic Dieless Drawing
3.1 FE model for superplastic dieless drawing
MSC.Marc/Mentat ver. 2001 was used as the commercial FEM code to analyze superplastic dieless drawing. The coupled thermo-mechanical rigid-plastic FE simulation was carried out. As shown in Fig. 2, an axisymmetric model was used in the FE model. The dimensions of the tube were used in the previous experiment:2,3) outer diameter D¼2mm and inner diameter d¼1mm. The length of the tube was l¼50mm. The number of elements was 500 in the axial direction and 4 in the tube thickness direction, and a 4-node axisymmetric element was used. The left end of the tube was fixed and tensile deformation was applied to the right end of the tube at tensile speedV1.
3.2 Heat transfer model
The temperature distribution of the tube during dieless drawing was changed in accordance with the heat supplied from the heating coil, the heat conduction inside the tube, and the heat transfer from the tube to the cooling air from the cooling coil and that from the tube to the atmosphere. The heat conduction equation of the axisymmetric model in an unsteady state considering the above factors is expressed as
1
r @
@r r @T
@r
þ@
2T
@z2
c@T
@t þ _ Q
Q¼0: ð2Þ
Here,is the thermal conductivity,cis the specific heat,is
the mass density, and QQ_ is the heat generated per unit time and unit volume.
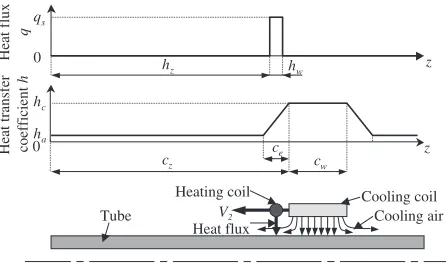
The tube is heated by the heat supplied from the heating coil and cooled by the cooling air from the cooling coil and the atmosphere. In this analysis, the boundary conditions for the heat transfer at the tube boundaries are as shown in Fig. 3. The heat is transferred through these boundaries, where the following boundary conditions are satisfied.
3.2.1 Heat transfer inside heating coil
Heat is transferred on the tube surface by the heating coil, and the following boundary condition is satisfied on the tube surface.
@T
@n ¼q ð3Þ
The heat flux q outside the heating coil (z<hz and
hzþhwz) is defined as
q¼0 ð4Þ
and that inside the heating coil (hzz<hzþhw) is defined
as
q¼qs: ð5Þ
Here,hzis the position coordinate of the heating coil on thez
axis,hwis the width of the heating coil, andqsis the amount
of heat flux supplied.
Because the heating coil is moved at speedV2in timet,hz
is expressed as
hz¼hz0V2t: ð6Þ
Here,hz0is the initial position coordinate of the heating coil
on thezaxis.
3.2.2 Heat transfer between tube and cooling coil and that between tube and atmosphere
Heat transfer occurs between the tube surface and the
Heating coil Cooling coil
A1 A2
V1
V2
Superplastic tube
Fig. 1 Schematic illustration of superplastic dieless drawing process.
Heating coil
V2
V1
50mm
D
=
φ
2mm
Tube
t
=
0.5mm
d
=
φ
1mm
Cooling coil
Fig. 2 FE model of superplastic dieless drawing process.
Heat transfer coefficient
h
Heat flux
q
0 qs
0 hc
ha
z z
hz hw
cz ce cw
V2
Cooling coil Heating coil
Cooling air Tube
Heat flux
[image:2.595.316.540.74.139.2] [image:2.595.68.270.75.162.2] [image:2.595.315.538.186.318.2]cooling air from the cooling coil and between the tube surface and the atmosphere, and the following boundary condition is satisfied.
@T
@n ¼hðTTcÞ ð7Þ
Here, h is the heat transfer coefficient and Tc is the
atmospheric temperature. In the analysis, the air flowing from the inside to the outside of the cooling coil was modeled assuming that h gradually changes. Namely, h outside the cooling coil (z<czce and czþcwþcez)
is defined as
h¼ha: ð8Þ
h in the region outside the cooling coil where the effect of cooling air is observed (czcez<czandczþcwz<
czþcwþce) is defined as
h¼ðhchaÞ ce
fz ðczceÞg þha
ðczce5z<czÞ; ð9Þ
h¼ðhchaÞ ce
fðczþcwÞ zg þhc
ðczþcw5z<czþcwþceÞ; ð10Þ
andhunder the cooling coil (czz<czþcw) is defined as
h¼hc: ð11Þ
Here,czis the position coordinate of the cooling coil on thez
axis,ceis the distance which is affected by the cooling air,cw
is the width of the cooling coil, ha is the heat transfer
coefficient between the tube surface and the atmosphere, and hc is the heat transfer coefficient between the tube surface
and the cooling air from the cooling coil.
Because the cooling coil is moved at speedV2 in timet,
similarly to the heating coil,czis expressed as
cz¼cz0V2t: ð12Þ
Here,cz0is the initial position coordinate of the cooling coil
on thezaxis.
The thermal properties of the material are a specific heatc of 383 J kg1K1, a mass density of 7,130 kgm3, and a thermal conductivity of 113 Wm1K1. The heat transfer coefficient between the material and the atmosphere ha is
30 W m2K1, and the atmospheric temperature and the temperature of the cooling air are both 293 K.
In this analysis, the amount of heat (qs) and the heat
transfer coefficient (ha,hc) are assumed to be constant values.
In the case of the analysis with higher precision, it is better to set the amount of heat and the heat transfer coefficient on the basis of the actual heating and cooling sources. For example, when modeling the high-frequency-induced heating, a more precise analysis can be realized by adding the coupled electromagnetic-thermal analysis and calculating the amount of heat generated to this model. In this case, however, it is necessary to prepare a numerical model in which all of electromagnetic-thermo-mechanical factors are coupled, which is very complicated. In this report, only the coupled thermo-mechanical analysis was taken into consideration for simplicity.
3.3 Material model
In dieless drawing, a tube is fabricated by locally increasing the temperature. In general, the flow stress of a material is greatly affected by the strain rate at a high temperature. Particularly in the case of the superplastic material used in this study, the strain rate sensitivity of the flow stress is very high. Now, we apply the following flow stress function considering the strain hardening dependence and the strain rate sensitivity into consideration to the material model dealt with in this analysis.
¼K"n""_m ð13Þ
Here,Kis the strength coefficient,nis the drawing hardening index, andmis the strain rate sensitivity index. Moreover,K, m, and n are assumed to approximately be functions of temperature.
A1-78Zn superplastic alloy, which was used in the experiment, was used as the material in this analysis. Because this material rarely hardens even at room temper-ature, n¼0 was assumed in every temperature range. The other material properties K and m were obtained by the jump tensile test in the temperature region between room temperature and 523 K in the range of strain rate between 4:17104 and102s1, and were defined to be functions of temperature on the basis of the test result (Fig. 4).
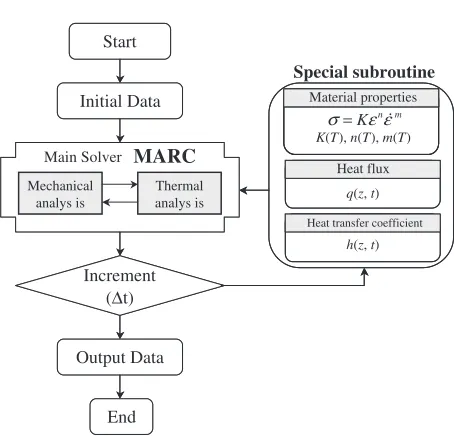
3.4 User subroutine
The boundary condition of heat transfer and the material model defined in the previous section were incorporated into MSC.Marc employing user subroutines to carry out the FE simulation coupled with the thermo-mechanical analysis, considering the strain rate sensitivity, as shown in Fig. 5.
4. Analytical Results and Discussion
4.1 Validity of heat transfer analysis
To demonstrate the validity of the heat transfer model, the temperature distribution on the tube was experimentally measured by moving the heating and cooling coils at V2¼3:6mm/min without applying tensile deformation.
The apparatus and method of dieless drawing were the same m=2×10⁻⁶T2-0.0003 T +0.0266
K=6×10 T-3.6701
0 0.1 0.2 0.3 0.4 0.5 0.6
273
Temperature T /K
m
value
0 100 200 300 400 500 600
K
value
K value
m value
573 523 473 423 373 323
−11
[image:3.595.315.541.74.248.2]as those used in the previous study.2,3)The experiments were
carried out under condition of the high-frequency powers of 45 and 60% without cooling and with the cooling air pressure of 0.2 MPa.
Figure 6 shows the effect of the heat transfer coefficient under the cooling coil on the temperature distribution of the tube. FE analysis conditions were as follows: amount of heat suppliedqs¼400kWm2and heat transfer coefficient under
the cooling coilhc¼0{2;000Wm2K1. With increasinghc,
the temperature decreases in general. Also in the experiment, the temperature in the case of applying 0.2 MPa cooling air generally decreases more than that in the case without cooling, indicating that the FE analysis well simulates the experiment. Figure 7 shows the effect of the amount of supplied heat on the temperature distribution of the tube. FE analysis conditions were as follows:qs¼400{1;500kWm2
and hc¼2;000Wm2k1. With increasing qs, the
temper-ature increases in general, which is in good agreement with the experimental results. By this comparison of the analysis and experimental results, the validity of the heat transfer model used in this analysis was verified.
4.2 Effects of tensile speed on deformation profile
The deformation profile was observed after superplastic dieless drawing while maintaining the moving speed of the heating coilV2at 3.6 mm/min and changing the tensile speed V1 in the range of 3.6–14.4 mm/min. The analysis was
carried out by setting qs¼1;100kWm2 such that the
temperature of the heated part of the tube was approximately 523 K. Figure 8 shows the deformation profiles under conditions of the experiment and analysis. With increasing V1, the reduction in area rincreases and the outer diameter
of the tubeDdecreases. Moreover, unstable deformation in the initial stage of dieless drawing can be observed also in the FE analysis results. The degree of unstable deformation is defined as the unstable deformation rateD=Dave. Start
Initial Data
Main Solver MARC
Mechanical analys is
Thermal analys is
Increment (∆t)
Output Data
End
Special subroutine Material properties
m n Kε ε
σ=
K(T), n(T), m(T)
q(z, t)
Heat flux
Heat transfer coefficient
h(z, t)
Fig. 5 Flow chart of coupled thermo-mechanical analysis and subroutine program.
l
V2
=3.6mm
/min
273 373 473 573 673
-5
Coil position from thermocouple l /mm
Temperature at thermocouple
T
/
K
No cooling
Cooling (0.2MPa) Exp. (Power 45%) FEM (qs=400kW m
-2
)
hc= 2000W m
-2
K-1 hc= 1000W m
-2
K-1
hc= 500W m
-2
K-1 h c = 0Wm
-2
K-1
10 5
0
Thermocouple
Fig. 6 Effect of heat transfer coefficient under cooling coil on temperature history.
ll
V2
=3.6mm
/min
293 393 493 593 693
-5
Coil position from thermocouple l /mm
Temperature at thermocouple
T
/K Exp. (0.2MPa)
FEM (hc=2000W m
-2
K-1)
qs=1500kW m
-2
qs=1270kW m
-2
q s=1000kW m
-2
qs=400kW m
-2
Power :60%
Power :45%
10 5
0
Thermocouple
Fig. 7 Effect of heat flux under heating coil on temperature history.
Heating coil
Instable deformation
Instable deformation
5mm
(a)
(b)
(c)
(d)
Fig. 8 Effect of tensile speed,V1 on deformation profile in superplastic dieless drawing process (a) V1¼3:6mm/min, V2¼3:6mm/min,
r¼50% (b) V1¼7:2mm/min, V2¼3:6mm/min, r¼66:7% (c)
[image:4.595.55.282.62.280.2] [image:4.595.309.548.74.223.2] [image:4.595.311.547.269.534.2] [image:4.595.51.290.336.486.2]D Dave
¼DaveDmin
Dave
ð14Þ
Here,Dave is the average outer diameter in the steady state
and Dmin is the minimum outer diameter of the unstably
deformed part.
Figure 9 shows the relationship betweenD=Daveandr. D=Dave increases with increasing r. The higher the D=Dave, the higher the risk of fracture in an unsteady state
in the initial stage of drawing. In the experiment, drawing withrof more than 80% failed and fracture occurred. Here, we judged that D=Dave can be used as an index for
evaluating the risk of fracture. The analysis result shows good agreement with the experimental result, indicating that the behavior during dieless drawing in the unsteady state until reaching the steady state is well simulated.
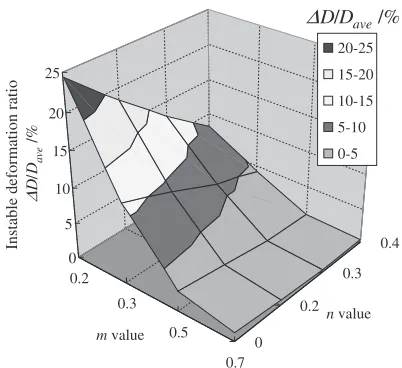
4.3 Effects of material characteristics on deformation profile
In the previous study,2,3) the effect of the temperature of the heated part on the deformation profile was examined, and it was found that the unstable deformation can be suppressed at an appropriate temperature. We considered this to be due to the effect of n value being temperature dependent. However, some other parameters also depend on the temper-ature, and it is impossible to individually determine each effect of various material characteristics, includingmvalue, experimentally. In the present analysis, we focused on the individual effect ofmandnvalues on the deformation profile. Figure 10 shows the temperature dependences of m andn values. The relationship between the material characteristics and the temperature from room temperature to 523 K was approximated to be linear. The representativemandnvalues were the values at 523 K and room temperature, respectively. K value was set to be the same as that of the Al-78Zn alloy shown in Fig. 4. The analysis was carried out under the conditions of V1¼3:6mm/min, V2¼3:6mm/min, and r¼50%.
[image:5.595.315.541.73.218.2]Figure 11 shows the effect ofmvalue on the deformation profile. When mvalue is 0.1 or less, unstable deformation locally occurs, resulting in necking. The unstable deforma-tion is suppressed with increasingmvalue.
Figure 12 shows the effects ofmandnvalues onD=Dave.
As described above, the magnitude ofmvalue greatly affects
D=Dave. Generally, D=Dave is suppressed with high m
value regardless ofnvalue, suggesting a low probability of
0 5 10 15 20 25 30 35
0
Reduction in area r /%
Instability deformation ratio
∆
D/D
ave
/%
FEM
Exp. FEM
Exp.
Dmin
Dave
ave ave
ave D
D D D
D = − min ∆
100 80
60 40
20
Fig. 9 Relationship between ratio of instability deformation,D=Daveand reduction in area,r.
293
0 0.1 0.2 0.3 0.4 0.5
Temperature T /K
n
value
523K 0.1
0.3 0.5 0.7
0 0.2
0 0.2 0.4 0.6 0.8
Temperature T /K
m
value
523K
(a) (b)
593 493
393 293 393 493 593
Fig. 10 Temperature dependency ofmandnvalues used in FEM analysis (a)mvalue (b)nvalue.
Localized thinning
Instable deformation
Heating coil
(a)
(b)
[image:5.595.59.282.74.273.2](c)
Fig. 11 Effect ofmvalue on deformation profile in dieless drawing process (a)m¼0:1,n¼0:2(b)m¼0:2,n¼0:2(c)m¼0:5,n¼0:2.
0.2
0.3
0.5
0.7 0
0.2 0.3
0.4 0
5 10 15 20 25
m value
n value 20-25
15-20
10-15
5-10
0-5
Instable deformation ratio
∆
D
/
Dave
/%
∆D/Dave/%
[image:5.595.310.542.277.396.2] [image:5.595.326.527.454.638.2]breakage in the unsteady state. On the other hand, n value affects D=Dave greatly in the case of low m value but
negligibly in the case of highm.
These results reveal that mvalue under high-temperature conditions affects the deformation profile more greatly than n value at room temperature during dieless drawing. Here, the deformation behavior in the unsteady state is considered to be the same as that upon the occurrence of necking during tensile testing. Namely, in the case of a material with high m value, when the strain rate of the necking part increases, the flow stress increases and further deformation is suppressed. This behavior also occurs in the unsteady state during dieless drawing and the unstable deformation behavior is suppressed. Most materials exhibit strain rate sensitivity at high temperatures, which also illustrates the importance of taking into consideration the strain rate sensitivity index m value in the analysis. Moreover, to achieve successful drawing without unstable deformation, it is necessary to select a material with high m, such as superplastic materials, regardless of the magnitude of n value at room temperature. The analytical results reveal the effectiveness of superplastic dieless drawing proposed in this study. Furthermore, for a material with low m under high-temperature conditions, selecting a material with high n value at room temperature is effective for achieving successful drawing.
5. Conclusions
In this study, we developed an FE model with coupled analysis for superplastic dieless drawing, in which a material with strain rate sensitivity and strain hardening sensitivity, the heat transfer, and the deformation were taken into consideration. The validity of the model and the effects of
each condition on the deformation profile were studied, and the following conclusions were obtained.
(1) The validity of the numerical model was demonstrated from the aspects of heat transfer and deformation. The results of FE analysis agreed well with the temperature distribution and the deformation profile obtained in the experiments, indicating the validity of the FE simu-lation coupled with thermo-mechanical analysis. (2) The effects ofmandn, which are material
character-istics with temperature dependence, on the deformation profile were investigated. As a result, it was found that m greatly affects the deformation profile, whereas n value affects the deformation profile only in the case of a material with lowmvalue. The importance of taking into consideration the strain rate sensitivity during dieless drawing was verified.
(3) It was found that the higher themvalue of a material, the more the unstable deformation is suppressed. This demonstrates the effectiveness of superplastic dieless drawing numerically.
REFERENCES
1) E. Nakamachi: J. Jpn. Soc. Mech. Eng.107(2004) 45. (in Japanease) 2) T. Furushima, K. Manabe and T. Sakai: J. Jpn. Soc. Technol. Plast.47
(2006) 870–874. (in Japanease)
3) T. Furushima and K. Manabe: J. Mater. Process. Technol. 187–188
(2007) 236–240.
4) K. Kobatake, H. Sekiguchi, K. Osakada and K. Yoshikawa: J. Jpn. Soc. Technol. Plast.21(1980) 52–58. (in Japanease)
5) Z. T. Wang, G. F. Luan and G. R. Bai: J. Mater. Process. Technol.94
(1994) 73–77.
6) T. Furushima, T. Sakai and K. Manabe: Proc. NUMIFORM04 (2004) pp. 522–527.