Dynamical Desorption Process of Oxygen on Platinum
by Using a Gas Controllable H
2j
H
þElectrolyte
j
Pt Cell
Kunio Matsuda
1;*and Shuji Harada
2 1Graduate School of Science & Technology, Niigata University, Niigata 950-2181, Japan 2Faculty of Engineering, Niigata University, Niigata 950-2181, Japan
The dynamical desorption process of oxygen on platinum was investigated by an electrochemical method. By using a gas controllable H2j
HþelectrolytejPt cell, the value of electromotive force (EMF) has been measured as a function of lapse of time after an oxygen adsorbing treatment on the Pt electrode. The time dependence of EMF value has been classified into three stages. In the base stage, the value of EMF was discussed on the oxygen concentration on the Pt electrode. The 1st stage was interpreted by using the electrochemical theory on a diffusion model. The 2nd stage has been analyzed by using a random desorption model. The behavior of EMF was in good agreement with these models. From above analyses, the activation energy of oxygen diffusion process and the adsorption energy of oxygen on the Pt electrode were evaluated. The inflection point as a boundary point of the 1st to 2nd stage was related to the dynamical desorption process of oxygen.
(Received January 21, 2005; Accepted March 30, 2005; Published May 15, 2005)
Keywords: oxygen, platinum, desorption, adsorption, electromotive force, electrochemical method, fuel cell, gas controllable cell, diffusion, electrode
1. Introduction
Dynamical surface phenomena such as adsorption, surface diffusion, surface reaction and desorption have been inves-tigated. The surface potential, interaction energy and ad-sorption sites play important role to clarify the mecha-nisms.1–3) The oxygen and/or hydrogen with platinum system are suitable and desirable for the investigation of above fundamental subjects. The adsorption state is classified into two types that are a molecular adsorption state and an atomic one.4)Recently, the energy state as a function of the
bonding distance for the adsorption site of the atomic oxygen and the molecular one on a Pt surface have been calculated by using cluster model.5) In this study, Kokaji et al. have
discussed on the interaction of oxygen with the Pt surface as a function of distance. Experimentally, Davis and Mullins have measured the translational energy of the oxygen molecule on the Pt surface by using a molecular beam spectroscopy.6)
Capitanoet al.showed that atomic hydrogen is more reactive than coadsorbed hydrogen during reaction with both adsorb-ed atomic and molecular oxygen on the Pt surface.7)Verheij and Hugenschmidt have observed a phase separation between hydrogen and oxygen, indicating a decreased binding energy of H atoms inside O islands on the Pt surface,8) and the
hydrogen and oxygen reaction on Pt with molecular beam relaxation spectroscopy.9)
There are many kinds of electrochemical methods to obtain the dynamical properties on an electrode surface, for instance, cyclic voltammetry, potentiometry, chrono-amperometry and so on. Gyenge has studied the electro-chemical oxidation of BH
4 in NaOH on Pt and Au by above
methods, and has proposed that thiourea could improve the BH
4 utilization efficiency and the coulombic efficiency of
direct borohydride fuel cells using catalytic anodes.10)These typical methods are, however, due to control the surface state on a specimen electrode by applying voltage and/or current
with an outer source, continuously.11) We have offered
another electromotive force (EMF) method without an outer source to investigate a metal-hydrogen system.12) Our
method is suitable for evaluation the dynamical properties of hydrogen on a metal surface because of the isolated system without an outer source.
By means of our EMF method, we have investigated the adsorption and desorption process of hydrogen by using a H2
j Hþelectrolyte j Pt cell and have had a discussion on
adsorption and desorption energy.13) These measurements
were, however, performed by using this cell with atmo-spheric oxygen. In these measurements, we have recognized that the fluctuation of the EMF of the cell was about 4 mV. Our preliminary experiments showed that the EMF fluctua-tion is very sensitive to dissolved oxygen. Therefore, we have designed a gas controllable H2jHþelectrolytejPt cell.
In this paper, the dynamical desorption process of oxygen on a Pt surface will be investigated by using the gas controllable cell. The value of EMF will be measured as a function of lapse of time after an adsorbing oxygen treatment on the Pt electrode. The time dependence of EMF behavior will be analyzed by using the electrochemical theory on a diffusion model and a random desorption model. From above analyses, the activation energy of the oxygen diffusion process and the adsorption energy of oxygen on the Pt electrode were evaluated.
2. Experimental Procedure
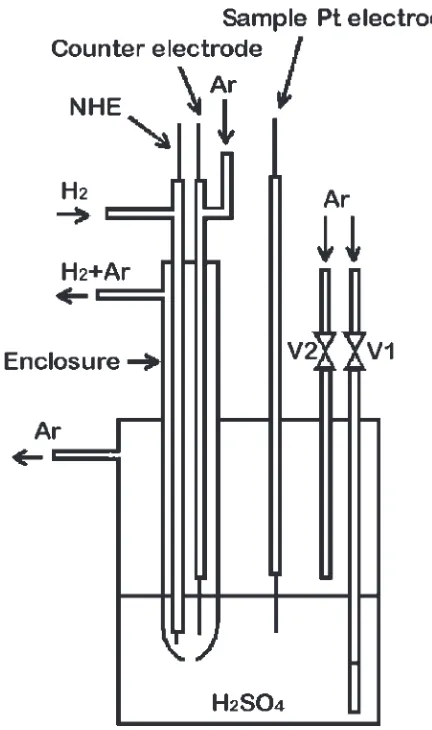
A Pt wire with a diameter of 0.5 mm was heated in a gas burner with reducing flame and quenched into pure water. This Pt wire was used for the sample Pt electrode and counter electrode. A normal hydrogen electrode (NHE) was made of platinum black with a diameter of 0.5 mm, which was prepared by the electrochemical treatment with H2PtCl6 +
Pb at about 350 K. The purity of Pt in this cell was 99.95%. The schematic view of present cell is shown in Fig. 1. The gas control technology and the clean technology were
*Graduate Student, Niigata University
referred to the gas bubbling method.14)This cell was made of
a PYREXÒglass with leak tightness. The dissolved oxygen in the electrolyte was removed by 103m3/min Ar gas
bubbling for 8 h. The leakage of air into the cell was prevented by Ar continuous purging. In order to block the hydrogen gas dissolving into the electrolyte, the NHE was covered with the enclosure and was contact with the electrolyte through the 1 mm hole. The backpressure of exhaust gas from the cell was kept constant at atmospheric pressure. The amount of electrolyte was 103m3 with
500 mol/m3 H
2SO4 acid solution. This electrolyte was
stirred up quickly to make equalization of dissolved gas concentration. The EMF measurement was performed by using a digital electrometer (Advantest R8240) with 1013
input impedance. The NHE and the sample electrode in the circuit were opened normally and just connected with this electrometer at the measurement. The sampling interval was 5 seconds.
An oxygen adsorbing treatment to the sample Pt electrode was done by electrolysis method;i.e., () counter electrodej Hþelectrolyte j sample Pt electrode (þ) cell by supplying
3.1 V for 4.5 s. This supplying condition for the oxygen adsorbing treatment was decided by the reproducibility of the base stage before/after the treatment and the maximization of
the time of inflection point on a EMF reduction profile, where the EMF profile will be mentioned in a following section. By using this method, we could get the reproducible conditions that the sample Pt electrode is saturated with oxygen without excessive oxygen dissolving into the electrolyte. After the oxygen adsorbing treatment, the EMF measurement was immediately started, and the EMF value of H2
j Hþelectrolyte j Pt cell was measured as a function of lapse of time, where Ptmeans the oxygen adsorbing treated sample Pt electrode.
3. Experimental Results
3.1 Preliminary experiment
Figure 2 shows the EMF as a function of lapse of time of the gas controllable H2jHþelectrolytejPt cell with Ar gas
continuous bubbling in order to confirm the influence of dissolved air in electrolyte. The value of EMF before bubbling was 0.8 V in the atmosphere, which is the value as was shown in a previous paper.13) The value, however, decreased to 0.05 V with lapse of time by Ar bubbling as was recognized in the figure. This value was kept constant by preventing the leakage of air into the cell. We will call the 0.05 V as the base value. When the air supplied to the electrolyte of the cell under the base value, the EMF returned back to the initial value (0.8 V). This means that the EMF value of the cell before Ar bubbling depends on the dissolving the air into the electrolyte. In order to investigate which component of the air has influenced, O2, CO2and N2
gas was supplied to the electrolyte, respectively. Only the O2
gas can increase the EMF of the cell dramatically. Therefore, the reaction of this cell is given by
H2!2Hþþ2e; on NHE; ð1Þ
1/2O2þ2Hþþ2e!H2O; on Pt electrode; ð2Þ
H2þ1/2O2!H2O; on both electrodes:
ð3Þ
This means that the initial value (0.8 V) of the EMF is
Fig. 1 Gas controllable H2jHþelectrolytejPt cell. The dissolved oxygen
in the electrolyte was removed by Ar gas bubbling. The leakage of air into the cell was prevented by Ar continuous purging.
Fig. 2 The EMF of the gas controllable H2jHþelectrolytejPt cell with Ar
gas continuous bubbling in order to confirm the influence of dissolved air in electrolyte.
[image:2.595.53.269.69.434.2] [image:2.595.317.540.73.261.2]brought to the O2gas in the electrolyte under the atmosphere,
and the base value (0.05 V) of the EMF would be lead to remove the dissolved O2 by Ar bubbling with this new
technique, which will be discussed in a following section. The EMF measurement in the low dissolved O2 region will
play important role as a base.
3.2 Time and temperature dependence of EMF
meas-urements
In order to investigate the dynamical desorption process of oxygen on the sample Pt electrode, the value of EMF was measured by using the H2jHþelectrolytejPt cell after Ar
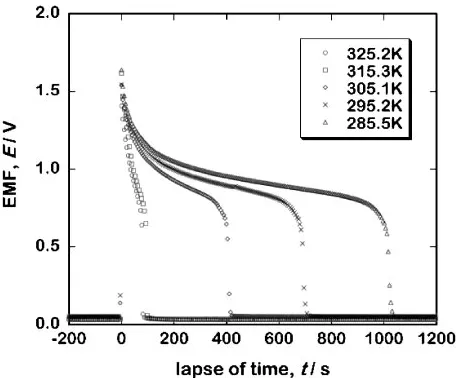
bubbling. Figure 3 shows the EMF of the cell as a function of lapse of time. The behavior of time dependence is explained by using a typical result of 285.5 K (triangle) in the figure. The time dependence of the EMF will be classified into the three stages oft<0s, 0<t<741 and741t<1026as will be discussed in a following section. In the range oft<0,
i.e., before the oxygen adsorbing treatment, the cell was kept at Ar atmosphere by the Ar continuous purging method. The EMF value at t<0 was the base value 0.05 V. Under the condition with the base value, the oxygen adsorbing treat-ment was done and just stopped at t¼0 in the figure. This treatment was effective in generating oxygen on the sample Pt electrode without excessive oxygen dissolving into the electrolyte. In the next stage of0<t<741, the EMF value was 1.64 V momentarily, and it decreased abruptly (0<t<100) and gradually (100t<741) with lapse of time. The origin of 1.64 V will be discussed in a following section. The EMF in the last stage of 741t<1026 fell rapidly, and it returned back to the base value att1026, wheret¼741means the point of inflection. The temperature dependency of the EMF was also shown in Fig. 3. The each behavior as a function of lapse of time was similarly as the above typical result of 285.5 K. The inflection point ist¼
741 at 285.5 K,t¼490at 295.2 K,t¼282at 305.1 K,t¼
66 at 315.3 K and t¼56 at 325.2 K, which was shortened with increasing the temperature.
4. Experimental Analysis and Discussion
As was mentioned before, the EMF behavior of H2 j
Hþelectrolytej Pt cell was classified into three stages as a
function of lapse of time. These stages were called to the base stage that is the stable state with Ar bubbling before the oxygen adsorbing treatment, the 1st stage that is from after the oxygen adsorbing treatment to the inflection point, and the 2nd stage that is from the inflection point to the end of the stage. The EMF value of the cell is equal to the difference of the chemical potential.15)In this chapter, we will analyze and discuss on the three stages: In the base stage, the value of EMF will be discussed on the O2molecule concentration on
the sample Pt electrode. In the next 1st stage, the lapse of time of the EMF will be analyzed by using the electro-chemical theory on a diffusion model. The last 2nd stage, however, will not be interpreted by the model. This stage can be analyzed by using a random desorption model as was shown in a previous paper.13)
After the oxygen adsorbing treatment on the sample Pt electrode, the EMF,E, of the (I) H2jHþelectrolytejPt(II)
cell under the reaction of eq. (3) is given by
FE¼1
2
Pt H2O
H2
H2þ
1 2 Pt O2
; ð4Þ
wherePtH
2O,
H2
H2and
Pt
O2 are the chemical potential of H2O
on the sample Pt electrode, H
2 on the NHE and O2on the
sample Pt electrode, respectively, and F means the
Faraday’s constant, and (I) and (II) mean the terminals of the cell made by Pt. The derivation of the equation is summarized as follow: In the case of a charged particle system, the electrochemical potential~i
ofspecies in ani phase can be described as
~
i¼iþziFi; ð5Þ
where z and mean the valance and the electrostatic potential, respectively. When there is a reaction
1þ2, the chemical potentiali
is written by
i¼i
1þ
i
2 ð6Þ
on equilibrium conditions in a sameiphase. By using eqs. (5) and (6), we can get the following relations
H2
H2¼2
H2
H ¼2 ~ H2
Hþþ2 ~ H2
e; ð7Þ
1
2
Pt O2 þ2 ~
Pt Hþþ2 ~Pt
e ¼Pt
H2O: ð8Þ
Equation (4) can be derived as follow:
1
2
Pt H2O
H2
H2þ
1 2 Pt O2 ¼1
2 2 ~
Pt Hþþ2 ~Pt
e 2 ~H2 Hþþ2 ~
H2
e
ð9Þ
¼~PtHþþ~Pt e ~H2
Hþþ~ H2
e
:
Since the electrochemical potential of Hþ is equal to the
interface between both electrodes and electrolyte, we can obtain the following contact equilibrium conditions,
~
PtHþ ¼~
electrolyte Hþ ¼~
H2
Hþ: ð10Þ Fig. 3 The temperature dependency of EMF of H2jHþelectrolytejPtcell
[image:3.595.54.283.71.260.2]While, the equilibrium conditions of electron between terminal and electrode lead to the following relations
~
Ie¼~He2; ~IIe¼~Pt
e: ð11Þ
Equations (10) and (11) are substituted for eq. (9), the equation can be rewritten in the intended eq. (4)
1
2
Pt H2O
H2
H2þ
1 2 Pt O2
¼~PtHþþ~Pt e ~H2
Hþþ~ H2
e
¼~IIe~Ie
¼ IIeIe
F IIeIe
¼ FE;
where the electrochemical potentialIIe is equal to theIe,
because the terminals of the cell are made of same material.
4.1 Base stage on the EMF behavior of the cell with Ar bubbling
In this section, we will analyze the base stage on the EMF behavior of the cell with Ar bubbling by using the electro-chemical theory. The electro-chemical potentiali
is expressed by using the activityai
i¼iþRTlnai; ð12Þ
wherei
is the standard chemical potential andRis the gas constant. By using the relation, we can obtain
E¼EþRT
2Fln
ðaH2
H2Þða
Pt O2Þ
1=2
ðaPtH
2OÞ
" #
; ð13Þ
where Pt H2O¼
Pt
H2OþRTlna
Pt H2O,
H2
H2¼
H2
H2 þRTlna
H2
H2
andPt O2¼
Pt
O2 þRTlna
Pt
O2are used. The standard potential
E¼1=2F½ðH2
H2 þ1=2
Pt O2Þ
Pt
H2O is equal to 1.229 V
which is the value at 298.15 K, 1.013 MPa.11)By using the
definition ofaH2
H2 ¼1on the NHE, eq. (13) can be rewritten as
E¼EþRT
2Fln
ðaPt O2Þ
1=2
ðaPt H2OÞ
" #
: ð14Þ
In the case of our experimental result by sufficient bubbling, we got the following relation ½ðaPt
O2Þ
1=2=ðaPt
H2OÞ ¼2:3
1042 by using the base value 0.05 V of EMF. This means
that the O2 concentration C on the sample Pt electrode
became extremely low by using the relation ofaPtO
2¼O2C,
where is the fugacity coefficient.
4.2 1st stage on the EMF behavior of the cell after the oxygen adsorbing treatment
After the oxygen adsorbing treatment, the EMF value indicated 1.64 V momentarily and it decreased abruptly and gradually with lapse of time as was shown in Fig. 3. The value of 1.64 V should be explained that the O2concentration
on the sample Pt electrode is very high compared with the
standard equilibrium condition. The dynamical behavior of the EMF can be caused by the time dependence of the 2nd term in eq. (14). The rate determining process in high O2
region, however, will be due to the diffusion process of the recombined O2molecule on/nearby the sample Ptelectrode,
because the recombined O2 does not dissolve in the
electro-lyte easily under the saturation state of O2nearby the sample
Pt electrode. In this situation, the time dependence of O 2
concentrationCðtÞwill be assigned by the diffusion equation,
CðtÞ ¼C0ðDO2tÞ
1=2,t>0, whereC
0 is the initial
concen-tration of O2 on the sample Pt electrode after the oxygen
adsorbing treatment, DO2 is the diffusion coefficient of
recombined O2 into the electrolyte. By using this rate
determining model, eq. (14) is rewritten as
E¼EþRT
2F ln
1=2
t1=4
; ð15Þ
1=2¼ ðO2C0Þ
1=2
ðaPtH
2OÞðDO2Þ
1=4; ð16Þ
where aPt
O2 ¼O2CðtÞ is substituted in eq. (14). The a
Pt H2O
should be constant (aPt
H2O 1) without the current flow
condition,i.e., the H2O is not produced by the reaction of
1=2O2þ2Hþþ2e!H2O. In eq. (15), means the
enhancement coefficient. As was recognized in Fig. 4, the experimental reduction curve of the 1st stage on the EMF behavior was in good agreement with this theoretical result by the diffusion model of O2. From the temperature
depend-ence of the EMF, we can obtain that the is 49 as an independent value on the temperature in this stage. The, as a function of the temperature, is 7.95 at 285.5 K, 6.74 at 295.2 K, 5.60 at 305.1 K, 3.82 at 315.3 K and 3.06 at 325.2 K. The enhancement coefficient (¼49) became very high compared with the equilibrium condition (¼1) in eq. (13). This is explained by the high O2concentration on/nearby the
Pt electrode, i.e., nPt
O2 , G¼n
Pt H2O
Pt H2O ðn
H2
H2
H2
H2þ
nPt O2
Pt
O2ÞandFE¼1=2½
Pt H2O ð
H2
H2þ=2
Pt
O2Þ. By using
the relation ðDO2Þ
1=2 from eq. (16), the activation
energy "DO2 of DO2 ¼D0expð"DO2=kBTÞ is evaluated as 0.4 eV andD0is1:4105from the Arrhenius plot, wherekB
is the Boltzmann constant.
4.3 2nd stage on the EMF behavior of the cell after the inflection point
In this section, we will analyze the 2nd stage on the EMF behavior of the cell after the inflection point. In this stage, the rate determining process will be due to the desorption process
Fig. 4 1st stage on the EMF behavior of the cell after the oxygen adsorbing treatment. The solid line is theoretical curve by the diffusion model of O2.
[image:4.595.311.541.74.264.2]of the O2 from the sample Pt electrode, because the
recombined O2 concentration become low sufficiently to
dissolve the O2into the electrolyte in contrast to the 1st stage.
In this situation, the time dependence of O2concentration on
the sample Pt electrode will be applied by using a random
desorption model of O2molecule on it. In this model, we will
note thatt0is the time at the inflection point,tf is the time at
the end of 2nd stage (for instance,tf ¼410s at 305.1 K),n0
andnf is the number of O2on the sample Ptelectrode at the
time t0 and tf, respectively. By using the relation of
G¼HTS, the free energy will be written as
Gn"kBTln½n0!=ðn0nÞ!n!; ð17Þ
in the random desorption model on the sample Ptelectrode. In the equation,"is the binding energy of O2on the electrode.
By using the Stirling’s equation, eq. (17) is rewritten to
Gn"kBTln½n0lnn0 ðn0nÞlnðn0nÞ nlnn:
Then, we can obtain the relation,
FE¼¼@ðGÞ=@n"kBTln½ðn0=nÞ 1:
In the eV unit,16)
E¼ "þkBTln½ðn0=nÞ 1; ð18Þ
whereF¼1eand the unit ofEis given by volt. To evaluate the time dependent of the EMF, we will write the number of O2 in an exponential form,
n¼Net=; ð19Þ
where N is the initial number of O2 on the sample Pt
electrode, and is the mean stay time of O2 on the
electrode.12)By using eq. (19), then
0overnratio is
n0=n¼et0==et= ¼eðtt0Þ=:
This ratio is substituted in eq. (18),
E¼ "þkBTln½expððtt0Þ=Þ 1; ð20Þ
whereis the enhancement coefficient as was mentioned in a previous section. The typical fitting curve at 305.1 K is shown in Fig. 5. The theoretical fitting curve given by eq. (20) was in good agreement with the experimental result as a function of time dependency of the EMF. From the temperature dependence of the EMF, we can obtain the"¼ 0:83eV as an independent value on the temperature in this stage,
¼280s at 285.5 K, 205 s at 295.2 K, 128 s at 305.1 K, 32 s at 315.3 K and 26 s at 325.2 K, where¼3is used as a best fit value. From the Arrhenius plot, the adsorption energy"ad
of¼0expð"ad=kBTÞis evaluated as0:53eV and0is
1:6107s. The enhancement coefficient(¼3) becomes
low compared with the last stage (¼49), but this is not equal to the equilibrium condition (¼1) in eq. (13). This means that the influence of recombined O2concentration on/
nearby the sample Pt electrode may remain a little. The
adsorption energy "ad (¼ 0:53eV) is close to the
calculated interaction energy5) for the bridge site bonded O2 molecule and/or 2O atoms on a linear Pt3 cluster at the
O2-surface distance of 0.2 nm. The inflection point in the
EMF behavior could have the following meaning:
¼tf t0, "adEtfEt0, " Et0. For instance, in a
typical case at 305.1 K,(¼128s) is equal to the difference
of tf (¼410s) and t0 (¼282s), "ad (¼ 0:53eV) Etf Et0 (¼0:19{0:86eV) and " (¼ 0:83eV) Et0
(¼ 0:86eV).
5. Conclusions
By using a gas controllable H2jHþelectrolytejPt cell, the
value of electromotive force (EMF) was measured as a function of lapse of time after an oxygen adsorbing treatment on the sample Pt electrode. The time dependence of EMF value decreased with a lapse of time, and classified into the three stages: The base stage is in the stable state with Ar bubbling, the 1st stage is from after the oxygen adsorbing treatment to the inflection point, and the 2nd stage is from the inflection point to the end of the stage. In the base stage, the value of EMF was discussed on the electrochemical theory by the O2 concentration on the sample Pt electrode. In the 1st
stage on the EMF behavior of the cell after the oxygen adsorbing treatment, the time dependence of the EMF behavior was explained by using the electrochemical theory on a diffusion model of the recombined O2on the sample Pt
electrode, because the recombined O2does not dissolve in the
electrolyte easily under the saturation state of O2nearby the
sample Ptelectrode, where Ptmeans the oxygen adsorbing
treated sample Pt electrode. The detailed analysis of this process showed that the activation energy "DO2 of DO2¼
D0expð"DO2=kBTÞis evaluated as 0.4 eV from the Arrhenius plot,D0is1:4105. In the 2nd stage on the EMF behavior of
the cell after the inflection point, the lapse of time of the EMF was interpreted by using a random desorption model of the O2 on the sample Pt electrode, because the recombined O2
concentration becomes low sufficiently to dissolve the O2 into the electrolyte in contrast to the 1st stage. We can
obtain the adsorption energy "ad (¼ 0:53eV) of ¼
0expð"ad=kBTÞ. We will propose the physical meaning
of inflection point in the EMF behavior as the mean stay time
¼tft0,"adEtf Et0, the binding energy" Et0.
[image:5.595.310.540.70.260.2]the adsorption energy of O2molecule on the Pt electrode has
been evaluated. This method will be powerful to investigate the electrodes on a fuel cell and a gas sensor.
Acknowledgment
The authors would like to thank Mr. M. Yashiro for supporting the experiments.
REFERENCES
1) H. Butt, K. Graf and M. Kappl:Physics and Chemistry of Interfaces
(Wiley-Vch, Weinheim, 2003) pp. 177–205.
2) R. Tilley:Understanding Solids(John Wiley & Sons, West Sussex, 2004) pp. 201–291.
3) J. Yoshinobu, T. Moriwaki and M. Kawai:Butsuri(Physics)53(1998) 350–354 [in Japanese].
4) K. Sawabe, Y. Matsumoto, J. Yoshinobu and M. Kawai: J. Chem. Phys. 103(1995) 4757–4764.
5) A. Kokaji, A. Lesar and M. Hodoscek: Chem. Phys. Lett.263(1997) 43–49.
6) J. E. Davis and C. B. Mullins: Surf. Sci.380(1997) L513–L520. 7) A. T. Capitano, A. M. Gabelnick and J. L. Gland: Surf. Sci.419(1999)
104–113.
8) L. K. Verheij and M. B. Hugenschmidt: Surf. Sci.324(1995) 185–201. 9) L. K. Verheij and M. B. Hugenschmidt: Surf. Sci.416(1998) 37–58. 10) E. Gyenge: Electrochmica Acta49(2004) 965–978.
11) A. Fujishima, M. Aizawa and T. Inoue: Denki Kagaku Sokuteihou
(Electrochemical Measurement Method) (Gihoudou, Tokyo, 1984) pp. 49–195 [in Japanese].
12) S. Harada: J. Phys. Soc. Jpn.54(1985) 430–437. 13) S. Harada: J. Phys. Soc. Jpn.68(1999) 1746–1750.
14) Y. Ishihara, S. Yamane, H. Yamazaki and H. Tsuge: J. Electrochem. Soc.142(1995) 2352–2357.
15) S. Harada: J. Phys. Soc. Jpn.58(1989) 2200–2206. 16) 1 eV =1:6021019J,k
B¼8:617105eV/K.