Monetary Development and
Transmission in the Eurosystem
Anton, Roman
HfWU - University of Economics and Environment - International
Management, Nürtingen-Geislingen, Germany
7 October 2015
Page | i
Monetary Development and
Transmission in the Eurosystem
An Evaluation of European Monetary Policy
Dr. Roman Anton
Nürtingen-Geislingen,
University of Economics and Environment
International Management
Nürtingen, Germany
Page | ii
We cannot solve our problems with the same thinking that created them.
The only real valuable thing is intuition.
Everything that can be counted doesn’t necessarily count;
Everything that counts can not necessarily be counted.
Albert Einstein
Banking Institutions are more dangerous to our liberty than standing armies.[…]The modern theory of the perpetuation of debt has drenched the earth with blood, and crushed its
in-habitants under burdens ever accumulating.
Thomas Jefferson
(Author of the Declaration of Independence, 3. US President)
It is well enough that people of the nation do not understand out banking and money sys-tem, for if they did, I believe there would be a revolution before tomorrow morning.
Henry Ford
(Founder of the Ford motor company, pioneer of industry production)
The Government should create, issue, and circulate all the currency and credits needed to satisfy the spending power of the Government and the buying power of consumers [and businesses]. By the adoption of these principles, the taxpayer will be saved immense sums of
interest. Money will cease to be the master and become the servant of humanity.
Abraham Lincoln
(16. President of the US, modernizer who fought slavery)
I have unwittingly ruined my country [with the Fed’s fractional banking system].
Woodrow Willson
Page | i Page | i
Abstract
Since the launch of the European Economic and Monetary Union (EMU) in January 1999 till
today in 2015, the Euro has ascended to become the second largest reference currency in
the world. With about €1.6 trillion of currency in circulation it is at present even positioned above the US dollar with €1.3 trillion. The Eurosystem now comprises 19 EU countries with
about 340 million people and inherits an outstanding role for the economy of the EMU,
world trade, and international finance. Despite its importance, a recent independent
empir-ical review that conclusively analyzes all key factors and efficiencies remains much
obso-lete. Thus, this research and review sets out to empirically-theoretically compile the last 16
years of the EMU with a focus on monetary developments, functioning of monetary
trans-mission channels (MTCs) and mechanisms, as well as the performance of the Eurosystem
and its ECB governed monetary policies (MP). For the first time it reviews a complete set of
16 MTCs and systematically evaluates the functioning of the Eurosystem and its role for the
real economy and its people. It finds a high efficiency loss in all MTCs related to fractional
reserve banking, excessive EU indebtedness, or legal frameworks such as MFI, financial, or
equity law. Scientifically, based on all data and results, there is no way to reach a different
conclusion and reminder that stresses the need, exigency and must to replace an
old-fashioned reserve banking system by digital full-reserve banking via monetary reform at the
earliest feasible date possible.
SEARCH TERMS
Monetary policy, monetary theory, EMU, European economic and monetary union,
re-search review, monetary developments, monetary transmission, ECB, Eurosystem, central
bank, EU, finance, inflation, HICP, correlation, VAR, forecast, empirical, reserve banking
Monetary Developments and Transmission in the Euro Area
Monetary System and Policy, Money Supply, and Real Economy in the Euro Area
— An Appraisal of Research and Efficiency of the Monetary Transmission Process —
NOTE: Figures, Tables, and Chapters are cross referenced throughout the work, so that the reader can jump
to the respective reference with a ‘mouse click’ on the link (the chapter number). The pdf document structure
Page | ii Page | ii
Abstract (German Translation)
Seit der Einführung der Europäischen Wirtschafts- und Währungsunion (EWWU), im Januar
1999 bis heute im Jahre 2015 ist der Euro zur zweitstärksten Basiswährung der Welt
aufge-stiegen. Mit einem Bargeldumlauf von über 1.6 Billionen Euro erreicht der Euro derzeit
so-gar ein höheres Geldvolumen als der US-Dollar mit einem Gegenwert von 1.34 Billionen
Euro. Das Eurosystem umfasst mittlerweile 19 EU-Mitgliedsstaaten mit einer Bevölkerung
von über 340 Millionen und spielt eine bedeutende Rolle für die Wirtschaft der EWWU, den
globalen Welthandel und für die internationalen Finanzströme. Trotz dieser großen
Bedeu-tung fehlen weiterhin umfassendere und unabhängigere empirische Studien und
Über-sichtsartikel, die alle Schlüsselfaktoren, aber auch die Effizienz des Eurosystems,
beweis-kräftig analysieren. Dieser Forschungs-Review versucht daher die letzten 16 Jahre der
EWWU empirisch, theoretisch und mit Hinblick auf die monetären Entwicklungen als auch
auf das Funktionieren Monetärer Transmissions-Kanäle (MTKs) und Mechanismen, sowie
der Geldpolitik (GP) der EZB aufzuklären. Zum ersten Mal werden alle 16 MTKs rezensiert
und die Performance des Eurosystems und der EZB nachhaltig und systematisch überprüft.
Ein hohes Maß an Ineffizienz konnte in jenen MTKs nachgewiesen werden, die mit dem
partiellen Mindestreserve-System in Verbindung stehen, sowie mit dem hohen
EU-Überschuldungsgrad, als auch anderen legalen Rahmenbedingungen, wie dem Bank-,
Ak-tien- und Finanzrecht. Daher erlauben alle Daten und Ergebnisse nur eine wissenschaftliche
Schlussfolgerung, dass eine vollständige Monetäre Reform benötig wird, um das partielle
Mindestreserve-System durch eine digitale Voll-Reserve zu ersetzen - so bald wie möglich.
SUCHBEGRIFFE (German Translation)
Geldpolitik, Monetäre, Theorie, Europäische Wirtschafts- und Währungsunion, EWWU,
wis-senschaftlicher Review, monetäre Entwicklungen, Transmission, EZB, Eurosystem,
Zentral-bank, EU, Finanzen, Inflation, Korrelation, VAR, empirische, Minimumreserve
Monetäre Entwicklung und Transmission im Euro-Gebiet
Geld-System und Geld-Politik, Geldmengen-Angebot und Real-Wirtschaft in der EWWU
Page | 1
Content
Abstract ... i
Content ... 1
Table of Figures ... 4
Table of Tables ... 6
Table of Formulas ... 7
List of Abbreviations ... 9
1 Preface of the Research Study ... 11
1.1 Preamble ... 11
1.2 Research Objective ... 13
1.3 Scientific Proceeding and Guide to the Research ... 14
2 Introduction, Background, and Monetary Policy Review ... 15
2.1 The ECB, the Eurozone and Eurosystem ... 15
2.1.1 Background on the Eurosystem and its Convergence Criteria ... 15
2.1.2 The Benefits, Functions and Policies of the Monetary Eurosystem ... 17
2.1.3 The Primary Objective of the ECB and the ESCB ... 18
2.1.4 Functions of Price Stability in the Euro Area ... 19
2.1.5 The Structural and Operational Framework of the Eurosystem ... 21
2.2 The Money of the Eurosystem ... 25
2.2.1 Characteristics, Dimensions and Types of Money ... 25
2.2.2 The Types of Depreciation of Money’s Purchasing Power ... 27
2.2.3 Money Creation and Monetary Aggregates in the Eurosystem ... 28
2.3 Research Theories of Monetary Policy and Monetary Transmission ... 33
2.3.1 The Classical Supply Side Theory, and Loanable Funds Model ... 35
2.3.2 The Neo-Classical Quantity Theory of Money (QTM) ... 35
2.3.3 Keynesian Economics and Liquidity Preference Theories ... 37
2.3.4 Friedman’s Modern Quantitative Theory of Money ... 38
2.3.5 The Keynesian IS-LM Model and the AD-AS Model ... 39
2.3.6 The Fisher Effect on Liquidity Preference and the Cagan Model ... 40
2.3.7 The Money Creation Multiplier ... 41
2.3.8 Monetary Transmission Channels (MTCs) and Theories (MTTs) ... 43
2.4 Empirical Monetary Policy Research... 49
2.4.1 Empirical Monetary Policy Theory ... 49
2.4.2 Normative Empirical Models and Empirical Theories ... 50
Page | 2
2.4.4 The Taylor Rule - A Monetary Rate Model ... 53
2.4.5 The Zero Nominal Lower Bound (ZNLB) and Liquidity Trap ... 54
2.4.6 Keynesianism, Post-Keynesianism, and New Keynesian Models ... 55
2.4.7 Monetarism and Neo-Monetarism ... 57
2.4.8 The Dichotomy of Keynesianism and Monetarism ... 57
2.4.9 Independent MP Research about the Eurosystem ... 58
3 Materials and Methods ... 61
3.1 Materials, Data Sources, and Software... 61
3.1.1 Databases and Data Retrieval ... 61
3.1.2 Software Tools ... 61
3.2 Statistical Methods ... 61
3.2.1 Arithmetic Mean, Standard Deviation, Standard Error of the Mean (SEM) ... 61
3.2.2 Pearson’s Correlation Test and Linear Regression Analysis ... 62
3.2.3 Stationary VAR Analysis ... 62
3.2.4 Residual and Data Autocorrelation ... 63
3.2.5 Engle’s ARCH (Autoregressive Conditional Heteroskedasticity) Test ... 63
3.2.6 Student’s T-Test (W. S. Gossett T-Test) ... 64
3.2.7 Net Present Value (NPV) ... 64
3.2.8 MCI (Monetary Condition Index Formula) ... 64
4 Analytical Research Review ... 65
4.1 A General Analysis of the Monetary Eurosystem ... 65
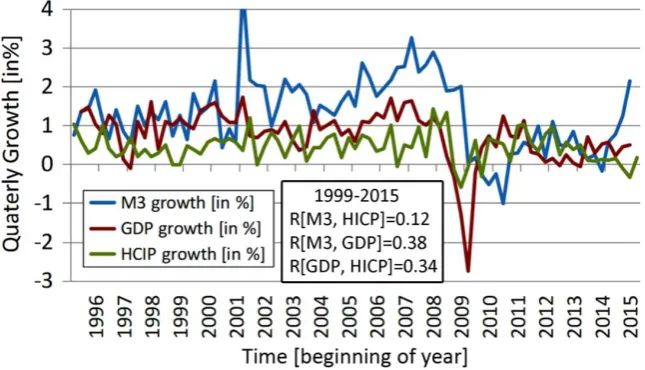
4.1.1 Inflation, GDP and Money Growth, and its Forecast for the Eurozone ... 65
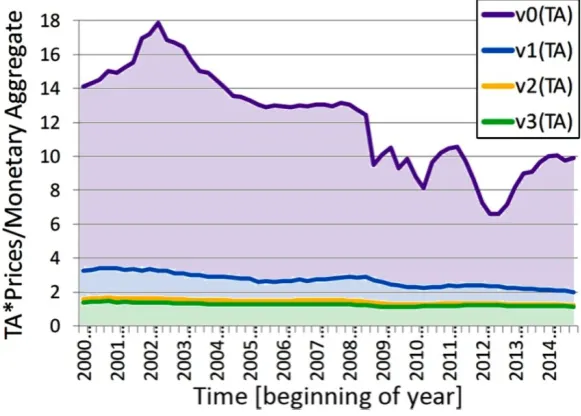
4.1.2 Velocity of Money in the Eurozone and its Impact on the Real Economy ... 74
4.1.3 The Money Multiplier and the ECB’s Control over the Money Supply ... 81
4.1.4 Real Money Balances in the Euro Area ... 90
4.1.5 Debt Generation in the Eurosystem... 93
4.1.1.1 The Case of the Greek Government Debt Crisis ... 97
4.1.1.2 The Case of the Luxembourg Private Debt Location ... 99
4.2 The ECB and Instruments of the Eurosystem ... 101
4.2.1 The Balance Sheet of the Euro-System from 1999-2015 ... 101
4.2.2 The ECB’s Instruments: Open Market Operations and Standing Facilities ... 105
4.2.2.1 Open Market Operation ... 105
4.2.2.2 Standing Facilities ... 106
4.2.2.3 Minimum and Excess Reserves of Credit Institution Current Accounts... 107
4.2.3 The ECB’s Crisis Management and its Strategic Dilemma... 107
Page | 3
4.3.1 Interest Rates in the Euro Area ... 108
4.3.2 Pass-Through and Interest Heterogeneity in the Euro Area ... 111
4.3.3 The Forex-Effect of the ECB’s Monetary Policy ... 121
4.3.4 Timing of the Money Effect - Implications for Monetary Policy ... 125
4.3.5 Decomposition and Quantification of ECB’s Monetary Policy ... 128
4.3.6 The Labor Effect of the ECB’s Monetary Policy ... 130
4.3.7 Main Output Trends of the Eurosystem: the EMU’s Economy ... 134
4.3.8 The Eurosystem’s Monetary Transmission Channels ... 135
4.3.8.1 MTC1: Real Interest Rate Channel (Traditional Effect) ... 135
4.3.8.2 MTC2: International Account, Fx-Trade-Capital Effects ... 137
4.3.8.3 MTC3: Keynes’ and Tobin’s Stock Market Channel ... 143
4.3.8.4 MTC4: Financial Wealth Channel (Asset View) ... 147
4.3.8.5 MTC5-9: Traditional Credit View ... 147
4.3.8.6 MTC10: Prospect View - Expectation Channel ... 150
4.3.8.7 MTC11: Money Multiplier Pre-Transmission Channel ... 153
4.3.8.8 MTC12: Monetarism Channel ... 153
4.3.8.9 MTC13: Governmental Channels ... 154
4.3.8.10 MTC14: Behavioral View ... 157
4.3.8.11 MTC15: Commercial Bank’s Channel ... 158
4.3.8.12 MTC16: Portfolio Channel ... 159
5 Conclusion and Discussion ... 163
5.1 Evaluation of the ECB’s MP: Towards a Stewardship of the Eurosystem ... 164
5.1.1 Price and Economic Growth Stabilization Policy ... 164
5.1.2 Empirically Founded Critique of the ECB’s Monetary Policy ... 165
5.2 Evaluations of the MS: Towards a Digital Full-Reserve System ... 167
5.2.1 The Requirement and Imperative of Monetary Reform ... 167
5.2.2 Proposition of Key Core Elements for Monetary Reform ... 171
5.3 Recommendations for Economic Actors and Traders ... 173
5.3.1 Understanding Monetary Transmission for a Better Forecasting ... 173
5.3.2 Updated Understanding of Monetary Transmission ... 174
5.4 Concluding Remarks ... 174
6 Appendix ... 175
6.1 Supplementary Figures ... 175
6.2 References - Bibliography ... 187
Page | 4
Table of Figures
Figure 1 Schematic Representation of the Three Dimensions of Money ... 27
Figure 2 Schematic Overview of Central Bank’s Definition of Monetary Aggregates ... 29
Figure 3 Monthly Annual Growth Rate of HICP, M3, and of GDP (Moving Average) ... 66
Figure 4 Money Aggregates M1, M2, M3, and Monetary Base M0 in the Euro Area ... 68
Figure 5 Vector Autoregression (VAR) Analysis of M3, GDP, and HICP Growth Rate... 70
Figure 6 Quarterly Growth Rates of HICP, GDP and M3 in the Eurosystem, 1995-2015 ... 71
Figure 7 Yearly Growth Rates of HICP, GDP and M3 in the Eurosystem, 1995-2015 ... 71
Figure 8 Money (M0-M3) Grows Faster than Inflation plus rGDP in the EMU ... 73
Figure 9 Income Velocities of Monetary Aggregates (M0-M3) and Real Income Velocities... 75
Figure 10 Transactions Velocity of Monetary Aggregates in the EMU ... 77
Figure 11 Co-development of Income Velocity and Quantity of Monetary Aggregate ... 78
Figure 12 Velocity of the Monetary Base and Inflation (HICP index) ... 79
Figure 13 Growth Rate of the Velocity of the Monetary Base and Adjusted GDP ... 79
Figure 14 Quarterly Growth of the Velocity of Money in the Euro Area, 1999-2015 ... 80
Figure 15 Chart of EMU Money Multiplier m1, m2, m3 (M1-3/M0), from 1999-2015 ... 82
Figure 16 Capacities of the Traditional Money Multipliers and their Utilization ... 84
Figure 17 Capacity of Money Multiplication as M0 in the Euro Area ... 86
Figure 18 Constancy of Mean Share of Money Aggregates (+SEM) from 1999-2015 ... 87
Figure 19 Trends of Money Aggregate Shares as % Deviation from Mean, 1999-2015 ... 87
Figure 20 Aggregate Growth of Monetary Aggregates Derived Money Multipliers ... 88
Figure 21 Money Balances in the Euro Area ... 91
Figure 22 Mean of Monthly Growth Rates of Real Money and its Aggregates ... 93
Figure 23 Credit Debt to Euro Area Residents is not Covered by M3 ... 94
Figure 24 Total Credit to Money (M3) Ratio as Macroeconomic and Crisis Indicator ... 94
Figure 25 Increasing Private and Public Indebtedness (as % of GDP), ESA95-based ... 95
Figure 26 Public and Private Debt (as % of GDP) by Euro Area Countries ... 96
Figure 27 Main Economic Indicators Time Series Analysis for Greece ... 98
Figure 28 Main Economic Indicators Time Series for Luxembourg (LOG) ... 100
Figure 29 Balance Sheet Assets and Liabilities of the Euro-System ... 101
Figure 30 Open-Market Operations: MRO and LTRO and Outright Operations ... 106
Page | 5
Figure 32The Eurosystem’s Current Account Covers Required and Excess Reserves ... 107
Figure 33 Interest Rates of the Short-term Money Market: Eonia and Euribor ... 109
Figure 34 Key Central Interest Rates in the Euro Area, 1Y-Euribor and 10Y-G-Bonds ... 110
Figure 35 Key Interest Rates of the Fed, ECB, BoE and BoC ... 111
Figure 36 Pass-Through Trend Development of 1Y-Euribor and 10Y-G-Bonds... 112
Figure 37 NDER for Households and Moving Weighted Average ... 115
Figure 38 NDER for Corporations Moving Weighted Average ... 115
Figure 39 Unweighted Average of EMU Member NDER for Households and Corporations116 Figure 40 Harmonized Interest Rates on 10-Year Government Bonds ... 117
Figure 41 Further Increasing Pass-Through Inefficiency and MFI’s ‘Profits’ in the EMU ... 117
Figure 42 Interest Rate Diversity for Corporations and Consumers in the Euro Area ... 118
Figure 43 Important Corporate Interest Rates and Mean (Fractional) Pass-Through ... 119
Figure 44 Fractional Pass-Through Trends of Financial Products in the Euro Area ... 119
Figure 45 Deviation and Extent Order of Pass-Through Rates ... 120
Figure 46 Major Euro Exchange Rate Developments from 1999 till 2015 ... 122
Figure 47The Fx Rate ($/€) depends on Real GDP but not on M2 (% of GDP) [US/EMU] ... 124
Figure 48 Long-term Interest Rates and Fx Rates in the Euro Zone and the US ... 125
Figure 49 DC Test for EMU M3, Inflation, real and nominal GDP (1999-2015) ... 126
Figure 503D Graph Indicating a ‘Recommendable Direction’ for the ECB’s MPs in 2015 .. 128
Figure 51 Reciprocity between the Growth Rate of the Velocity of the Monetary Base (v0) and the Seasonal Adjusted Unemployment Rate in the EMU from 1999-2015 ... 131
Figure 52 Unit Labor Costs and its Deviation from Wages and Labor Productivity ... 131
Figure 53 Correlation of v1, labor Productivity and Employment Rate ... 133
Figure 54 Price-to-Wage Ratios and the Velocity of Money ... 133
Figure 55 Chain-linked Development of Output Components and ‘The Big Ratios’ ... 134
Figure 56 Real Interest Rate and Pass-Through of all EMU Countries ... 136
Figure 57 The Effect Real Pass Through on GDP and Inflation ... 137
Figure 58 BOP Account Trends in the Euro Area (*estimation) ... 140
Figure 59 The EER-19 Fx Index and the Trade Balance ... 141
Figure 60 Net Lending/Borrowing of Households, Government, MFIs, and Non-MFIs ... 142
Figure 61 Cumulative Lending/Borrowing Affects Net External Debt and Assets ... 143
Figure 62Tobin’s Q Market-Cap of Listed Companies to Gross Fixed Capital Formation ... 144
Page | 6
Figure 64 Dependency of Q (WB derived) and MRO Central European Rate ... 146
Figure 65Tobin’s Q Theory of Investment in the Eurozone ... 146
Figure 66 The Equity Effect (Euro Stoxx50) on Consumption Expenditure in the EMU ... 147
Figure 67 Lending Activity to Corporations and Consumers Across the Euro Area ... 148
Figure 68 MFI Lending Activity with Corporations, Households, and Government ... 148
Figure 69 CAPM-derived Risk Premium in the EMU: NDER Yield Minus 1YG-Bond Rate .... 149
Figure 70 Economic Sentiment (ESI) and Confidence Indicators in EMU Countries ... 150
Figure 71ECB’s Expected Inflation Announcements for the Euro Area ... 152
Figure 72 Correlation of Deviation from Price Expectation and GDP Growth ... 153
Figure 73 Government Revenue and Expenditures in the Euro Area ... 155
Figure 74 The Marginal Propensity (MPCIS: MPC+MPI+MPS) Determines Output ... 157
Figure 75 Balance Sheet of Euro Area MFIs: 30 Trillion in Assets and Liabilities ... 158
Figure 76 Equity Funds Asset Portfolio Time-line ... 160
Figure 77 Euro Area Share Price Development as Portfolio Indicator ... 161
Figure 78 Total Market Capitalization (TMC) Portfolio Trend ... 161
Figure 79 EMU Monetary versus Equity Portfolio Trends ... 162
Table of Tables
Table 1 The Three Functions and Dimensions of Money ... 25Table 2 The Three Types of Money in the Eurozone ... 26
Table 3 Key Performance Measures of MP ... 33
Table 4 A New General Categorization of Relevant Monetary Theories ... 33
Table 5 Newly Completed Overview Table of Monetary Transmission Channels ... 44
Table 6 Normative and Empirical Models of MP... 51
Table 7 Correlation of Velocity, Employment, Labor Productivity and Wages Growth ... 132
Table 8 Dependency of Sectoral Sentiments with the Monetary Conditions Index (MCI) .. 150
Table 9Evaluation of the ECB’s MP: empirically founded critique ... 165
Page | 7
Table of Formulas
Formula 1 Central Bank's Money: Definition of Total European Legal Money ... 32
Formula 2 Monetary Base (M0): Definition of High Powered Money ... 32
Formula 3Mishkin’s Division of M0 in Borrowed and Non-Borrowed M0 (Base Money) ... 32
Formula 4 ECB Definition of the EU Monetary Aggregates ... 32
Formula 5Quantity Theory of Money (QTM) Equation and Fisher’s Amendment ... 36
Formula 6 Transactions QTM Equation and Velocity of Income at Equilibrium Level... 36
Formula 7 QTM Formula Integrating the Income Dependent Money Affinity Coefficient ... 36
Formula 8 Keynesian Liquidity Preference and Advanced Money Demand Function ... 37
Formula 9 Equilibrated Real Money Balance Formula ... 37
Formula 10Friedman’s Restatement of a Modern QTM Equation ... 38
Formula 11 The Basic IS-LM Formula: Income and Liquidity Preference Function ... 39
Formula 12 Fisher Equation and Liquidity Preference Effect ... 40
Formula 13 Cagan Model of Expected Inflation and Money Supply on Prices ... 40
Formula 14 Money Multiplier Integrated into the QTM Formula ... 41
Formula 15 Reserve and Currency Coefficient ... 42
Formula 16 Monetary Base using money Reserve and Affinity Coefficients ... 42
Formula 17 Generic Derivation of the Money Creation Multiplier... 43
Formula 18 Long-Term Real Interest Rate in Monetary Transmission ... 45
Formula 19 Monetary Effect on Foreign Exchange Rate under the Law of One Price ... 45
Formula 20 Keynes Interest Rate Parity Theorem and International Fisher Effect ... 45
Formula 21 Tobin's q Formula ... 46
Formula 22 Portfolio Money Demand Function ... 49
Formula 23Taylor’s Representative Monetary Policy Rule ... 53
Formula 24 Keynesian Fiscal Multiplier and Tax Multiplier ... 56
Formula 25 New Keynesian Phillips Curve and Intertemporal IS Relation ... 56
Formula 26 PPMCC - Pearson’s 2D Product Momentum Correlation Coefficient ... 62
Formula 27 Coefficient of Determination of Regression Analysis ... 62
Formula 28 p-lag VAR (Vector Autoregression) Model ... 63
Formula 29 Matrix Form of an n-Variate VAR(P) Model ... 63
Formula 30Null Hypothesis Test of Engle‘s ARCH Autocorrelation of Squared Series ... 64
Page | 8
Formula 32 Discrete and Continuous Riemann Net Present Value (NPV) Formula ... 64
Formula 33 MCI Formula (Monetary Conditions Index Formula) ... 64
Formula 34 Derivation of EMU Background Inflation (FRI) using Regression Analysis ... 67
Formula 35 Income and Growth Rate QTM Identity Formula ... 73
Formula 36 Product of Velocity and Money Multiplier (v0, real v0) ... 74
Formula 37 Velocity of Money as a Function of Turnover ... 75
Formula 38 Real Velocity of Money as a Function of Turnover ... 75
Formula 39Simplified Money Multiplier’s Capacity Formula ... 83
Formula 40 Real Money Balance Formula ... 90
Formula 41 A New Modern QTM Formula Comprising all Depreciating Property ... 92
Formula 42 Efficiency of Pass-Through of Interest Rates (EMU, 2006) ... 113
Formula 43 The APRC and NDER Formula (Council Directive Definition) ... 113
Formula 44 New Order of (Fractional) Pass-Through Stringency (based on Figure 45) ... 121
Formula 45 GDP Predictive Regression Function Based on Monetary Variables ... 128
Formula 46 Unit Labor Cost Dependence on Wages and Labor Productivity in the EMU .. 131
Formula 47 Balance of Payments (BoP) Identity, BPM6 Codification ... 139
Formula 48 BOP Accounting of the EMU (New SNA - IMF Standard of 2009) ... 140
Formula 49 The International Savings-Investment Gap is the Current Account Balance .... 143
Formula 50 The Fiscal Effect of Neutral Tax Spending ... 155
Page | 9
List of Abbreviations
AAR Annual Agreed Rate
ABSPP Asset Backed Purchase Program
ADAS Aggregate Demand - Aggregate
Supply
APRC Annual Percentage Rate of Charge
BIS Bank of International Settlement
bn Billion
BoC Bank of China
BoE Bank of England
c.p. ceteris paribus
CAPM Capital Asset Pricing Model
CBPP Covered Bond Purchase Program
CBs Commercial Banks
CD Certificates of Deposit
CET Commopn Equity Tier
CHIPS Clearing House Interbank Payment
Systems
CM Crisis Management
CRD Capital Requirements Directive
CRR Capital Requirements Regulation
DB Deutsche Bundesbank
DSGE Dynamic Stochastic General
Equilibrium Model
DST Dual System Theory
DT Deprivation Theory
EC European Sovereign Debt Crisis
ECB European Central Bank
ECSC European Coal and Steel
Community
ECU European Currency Unit
EEC European Economic Community
EIB European Investment Bank
EMU Economic and Monetary Union
EONIA Euro OverNight Index Average,
Euro OverNight Index Average
ESCB European System of Central Banks
ESI Economic Sentiment Indicator
ESM European Stability Mechanism
EU European Union
Euratom European Atomic Energy
Community
FC Financial Crisis
FDIC Federal Deposit Insurance
Corporation
Fed Federal Reserve System
FFR Federal Funds Rate
FOMC Federal Open Market Committee
FSCS Financial Service Compensation
Scheme
GDP Gross Domestic Product
GLF Greek Loan Facility
HICP Harmonized Index of Consumer
Prices
IFR Initial fixed rate
IMF International Monetary Fund,
International Monetary Fund
IS-LM Investment-Saving, Liquidity
Preference-Money Supply
IT Information Technology
LOLR Lender of Last Resort (Provider of
Liquidity)
Page | 10 m Million
M0 Monetary Base, Base Money
M1 Narrow Money
M2 Broader Money
M3 Broad Money
MBS Mortgage Backed Securities
MCI Monetary Condition Index
MECB Central Banks Money (e.g. Legal
Tender of the ECB)
MEI Monthly Monetary and Financial
Statisitics
MFI Monetary Financial Institution
MLF Marginal Lending Facility
MMF Money Market Fund
MNC Multinational Corporation
MRO Main Refinancing Operations
MS Monetary System
MTTs Monetary Transmission Theories
NCBs National Central Banks
NDER Narrowly Defined Effective Rate
NIIP Net International Investment
Position
non-MFIs all non-bank firms, institutions,
and the general public
NPV Net Present Value
OCT Optimal Control Theory
OMO Open Market Operation
OPPs Optimal Policy Projections
PA Principal Agent
PP Purchasing Power
PPP Purchasing Power Parity
PSPP Public Sector Purchase Program (of
ECB)
PT Prospect Theory
Q Quarter (Yearly Quater, 3 Seasonal
Month)
ROE
Return On Invest 89 RQFII
Renminbi-denominated Foreign Institutional Investor Program 99 RWA Risk Weighted Asset Ratio
SEPA Single European Payments Area
SIPS Systematically Important Payment
Systems
SME Small and Medium Size Enterprise
SMP Securities Markets Programme
TA Transaction
TMC Total Market Capitalization, Total
Market Capitalization
tn Trillion
ULC Unit Labor Cost
v Velocity of Money, also V
VAR Vector Autoregression
WACC Weighted Average Cost of Capital
ZLB Zero Lower Bound
Page | 11
1
Preface of the Research Study
1.1 Preamble
Money is at the very core of the economy as its most fundamental element. If the financial
markets are compared with the heart money is the liquidity that supplies all economic
or-gans, firms and households. Its supply also has to be tightly regulated to achieve optimal
conditions - like the right blood pressure and circulation - to maintain the body and many
more analogies can be found within ‘bionics of economics’. Too much money in the system
leads to inflation, too less makes prices fall: and both always impact the business cycle and
economic growth: deciding about many millions of job that are created or not in the EMU.
Finding the best trade-off or equilibrium is the purpose and objective of many monetary
policies (MPs), and every decision, and every lack of a decision, as well as the legal
struc-ture of the entire monetary system (MS) always has tremendous effects on new money’s
monetary transmission into all branches of the economy. This imperative makes MP,
mone-tary developments, and monemone-tary transmission very important for policy makers, the
econ-omy and all of its producing and consuming actors, and every other stakeholder who is
af-fected by it world-wide. The MS and its MP structure the financial and business sector and
have a more powerful and renewing impact on the economy than is usually believed today.
Since the formal introduction of the Euro in 1999, and its launch as daily legal tender in
2002, the European Economic and Monetary Union (EMU) and the European Union (EU)
both have benefited much from related economic, monetary, financial, and political
mech-anisms of integration, standardization and centralization. Billions of costs (up to €75bn p.a.,
estimate base on ECB data) are saved every year that now indirectly contribute to a higher
output potential (ca. 0.2-0.4% of GDP growth, p.a., estimate based on ECB data).
But the novelty of a common currency of a nationally diverse group of countries, which has
almost reached eye level as international exchange media with the world’s top valuta, with
€1.0 trillion Euro compared to €1.24 trillion US dollar, also poses some risks and challenges. Heterogeneities persist and a political fiscal union is still far-off while a sovereign debt crisis
(EC) has recently depreciated the Euro and delays a recovery from the financial crisis (FC).
Hence, an understanding of the EMU’s monetary and economic developments is crucial for
opinion building and informed rational decision making, for all economic participants:
in-cluding corporations, banks - in this study further referred to as commercial banks (CBs)
Page | 12
Basic facts and circumstances are among the most important and relevant ones to
under-stand the macroeconomic effects in the EMU. But they must cover all monetary
transmis-sion channel (MTCs) in play, and thus need to be systematic, comprehensive and scientific.
Scientifically - from a basic research perspective - it is already interesting to research the
multi-national Eurosystem, since it is a unique MS of a still new and first ‘supranational
monetary entity’ in the world. Integration and convergence in the EMU assessed from an
applied research perspective is also insightful and must aim at improving the
macroeco-nomic conditions, advancing MP operations and options to benefit the real (EU) economy.
In the last decades, Globalization has further interconnected the world, and the FC and EC
have revealed a high, and further ascending, level of international interdependency.
Ante-cedents of the Eurosystem have much connected it with the rest of the world (RoW), and
form the rudiment of the EMUs monetary, fiscal and economic aggregate researched here.
Europe’s monetary and political convergence and integration has significantly improved
price stability throughout the Euro area with its 19 member, and also in the EU of 28
mem-bers. Even beyond, the Eurosystem has also contributed to a lower global inflation rate.
During this time period, from 1999 on until today in 2015, the Eurosystem, managed by the
European Central Bank (ECB) and the European System of Central Banks (ESCB), had to get
through a number of serious financial shocks with stark economic impact, which originated
domestically and internationally, while price stability had to remain the ECB’s top priority.
After 16 years of this unique monetary union it is high time to scientifically understand how
well the EMU’s MSand the ECB’s MP are functioning and benefiting all European members and its people. How appropriate or successful has been the ECB’s MP and the legal
frame-works of the fractional reserve based Eurosystem, and its monetary transmission?
Ques-tions - that have been neglected by far for too long by MP research, reviews, or journalism.
To answer these questions the performance of the Eurosystem has to be truly assessed.
Hereby a vast extent of forms and functions of monetary transmission to be covered and
the question must always be ‘how efficient and effective’ is any MP deal for the economy. Hence, a broadly-analytical ‘research and review’ approach is chosen here. It shall provide
all-encompassing, valid, and graspable answers to the basic key questions that are
funda-ments to a conclusive and true understanding, and to see the big picture, in an unbiased
Page | 13
1.2 Research Objective
An independent scientific description of the Eurosystem and an assessment of its
perfor-mance must fulfill several criteria: it has to be comprehensive, systematic, illuminative,
conclusive, revealing, evaluative, but at once also must provide key facts in a graspable
way. In consideration of the extensive topic of ‘monetary developments and monetary
transmission in the EMU’ a new hybrid form of a research thesis is developed here that
follows a ‘chimera-strategy’ including a ‘long’ overview providing review to cover and
up-date all key topics, which is evenhandedly combined with newly conducted analytical
re-search that sheds more light into all key topics and estimates of MP and MS performance.
To achieve this mission the subordinate goals aim to illustrate, analyze and also to ‘reality
check’ still prevailing macroeconomic theories of today. Empirical research has to challenge
the ‘general economic believes’ that persist and dominate recent views. It has to reconcile and verify facts and theory to yield a correct and updated interpretation, in a businesslike
and scientific manner. Hence, several chapters are going to deal with the question of how
well existing models and theories explain monetary and economic data of the EMU, and
how well these data fit into our understanding of accepted stylized facts and coherencies?
Preparation, processing, comparing and compiling of basic-but-key time series records like
the monetary aggregates, lending activity, interest rates, economic growth as gross
domes-tic product (GDP) in real and nominal terms, and many more shall provide the basis to
un-cover the underlying power behind monetary approaches, to help advance their usage, and
to better predict macroeconomic conditions like markets, Fx, Nx, interests, or consumption.
This research aims to unveil financial and economic interdependencies in a qualitative and
quantitative manner, partly also in a spatio-temporal fashion to reveal dynamical states of
EU heterogeneities. Analytical frameworks and basic-but-key statistical procedures are
em-ployed to advance monetary theory (MT) and empirical research shall sharpen our view to
uncover the real coherencies and primary causes of a complete set of MTC effects. Finally,
the performance of the ECB’s MP and the MS of the Eurosystem is going to be assessed.
The highest culmination of relevant and impactful monetary research articles lies before
and around the introduction of the Euro, when consolidated data was still lacking. This
re-search objective makes the review unique and provides it with a special focus that seems to
Page | 14
1.3 Scientific Proceeding and Guide to the Research
The functioning of the monetary system impacts all of us, which is conspicuous for a
sup-posedly ‘dry subject’ most of us, even business experts, have not so much notice of, nor
sustained interest in. Nevertheless, this study is going to convey that the MS and its MP is
in fact one of the most relevant topics of our economy, culture, and political system. Its
legal settings still determine non-descript how property is distributed and re-distributed
EMU wide, even world-wide, as all fractional reserve banking system show high similarity.
Hence, it ‘should be’ really interesting and relevant for everybody, as all of our lives,
poli-tics, and ‘our countries’, and the EU, depend on it and are determined by it, in many ways.
Centuries have been strongly influenced by the monetary system and its transmission
mechanisms - involving CBs and other MFIs, which are still the main beneficiaries of
frac-tional reserve banking. The MS also sways the future of the EU, its economy and people.
MP research is an applied research and includes basic research, theory and empirical
re-search. To make the entire result content informative and graspable for a broader group of
readers the Introduction (see chapter 2) already ‘reviews’ a broad content of prevailing and
canonical MTs and macroeconomic theories, and comprises background information about
the MS and its money. It introduces the history and major structures of the EMU, its
proce-dures, fractional reserve banking, its legal instances, the ECB’s purpose and objectives. The
monetary aggregates are introduced, the two ways of money creation by the ECB and MFIs,
types and mechanisms of inflation and monetary transmission, as well as recent models.
The ‘Materials and Methods’ (see chapter 3) describe the statistical methods, universal
standard formulas, and software tools used. The ‘References’ are given in section 6.2, and a
fully detailed complete documentation of all results for all figures is found in section 6.3.
The main body of the ‘Analytical Research Review’ (see chapter 4) begins with a
retrospec-tive interpretation of time series analysis and correlations of the last 16 years. It analyzes
inflation, GDP, monetary aggregates, the velocity of money and its impact on output,
mon-ey multipliers and real monmon-ey balances, as well as debt generation in the Eurosystem,
in-cluding the special cases of Luxembourg and Greece, and the financial crisis (FC) and EU
sovereign debt crisis (EC). The Eurosystem’s time-dynamic balance sheet and ECB
instru-ments are reviewed and the euro area’s monetary transmission is newly categorized in 16
MTCs and systematically researched and modeled. The ‘Conclusions’ (see chapter 5)
Page | 15
2
Introduction, Background, and Monetary Policy Review
2.1 The ECB, the Eurozone and Eurosystem
2.1.1Background on the Eurosystem and its Convergence Criteria
The history of the European Union (EU), the Eurozone and its single currency - involving a
common monetary policy (MP) governed by the European Central Bank (ECB) - is globally
unique and outstanding. Its origin dates back to the European Economic Community (EEC)
founded 1957 by the Treaty of Rome, which amended to previous pillars the EEC, the
Euro-pean Atomic Energy Community (Euratom) and the early EuroEuro-pean Coal and Steel
Commu-nity (ECSC) of 1952. Already in 1962 the Commission of the EEC announced anew its
inten-tions, and common objectives, to establish the European Economic and Monetary Union
(EMU). It started its realization in 1989 (Scheller 2004) by applying a three stage strategy on
the basis of the Werner (1971) and the Delors report (1989). Interim hurdles to
implemen-tation of the EEC and the EMU were the delays caused by the collapse of the
Bretton-Woods Monetary Management System (1973), against the background of the oil crisis, and
the lack of defining consistent Europe-wide standards towards a sound fiscal and monetary
policy, also known as stabilization policy (Görgens et al. 2014). Then, the following German
reunification in 1989 and the disappearing political bisection in Europe re-catalyzed the
formation of the EMU again by allowing for the Treaty of the EU, known as the Maastricht
treaty of 1993 (EC 2012; Görgens et al. 2014). It still represents one of the most important
EU achievements that formally established the EU and EMU with a single common currency
(Görgens et al. 2014). The three capital stages to implement the EMU have been as follows:
(I) completion of the domestic market, common control and liberalization of
eco-nomic and financial policy (in 1990),
(II) a ban on (directly) financing public budgets with central bank’s money (in 1994),
and the establishment of a central bank precursor institution, the EMI (European
Monetary Institute), to prepare for the Eurozone and the ECB system, and stage
(III) the final introduction of the Euro, the ECB, and the EMU (in 1999). Of the 28
EMU member countries 19 have already successfully joined the Eurozone,
some-times also referred to as the ‘19 EMU stage-III members’.
The euro convergence criteria, also known as Maastricht criteria (ex-Art. 121 of the EC
EU-Page | 16
countries to be fulfilled and maintained, to technically qualify to join the EU monetary
un-ion. The criteria intent to support monetary and fiscal stability in five cardinal standards:
(1) A low level of inflation as measured by the harmonized index of consumer prices
(HICP), and in comparison to the unweighted arithmetic mean of similar HICP
infla-tion rates in those top three EU member states (that are not significantly below the
Eurozone average, p.a.) with the lowest HICP inflation plus a 1.5% tolerance margin
(first indent of Art. 140(1) prot. 13). (The Balassa-Samuelson-Effect is part of a
re-thinking of pre-union criteria for a more practicable ‘EMU-reference corridor’).
(2) Acceptable fiscal budgeting: annual deficit spending per Gross Domestic Product
(GDP) must not exceed 3% (second indent of Art. 140(1), 126).
(3) Gross domestic debt must not exceed 60% of GDP per fiscal year (Art. 140(1), 126).
(4) Applicant countries are obliged to maintain exchange rate stability by not
devaluat-ing the central rate of their Euro-pegged currency, and they must also adhere to
sound practices such as avoidance of any severe currency tension within the two
years of the respective convergence tests (EC 2012; third indent of Art. 140(1)).
(5) Low long-term interest rates: the unweighted arithmetic mean yield of 10 year
gov-ernment bonds (of three members with lowest HICP) may not be exceeded by 2%.
(Fourth indent Art. 140(1) of the Treaty, EC 2012, prot. 13).
Additionally, there are some other qualitative criteria that are not fully defined legally or
standardized in a quantitative manner. Together these measures shall achieve a higher
homogeneity in the community, in fiscal and monetary matters, and a sustainable
conver-gence, stability and monetary capacity. ‘Nominal convergence’ refers to the formal
Maas-tricht criteria and ‘real convergence’ refers to real economic structure (Görgens et al.
2014). At least once every two years but usually annually the ECB Council reports to the
Commission on the annual progress in its Convergence Report, as is specified by the Treaty
(European Commission 2012; Art. 140). Although the criteria are still authoritative some
have been slightly melted as members were facing difficulties to adhere during crises.
After four decades of setting the goal of a common currency the Euro was introduced on
January 1, 1999 in agreement with the cutting-edge Maastricht Treaty. The exchange rates
of the 11 first countries were fixed one day earlier and a European Currency Unit (ECU)
cur-rency basket was calculated in US$ to accommodate the varying quantitative contribution
Page | 17
The exchange rates of all members were fixed from 1999-2002 and operations to change
the legal tender, Euro coins and banknotes were launched three years later in January
2002. Some stage III euro members have also launched it months later (ECB 2015b).
Since its introduction the Euro has grown to become the world’s second largest reference
currency next to the US dollar with about one trillion of currency in circulation (US dollar ca.
€1.24tn). In subsequent years, eight additional EU-member countries have joined the euro area, the monetary union’s Eurosystem, the Eurozone, which now comprises a total of 19 countries with a 340 m people economy. It also plays an important role for stage I and
stage II members and in many EU overseas countries with EU-pegged currencies. Most
oth-er EU countries, especially the new memboth-ers, also peg their currencies in one way or the
other to the Euro and have improved their monetary stability ever since (ECB 2015b).
The EMU is still the most far reaching commitment strategy to European integration and
the common Euro with its reputation of secure prices became one of its key symbols.
2.1.2The Benefits, Functions and Policies of the Monetary Eurosystem
The establishment of the monetary union with 19 culturally diverse European countries, i.e.
third EMU stage member states, is being viewed as a unique and outstanding achievement
in world history. Key drivers of European cooperation and monetary unification have been
the improving economical competitive advantages of its national economies’ local factors:
(1) Significantly lower transactional costs (currency management, exchange and
hedg-ing costs) that can account for up to 1.5% of Eurozone-GDP (e.g. 150 billion p.a.,
2014, own calculation o.c. (ECB 2015a based)), termed frictional transactional costs.
(2) Less currency based distortion and volatility, as well as less risk in nominal exchange
rates and related uncertainty in planning, and less need for rescheduling and
mana-gerial efforts (totaling 0.4%-0.5% of GDP, derived from EMU trade (ECB 2015b)).
(3) Higher transparency and convergence of prices in the euro area, improved intra-
and extra-EMU competition and economizing, better utilization of resources and
processes and supply chain optimization (0.25% of GDP p.a., o.c., ECB 2015a based).
(4) Improvement in EMU-wide maintenance of price stability, monetary performance
and global monetary leverage based on political-legal commitment and ECB policy.
(5) Guaranteed long-term commitment to sound fiscal and MP in the euro area and
Page | 18
(6) Lower interest rates with the exception of the FC linked EC (EMU bond yield have
improved again to initial lows of ca. 2%, post ‘euro bailout fund’ of the International
Monetary Fund (IMF), the Commission, the EMS, and the ECB in addition to its low
interest MP) (ECB 2015a). Low interest rates intent to foster investment decisions.
(7) More tourism (ca. 6% o.c.) and cross border business, cluster formation, and so on.
All these benefits come at the cost of monetary autonomy and some limit to fiscal home
rule of the member countries - a political long-term commitment that provides internal
stability. To estimate the real costs of the monetary union the underlying risk portfolios are
to be considered that may account for potential occurrences of asymmetric shocks to
de-mand and supply, prices, debt, or interest rates of the individual member countries. If these
historically grown asymmetries (Cornelius et al. 2000) don’t converge they could provoke
shocks that unfold new costs and lower economic growth in the EU. Thus, ongoing
econom-ic, monetary, fiscal and political leadership are needed anew. The EMU is still new political
multi-national monetary entity. Its common destiny fuels the EU’s integration convergence.
Most MPs of the ECB are implemented by the European System of Central Banks (ESCB).
The ECB heads and governs the ESCB and serves as its umbrella organization (European
Commission 2012; Art. 8). Together they are the only legal provider of currency that serve
MFIs and safeguard the constancy of the Euro’s purchasing power, inside and outside of the
Eurozone (e.g. adjustments to the depreciation of foreign currencies). The stability of the
Euro is favorable to business in the euro area but also for world trade and world prices.
2.1.3The Primary Objective of the ECB and the ESCB
The primary goal of the ECB and ESCB is to maintain price stability in the euro area. Without
prejudice to this goal, it shall support the ‘general economic policies’ in accordance with Article 3 and 128 of the Treaty of the Union. Hereby it shall contribute to economic
stabil-ity, growth and development, e.g. via its MP operations, or by evaluating and reporting the
fulfillment of Maastricht criteria of the members states (Art. 127; European Commission,
2012). All of these MPs actions have to be in accordance with a free market economy (Art.
119, 127 of The EU Treaty) and intend to promote business growth and sustainable
eco-nomic development and stable prices to improve the competitiveness of the EU’s local
fac-tors (Porter 2008). The ECB must be consulted, or invited, on any proposed union act in the
pro-Page | 19
mote suitable coordination of all member’s economic policies. The meaning of ‘supporting
general economic policies’ comprises to achieve low interest rates, high employment,
eco-nomic growth, stability of the financial markets and sector, and exchange rate stability, in
an independent way, while keeping price stability unaffected. Although not explicitly
speci-fied legally, the official objective of price stability is to achieve an annual HICP price stability
of below but close to 2% (ECB 2015b). As money supply serves as nominal anchor of
medi-um term inflation and prices, the ECB has also set a M3 reference growth rate to 4.5% p.a.
(based on the expected inflation targets and a GDP growth of 2-2.5% p.a., as well as a ‘m
e-dium-term’ decline in the velocity of ‘M3 money’ per year of 0.5-1% (Council 1999).
2.1.4Functions of Price Stability in the Euro Area
It is widely accepted in the field of MP research, and thus also part of the ECB policy, that
stronger increases in the aggregate price level can become problematic at a transition point
when inflation or deflation exceeds ca. 2-3% per year. Although some MP theories claim, if
wages rise in tandem and proportional with price index increases, including nominal
inter-est rates, and keeping purchasing power (PP) hardly affected, inflation would theoretically
be less problematic. This might be the case for some of the new European stage III member
countries due to a consequence of the Balassa-Samuelson-Effect. But in general, the real
economy has to bear a cost if the PP of the Euro decreases. This is sometimes called
fric-tional ‘costs of inflation’ (Mankiw 2014; Walsh 2010; Friedman & Woodford 2010; Görgens
et al. 2014). Price stability, as maintained by the ECB (0-2% of HICP, and close to 2%), has
several fundamental advantages, which are widely accepted in economics (Mathews et al.
2013; Mankiw 2014; Illing 1997). They arise due to the absence of frictional disadvantages
of expected and real PP changes and comprise economic welfare and employment effects,
as well as fostering prosperity and growth potential by improving: (1) the transparency of
relative prices, (2) by economizing resource allocation and better informed consumption
and investment, (3) more cost-effective supply-chains, by advancing the conditions of
com-petition and by increasing the common market efficiency, (4) by stabilizing the welfare of
households, and (5) the robustness of domestic demand. In addition, (6) optimizing the
productive potential of the economy by lowering transactional costs, (7) reducing the risk
premiums of interest rates that are linked to expected inflation and thus investment and
consumption costs, and (8) by preventing relative distortions in nominally fixed contracts
Page | 20
avoiding ‘shoe leather’ and (10) ‘menu costs’, and (11) by preventing casual emergence of
potential disincentives for economic decision making and behavior, as well as (12) by
abol-ishing non-performance based relative redistribution of PP of the respective currency, (13)
causing delays and distortion in Fx rates, and (14) reducing uncertainty and planning
relia-bility that is divesting general monetary convenience (ECB 2004; Mankiw 2014; Mathews et
al. 2013), and (15) less the different rigidities in prices and wages. Several mechanisms
ex-ist to minimize the costs of inflation like index coupled wages, taxes, prices and rates.
Especially in the Eurozone sound macroeconomic conditions and low inflation helps to save
more translational costs then elsewhere, due to the ongoing need of convergence and
inte-gration of variant economies to from one attractive market, also for inflow investment.
The history of inflation in euro area countries shows a strong trend towards equalization
with low and very low inflation rates, also prevailing cumulatively. PP stability has much
improved from 1999 when the Euro was introduced till today (Eurostat 2015). Price stability
has ameliorated since also due to the deep-seated objective to meet the convergence
crite-ria (see 2.1.1). This was further underpinned by the subsequent introduction of the Single
European Payments Area (SEPA) in 2008/2010/2014 with its 28 national members
(includ-ing also nearly all pre-euro stage I and II members), the global price level trends, and the
common currency exchange rate (Fx) effects. The SEPA, for instance, betters the cost
rela-tion and cumulatively lowers or maintains prices stability. This might also help balance the
HICP index in the EU, including stage I and II countries that catch up to meeting the
Maas-tricht criteria due to economic incentives. The HICP standard is a Laspeyres type price index
and weighted by the relative aggregate of expenditures of households for covered products
per country, but doesn’t include business investment and governmental spending.
Not-withstanding, GDP deflators similarly depict a trend towards price stability (Eurostat 2015).
Nevertheless, if we look at the relative cost of living, the price levels and its annual changes
in euro area countries several asymmetries and differences persist. Again, the
Balassa-Samuelson effect helps explain why arbitrage mediated purchasing power parity (PPP) is
not directly and immediately reached in the EMU: The Euro area consist of richer and
poor-er countries, because of the variable productivities, respective PPPs and price divpoor-ergences
of mainly ‘non-tradable goods and services’. Heterogeneous inflation can be a result of
di-verging productivity kinetics (Görgens et al. 2014; Balassa 1964; Samuelson 1964). These
Page | 21
fact that tradable goods orient towards the world prices and global price standards of
world trade. Increased international price competition and a bigger total pool of traded
products and intermediates, and intensified global supply chains, also keeps EU prices
con-stant. The effect also predicts, that prices of ‘non-tradable good and services’ will increase
faster. This leads to a slightly higher inflation in those catching-up EU countries that today
still exhibit a lower GDP per capita (Görgens et al. 2014; Balassa 1964; Samuelson 1964).
2.1.5The Structural and Operational Framework of the Eurosystem
The Eurosystem, with the ECB and the national central banks (NCBs) that together form the
European System of Central Banks (ESCB), is unique in the world but its architecture,
pro-cesses, and structure resemble the U.S. Federal Reserve System (Fed), the Bank of England
(BoE), and also the Deutsche Bundesbank (DB), among all other central banking system that
seem to have served as a standard. This similarity facilitates a high level of comparability.
The headquarters (HQs) and Executive Board of the European Central Bank being located in
Frankfurt (a. M.), in southwest Germany, is headed and led by the ECB’s ‘Governing
Coun-cil’, which is made up of six members: the president, the vice president, four council
mem-bers, and the directors of all national central banks (NCBs). The ECB’s Council is the
su-preme making body of the Eurosystem (Scheller 2004; ECB 2015b). Its
decision-making is based on the majority principle built on an intra-Eurozone currency-weighted
representative ‘rotation system’ (ECB 2015b; EC 2013). The Council governs the MP in the
EU together with the NCB as the heart piece of the Eurosystem (Scheller 2004; ECB 2015b).
Its legal framework is given in Art. 127 of the EC Treaty and the Statute of the European
ESCB and ECB (EC 2012; EC 2003; EC 2013). This has led to the world’s highest
independ-ence index (CBI: ECB 0.83 > Fed 0.51) for the ECB in 2003 (Crowe & Meade 2008; Mathews
et al. 2013) and is a very significant improvement of the mean CBIs of euro area members.
Admittedly, so called independence of central banks doesn’t mean it is not led by private
and political interest groups: e.g. the Fed is even officially semi-private and the ECB is also
very likely to be influenced by politics and MFIs, but final prove is often missing for this
widely found assumption. Additionally, independence of central banks can be, and is found
to be, harshly criticized as undemocratic (Mathews et al. 2013), and to asymmetrically
privi-lege only CBs and other MFIs at the expense of all economic actors, a lacking mandate for
Page | 22
Still, central bank’s independence is widely thought to benefit price stability and this
hy-pothesis can be much supported by correlations that are widely found (Mathews et al.
2013; Mankiw 2014; Friedman & Woodford 2010). Following this theory, the ECB’s and
ESCB’s independence is much conductive to maintain price stability and includes: institu-tional, personnel, financial (e.g. separated from the EU budget), and functional autonomy.
Only specific and even negligible earnings (e.g. a surplus on interests paid, and earnings
that may arise from coining money, etc.) are paid to the European government. From a
business point of view the ECB is not very profitable for that it may print money. Theories
that suggest profitability as indicator of functionality would judge it as clearly dysfunctional.
Albeit some underlying links to the government may remain, these are still customary to all
central banking systems in the world (Mathews et al. 2013). For example, the members of
the ECB Executive Board are appointed by the European Council for a maximum of eight
years. They are selected by the political Heads of State of the 28 EU member countries in
accordance with the euro-area related political principles of occupation. However, the legal
framework of the ECB and its Executive Board, backed by the European Court of Justice,
shall still assure their independence in general and legal terms: for instance no
governmen-tal body in the EU or elsewhere may instruct or direct the ECB/ESCBs MP decisions (Article
130 of The Treaty) to not adhere to its general tasks specified in Art. 127, 133, and 138 (EC
2012). Or, exchange rate MP is headed by the Council of Finance Ministers (Svensson 1999).
The ECB has several means and tools to regulate the money supply, interest rates, price
stability, and to also indirectly enable GDP growth (ECB 2013b; Neyer 2007). Most
opera-tions and instruments involve the sector of the commercial banks (CBs) and other MFIs
(Neyer 2007). Money creation is a two step procedure: the primary money creation by the
ECB is subsequently amplified by the MFIs in a privately owned and of course much more
powerful secondary (book) money creation network strategy (DB 2015). The CBs and other
MFIs thus represent the only relevant interface and instance of the ECB with the real
econ-omy and is also often privately managed and much ‘out of ECB control’. Most new money is
released into the economy in the form of new debt that has to be repaid to MFIs that are
allowed to retain the principal on top of the interests as earnings, while only a 1% fraction
of reserves has to be temporarily deposited with the NCB’s accounts (DB 2015). Thus, MFIs
are the main part of the money creating sector, which poses many risks and principal agent
incorpo-Page | 23
rated (privately owned by majority stake), or led. This money creation is often referred to
as ‘private money creation out of nothing’, or ‘out of thin air’, or in the scientific literature
‘check, book, MFI’s (DB 2015), or virtual money creation’.
This way the secondary ‘MFI and CB money creating sector’ almost solely regulates the
to-tal supply of new money that is released into the economy and also the money stocks (with
the exception of outright transactions and QE introduced later in this chapter). The
behav-iors of CBs and MFIs is thought to be only influenced by the economic incentives given by
the market and the ECB’s key European rates and MP operations (DB 2015; ECB 2015b;
Neyer 2007). However, how much market forces are really at work remains to be measured
and proven and is elusive until today. The ECB is intended to only adjusts MP operations to
indirectly influences the behavior of MFIs and CBs with respect to their lending activity,
setting of effective interest rates, managing the currency in circulation, reserve accounts,
market and repurchase agreements, and alike. Noteworthy, CBs and other MFIs are often a
private decision-making instance that also sets the pace and intensity of transmitting the
ECB’s MP actions. Thus, MP actions are only as efficient and effective as the banking market
- a much forgotten scientific topic that is evaluated in this analytical review.
A professionally-effective legal overview of the ECB’s instruments and operational
frame-work are given by the ‘guidelines of the ECB’ (ECB 2013b; EC 2013) and the ‘Statute of the
ESCB’ (EC 2003), according to Article 8 of The Treaty (EC 2012) and is reviewed (Neyer 2007). They precisely define the legal MP instruments, tools, approaches and operations
that the Eurosystem has at its disposal - most of which are factually in practical use. The
following list summarizes in detail the full scope of ECB MP actions at hand to meet its
op-erational targets, such as the quantity of money in circulation and development of
mone-tary aggregates, and to set and signal the bank call rate, and long term rates (ECB 2013b):
(1) Open market operations (OMO): the purpose of MP actions comprising OMOs are
initi-ated by the ECB is to steer interest rates, to manage liquidity in the market, and for
communication policy to ‘single the MP stance’. Its five instruments are specified as:
(1.1) Reverse transaction (repurchase agreements, collateralized loans, liquidity means)
(1.2) Outright transactions (open market transactions for eligible assets, structural)
(1.3) Issuance of ECB debt certificates (to create liquidity shortage, via ECB obligations)
(1.4) Foreign exchange swaps (Art.127+219, intervention, ERM2/ECOFIN, spot/forward)
Page | 24
They are executed as standard tenders, quick tenders or bilateral procedures. With
re-gard to the type of their procedures they can be categorized as follows (ECB 2013b):
(a) Main refinancing operations (MRO, these include reverse transaction with a one
week maturity and frequency, and the NCB standard tenders).
(b) Long-term refinancing operations (including reverse transaction with a three-month
maturity and a monthly frequency, and the NCB standard tenders).
(c) Fine tuning operations (these are ad hoc measures at the end of the two week
re-serve maintenance period, reverse transactions, foreign exchange swaps, collection of
fixed-term deposits, NCB quick tenders, and bilateral procedures, by the ECB council).
(d) Structural ESCB operations (reverse open market operations, standard tenders that
are non-regular and not standardized a priori, NCB vis-à-vis the financial sector type).
(2) Standing facilities: overnight liquidity management with NCBs, pre-specified interest
rate against eligible assets, EMU wide terms, (and: bilateral standing Swap Fx lines).
(3) Minimum reserves: a legal requirement for credit institutions to hold minimum
depos-its on accounts with NCBs (European Commission 2003; Art. 19), which is to be uniform
throughout the euro area and in the respective NCBs. It can be used as a link-up and
stabilization tool in MP to influence borrowing, interest rate, check money creation and
the overall money supply. Currently, the MFI’s minimum reserve base rate is only 1%
(1999-2011: 2%) and includes overnight deposits, deposits of up to two years, and
ma-turity of also up to two years, and money market papers. Minimum reserves are based
on the CB’s monthly balance sheet’s ‘liabilities with reserve requirements’ (ECB 2015b).
The ‘central rates’ are the pivot regulators and parameters of many of these MP
instru-ments of the ECB. They are referred to as ‘the rate of marginal lending facility (MLF)’ (this is
the rate for overnight liquidity from the central bank), the ‘main refinancing operations
(MRO)’ (fixed rate; one-week liquidity providing MROs, LTRO rates orient on the MROs but can deviate), and the ‘deposit facility’ (the rate of overnight deposits with the central bank).
Although financing of national budgets is prohibited, quantitative easing (QE) in the form of
buying long-term government bonds is not explicitly forbidden in the treaties, e.g. if they
are not bought directly from a member country but from an ‘investor’ of the secondary
market, which are often mainly MFIs and other central banks, and to a lesser extent other
private investors. QE is often an outright transaction (see point 1.2). Such transactions