Munich Personal RePEc Archive
Multidimensional Poverty Mapping for
Rural Pakistan
Hameed, Abdul and Padda, Ihtsham ul Haq and Karim,
Shahid
Federal Urdu University of Arts, Science and Technology ,Islamabad
and Innovative Development Strategies (Pvt.) Ltd, Federal Urdu
University of Arts, Science and Technology, Islamabad, Department
of Geography, Government College University, Lahore
15 December 2016
Online at
https://mpra.ub.uni-muenchen.de/85022/
1
This paper has been presented at 1st International Conference on Business, Economics, & Education Management – ICBEM Organized by Institute of Business Administration
Sukkur, December 15-16, 2016.
Multidimensional Poverty Mapping for Rural Pakistan
Abdul Hameed1, Ihtsham ul Haq Padda2, Shahid Karim3
Abstract
This paper estimates and maps the multidimensional poverty for rural Pakistan. It uses micro
data from household surveys to construct the Multidimensional Poverty Index (MPI) with
human development indicators like education, health, standard of living and wealth.
Furthermore, it identifies multiple deprivations at individual level contributions in education,
health, standard of living and wealth in the rural multidimensional poverty as overall and
district levels. The results show that the 59 percent rural population of Pakistan is poor. The
district Thatta, in Sindh, district Dera Ghazi Khan in Punjab and the district Nowshera in the
KPK record highest multidimensional poverty index. No district is included from Baluchistan
due to unavailability of data. It is expounded that the policy makers can develop the strategies
to reduce the rural poverty by enhancing rural education, improving living standards and
creating opportunities for income.
Keywords- Multidimensional poverty, Education, Living standard, Wealth, Rural Pakistan
JEL Classification: D10, I10, I20, I32, R20
1
Federal Urdu University of Arts, Science and Technology ,Islamabad and Innovative Development Strategies (Pvt.) Ltd, hameedleghari@gmail.com
2
Federal Urdu University of Arts, Science and Technology, Islamabad, ihtsham91@yahoo.com
3
3 | P a g e
1. Background
Poverty is the key problem in the developing countries. There are different ways to assess the
poverty which can be separated into two broad categories: absolute poverty and relative poverty
(Fry, Firestone, & Chakraborty, 2014). Absolute poverty means individual or group can be said
to be in poverty when they are deprived of income, education, living standard and other
resources that needed to acquire the condition of life (International Poverty centre, 2006) and
relative poverty means individual or groups lack of resources when compared with other
members of the society (Foster, 1998).
The effects of poverty are mostly interconnected to each other. For instance, sanitation, clean
drinking water problem yield different types of diseases, poor community suffer from
discrimination, crime, homeless children etc.
The authorized poverty statistics describe that 29.5 percent Pakistani is below the poverty line it
means 60 million out of 180 million population in Pakistan living below the poverty line of
Rs3030 per capita per month. The earlier measure of poverty „Consumption base‟ used by the government of Pakistan was totally unrealistic. Now, Pakistan has changed its poverty line
Rs.3030 which is consumption base. It is almost equal to $1 dollar per capita per day in 2016.
According to the World Bank standard around 52 percent of the population is living below the
poverty line (Suleri, 2016).
The same situation exists with the rural poverty, official statistics, poverty in the rural area has
gone down from 39 percent in 2001-02 to 28 percent in 2005-06 (Pakistan,2006), but some
researchers and studies argue that rural poverty has not gone own as much as shown in the
4 | P a g e
Unfortunately, the historical official poverty statistics count through the unidimensional methods
and politically motivational instruments leads the confusion and cannot help in understanding the
common man living situation. The methods do not even tell why this poverty is prevailing?
Which are of Pakistan is suffering more from poverty? Are the causes of poverty same for
different areas of Pakistan? Which policies will alleviate deprivation in which dimension of
poverty (Salahuddin & Zaman, 2012).
Major components of poverty reduction are education, health, living standard and wealth
(Wlodzimierz & Okrasa, 1999). Education and health are the part of human capital which
enhance the productivity and contribute the economic growth and reduce the poverty at
individual and community level (Naveed & Islam, 2012; Afzal, et al. 2012). Wealth is the
significant aspect to absorb different types of risks and shocks, i.e. unemployment, inflation,
natural disasters, health hazards etc. these may sometimes push the household into long term
poverty (Krishna, 2011; Arif & Farooq, 2014). Living standard is also important factor that
contribute to overall derivations faced by multidimensional poor households (Naveed & Islam,
2012) .
In contrast to absolute or unidimensional poverty results. Multidimentional poverty incorporates
deprivation not only in the income/wealth, but also other socioeconomic factors like education,
health, and living standard. Therefore, this study is important as it gives multidimensional
poverty indexes at district and country level for rural Pakistan. It also maps the deprivation in
education, health, living standard and wealth using the household survey of Pakistan Strategy
Support Program (PSSP, 2012).
The study findings will be important to the policy makers since expanding on the issues that
5 | P a g e
require policy formulation to strengthen the economic development. This study is of great merit
to researchers, since it can provide a room for further research; provide researchers with rich
information in developing their research in the field of poverty reduction. To the community and
more especially to the policy makers, the findings may help in encouraging local government to
get economically empowered by embracing the factors stimulating their economic empowerment
at household or community level.
The remaining of this study is as follows: Section 2 discusses materials and methodology.
Section 3 gives study results, along with descriptions and inferences. Last section concludes the
study, and provides suitable policy implications.
2. Materials and Methodology
2.1 Data Sources
This study uses household data which collected by Innovative Development Strategies, Pakistan
(IDS) under the Pakistan Strategy Support Program (PSSP), which is funded by the United States
Agency for International Development (USAID). The Rural Household Survey (RHPS, 2013)
was conducted in the rural areas of Punjab, Sindh and Khyber Pakhtunkhwa (KPK) provinces of
Pakistan. The fourth province, Baluchistan is not included due to unavailability of data.
The survey was administered in 19 districts. Which included, 12 districts from Punjab, 5 districts
from Sindh and 2 districts from KPK. Due to some outliers and availability of limited variables
of interest, this study uses 1936 out of 2090 household‟s data. However 154 households with missing values of one or more dimensions were excluded from the analysis. The distribution of
sample is reported in Table -1.
Table 1: sample distribution
Provinces N
6 | P a g e
Punjab 1,244
Sindh 487
N 1,936
Source: Survey data
2.2 Methodology
This study uses Alkire-Foster (AF) methodology by (Santos & Alkire, 2011). The major beauty
of this method is that this is flexible and can be used with the different dimensions, indicators,
weights and cutoff points for the poverty measures. This study uses the four dimensions. These
dimensions are associated with the minimum satisfaction level and deprived cutoff based on the
[image:7.612.66.550.502.724.2]Millennium Development Goals (MDGs).
Table 2 shows that MPI consists of eleven indicators: two for education, two for health, five for
living standard and two for wealth. Table 2 also shows four dimensions of MPI divided into
equal ¼ (0.25) weights. Further, each dimension weight is divided into the individual indicators,
i.e. education weight 0.25 divided into two parts (0.25/2=0.125) one for “No one has completed five years of schooling” (0.125) and the second “at least one school-age child not enrolled in school” (0.125). The sum of all indicator weights equal to 1.
Table 2: Indicator wise cutoff points and weights
Dimensions Weight Poverty cutoff points Score
Education 0.25 No one has completed five years of schooling 0.125
At least one school-age child not enrolled in school 0.125
Health 0.25 At least one member is malnourished 0.125
One or more children have died 0.125
Living
Standard 0.25
No electricity 0.050
No access to clean drinking water 0.050
No access to adequate sanitation 0.050
The house has a dirt floor 0.050
Household uses “dirty” cooking fuel 0.050
Wealth 0.25
The household has no one household asset; air cooler, Fridge, freezer, car, computer, tractor, thresher, Generator and tube-well
0.125
7 | P a g e
commercial plot
Total 1 1
2.2.1 MPI dimensions and indicators description
The MPI dimensions and indicators descriptions are as follows:
Education: having no household member who has completed five years of schooling and
having at least one school-age child (5 to 18) years old who is not attending school.
Health: Health dimension consists of two indicators one is at least one member is
malnourished. Malnourished obtained through the Body Mass Index (BMI) of women‟s and
second one or more child under the 0 to 5 years old died.
Living Standard: not access of electricity, clean drinking water, adequate sanitation.
Using “dirty” cooking fuel (dung, wood or charcoal) and having a home with a dirt floor.
Wealth: wealth dimension consists of two economic resilience indicators one is “owning
no nine household assets like air cooler, fridge, freezer, car, computer, tractor, thresher, generator
and tube-well and other is household has less than two acre agriculture land and no commercial
plot.
2.2.2 Methodology step- by- step
Step (1): Data sheet prepared according to the basic human life indicators. This is to determine
whether a person or household is deprive or not (Yes & No).
Step (2): After the identifying household deprived or not. Multiplied each indicator with the
8 | P a g e
Step (3): If the sum of individual person or household deprived score is equal to 40 percent4 or
more of possible deprivation. The person or household considered to be multidimensionally
poor.
Step (4): Multidimensional poverty index (MPI) or Adjusted Head Count Ratio (M0) calculated
by:
Where:
H: represents headcount ratio
A: represents intensity of poverty which is also called average poverty
Further headcount ratio and average poverty measured by:
Where q is the number of people who are multidimensional poor and n is the total population.
∑
Where ∑ deprivation sum of scores and q is the number of multidimensionally poor.
Step (5): Finally, decomposition technique at the geographical (district and State) to
identifying the individual indicator contribution in the MPI. For this technique Censored Head
Count Ratio (CH)5 used to estimate the individual contribution in MPI. The censored head count
4
This paper followed the 40 percent deprived score because to compare the current study with the past studies like (Naveed & Islam, 2012). Which used 40 percent deprived score for the identifying current MPI status.
5“Censored head count ratio means; A Household 1 is deprived in two indicators: the household has experienced a
child death and it cooks with dung, firewood or charcoal. However, the sum of these weighted deprivations is 22 per cent, not 40 per cent. Thus, this household is identified as non-poor. Its deprivations are not counted in the MPI; the household is included in the headcount ratio (H) only in the denominator, as part of the total population,
but not as poor, and its 22 per cent deprivations are replaced by “0” in the intensity (A). This is the censoring
9 | P a g e
ratio easily achieved the sum of people who are poor and deprived in the respective indicator and
divided by the population and multiplied by the respective weights. It can verified as follows:
Where:
: is each indicator weights
: is censored headcount ratio of each indicator
MPI each indicator contribution formula is as follows:
3. Results
The analysis of this study carried out from the given aforementioned data. The results of
this study split into descriptive statistics and inferential statistics;
3.1 Descriptive Statistics
This section reviews key variables which are used in the inferential analysis to construct the
multidimensional poverty index. Living conditions and dwelling is the non- monetary procedures
of poverty and wellbeing. These all are closely linked to the household income and poverty.
Further, health and education are strongly related to the labor productivity, as a results, these are
closely linked to economic growth and socioeconomic development (Filipi & Gjergji, 2014).
The figure 1 gives the information about the first dimension (Education) of MPI. The figure 2
shows that there are only 26 percent rural households where as at least one household member
has completed five years of schooling and 50 percent rural household‟s school going children still going to school. The figure 2 gives the information about the second dimension (Health) of
10 | P a g e
rural households and 2.9 percent rural households are those whose one or more child under the 0
to 5 year of age has died.
Figure 1: Rural Household Education Status
Figure 2: Rural Household Health Status
The figure 3 to 8, provides the information about the 3rd dimension (Living Standard) of MPI.
The figure 3 shows that main dwelling structure material in the rural households. Household
26
50 74
50
0 10 20 30 40 50 60 70 80
No one has completed five years of schooling
school-age child going to school
Education Indicators
Yes No
29
3 71
97
0 20 40 60 80 100 120
At least one member is malnourished One or more children have died
Health Indicators
11 | P a g e
structural material is the proxy of living standard and the representative of the quality of life.
These standards also help to understand who is poor and who is non-poor (Eurostat, 2013)6.
Figure 3: Main Dwelling Material Categories in the Rural Household
Source: Survey Data
In the 21st Century sanitation is the important target and the agenda of the Millennium
Development Goals (MDGs). The purified drinking water and the proper sanitation are the basic
[image:12.612.120.492.140.373.2]needs for the every humankind on the earth (Mairena, 2008).
Figure 4 shows that the 49 percent of rural households used flush latrine and only 11 percent of
rural households have a dry pit latrine facility. The figure 4 also shows that 40 percent
households in the rural Pakistan have not latrine facility and they use open fields or bush area in
the 21st Century. The figure 5 shows that the 38 percent of rural households have not drainage
6
http://ec.europa.eu/eurostat/statistics-explained/index.php/Quality_of_life_indicators_-_material_living_conditions#Material_living_conditions_in_the_context_of_quality_of_i
fe
63.7
31.0
3.4 1.8
0.2 0.0
10.0 20.0 30.0 40.0 50.0 60.0 70.0
Mud Cement Tiles Chips Bricks
Per
ce
n
tage
12 | P a g e
system, only the 7 percent of rural households have piped linked with cement/brick drainage
with covered system, 17 percent of rural households have piped linked with cement/brick
drainage with uncovered system, and 37 percent of rural households have piped linked with
Kachi drainage. It is the insufficient infrastructure in the rural Pakistan for environmental
sanitation and health.
Figure 4: Type of Latrine in Rural Household
Figure 5: Kind of Drainage in Rural Household
Source: Survey Data
40 11 49 0 10 20 30 40 50 60
None/bush/field Dry Pit Latrine Flush Latrine
Per
ce
n
tage
Type of Latrine in Rural Household
7
37 38
17 0 5 10 15 20 25 30 35 40 45
Piped linked with Pacci Drain
(covered
Piped with katchi drain (in streets)
No drain Piped linked with Pacci Drain (open)
Per
ce
n
tage
13 | P a g e
The illegal/open garbage thrown makes the air pollution and hazardous for life. It is not only
biodegrading, but also has risk for health and environment. The figure 6 gives the information
about disposing of the garbage system in rural households. The figure 6 shows that 43 percent
households in the rural Pakistan have not proper disposing of garbage system they throw garbage
where they feel convenience, 45 percent of rural households throw garbage at a fixed place, but
not regularly, only the 4 percent of households in the rural Pakistan burn garbage and 8 percent
throw into fixed place on regular basis.
Figure 6: Dispose of Garbage System in Rural Household
Source: Survey Data
The 90 percent deaths from diarrhea disease in the developing nation‟s occurred in children under 5 years old. It can be reduced by improving the drinking water and sanitation services and
better hygienic behaviors (World Health Orgnization, 2005). The rural Pakistan is also facing the
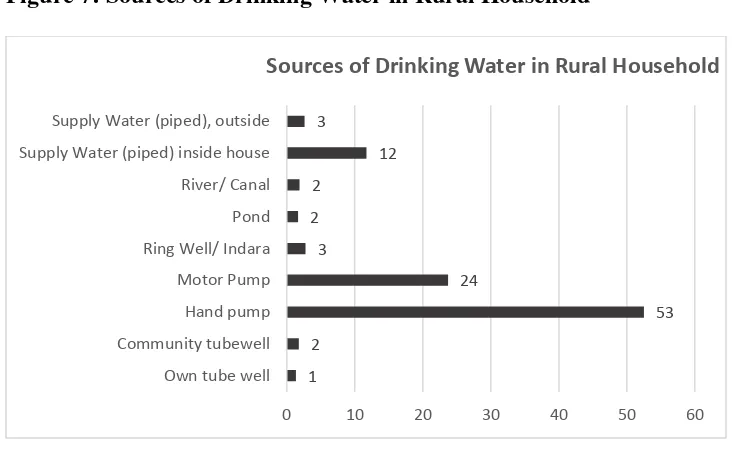
drinking water problems at the larger scale. The figure 7 describes the evidence about sources of
drinking water in rural Pakistan. The only 3 and 12 percent households have access to clean
drinking water through the water supply piped outside and inside the houses, respectively. The
8
45
4
43
0 5 10 15 20 25 30 35 40 45 50
Throw into fixed place
Throw into fixed place
Burn garbage Throw where convenient
Per
ce
n
tage
14 | P a g e
figure 7 also shows that the 53 percent households in rural Pakistan use a hand pump water for
the drinking and cooking purposes, 2 percent river/canal, 2 percent pond, 3 percent ring well, 24
percent motor pump, 2 percent community tube well and 1 percent households in rural Pakistan
have own tube well facilities for the drinking Water.
Figure 7: Sources of Drinking Water in Rural Household
Source: Survey Data
The figure 8 shows that 87 percent rural households have access to the electricity facility, but the
load shedding is the country level problem and 12 rural households have not access to the
electricity facility.
Figure 8: Rural Household Electricity Facility 1
2
53 24
3 2 2
12 3
0 10 20 30 40 50 60
Own tube well Community tubewell Hand pump Motor Pump Ring Well/ Indara Pond River/ Canal Supply Water (piped) inside house Supply Water (piped), outside
15 | P a g e
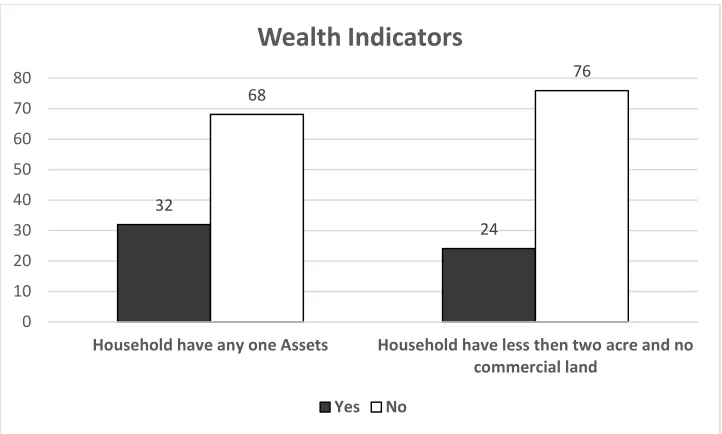
Poverty risk based on the material deprivation. The household holding durable assets like
washing machine, color television, car, mobile phone, tractor or the other agriculture durable
equipment‟s. These are all to reduce the poverty risk (Eurostat, 2013). This paper uses wealth as
a 4th MPI dimension. Further, wealth indicator is divided into the household has no nine
household assets like air cooler, fridge, freezer, car, computer, tractor, thresher, generator and
tube-well and has less than two acre agriculture land and no commercial plot. The figure 9 shows
that 32 percent rural household have any one out of nine assets and 24 percent rural households
have less than two acres agriculture land and no anyone commercial plot.
Figure 9: Rural household Wealth Status 12
87
1 0
10 20 30 40 50 60 70 80 90 100
No Yes (Public network) Yes (Privately Network)
Per
ce
n
tage
16 | P a g e
3.2 Inferential Analysis
The inferential analysis presents districts and country level analysis.
3.2.1 District Level Analysis
In this study district level results consists of 19 districts. Which included, 12 districts from
Punjab, 5 districts from Sindh and 2 districts from KPK..
[image:17.612.126.487.70.287.2]3.2.1.1 Poverty Estimates at District Level
Table 3 illustrates that average poverty for each district in rural Pakistan. The district Hyderabad
(70%), Thatta (70%), and Sanghar (63%) from Sindh province, D G khan (65%) and Multan
(60%) from Punjab province and Noshera (52%) from KPK province are on-average the above
then 50% poor are deprived in sum of the weighted indicators.
The depth of poverty table 3 shows that district Hyderabad (70%), Thatta (69%), D G khan
(58%), Jaccobabad (56%), Dadu (52%), Sanghar (52%) and Multan (51%) are reported above
than 50% rural households facing multidimensionally poor with respect to the given dimensions
(Education, Health, Living Standard, and Wealth).
Table 3: Poverty Estimates at District Level 32
24 68
76
0 10 20 30 40 50 60 70 80
Household have any one Assets Household have less then two acre and no commercial land
Wealth Indicators
17 | P a g e
District's name
Head count ratio (H)
Ran k
Adjusted Head count ratio (M0) Ran k Average Poverty A=M0/H Ran k
Attock 0.45 18 0.23 15 0.50 10
Bahawal
Nagar 0.58 15 0.33 13 0.56 7
Bhakhar 0.61 14 0.35 12 0.58 5
D G Khan 0.89 4 0.58 3 0.65 2
Dadu 0.87 5 0.52 5 0.60 4
Faisalabad 0.56 16 0.30 14 0.54 8
Hyderabad 1.00 1 0.70 1 0.70 1
Jaccobabad 0.93 3 0.56 4 0.60 4
Jhang 0.72 12 0.39 10 0.54 8
Kasur 0.77 9 0.44 8 0.57 6
Khanewal 0.71 13 0.40 9 0.56 7
Mansehra 0.45 18 0.22 16 0.49 11
Multan 0.85 6 0.51 6 0.60 4
Nowshera 0.73 11 0.37 11 0.52 9
Rahim Yar
Khan 0.54 17 0.30 14 0.56 7
Sanger 0.83 8 0.52 5 0.63 3
Sargodha 0.84 7 0.48 7 0.57 6
Thatta 0.98 2 0.69 2 0.70 1
Vehari 0.75 10 0.44 8 0.58 5
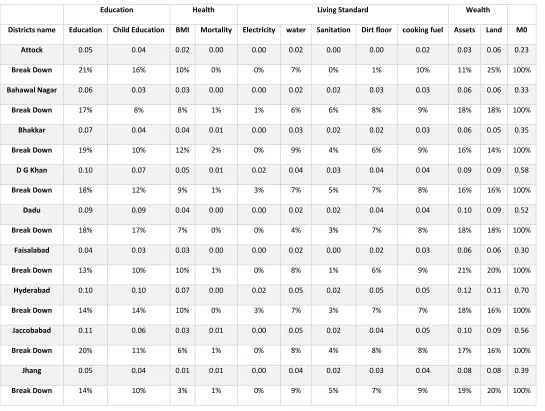
3.2.1.2 District Level indicator decomposition
Adjusted head count ratio (M0) is a very important index for budget allocation and limited
resource utilization plaining within the province/region/state. Table A1 in the appendix shows
that district Hyderabad, Thatta, D G Khan, Jaccobabad, Dadu, Sanghar and Multan are facing
more than fifty percent rural household people multidimensionally poor. The district Sargodha,
Kasur, Vehari, Khanewal, Jhang, Nowshera and Bhakkar are facing more than thirty three
percent rural household people multidimensionally poor. The district Bahawal Nagar,Faisalabad,
Rahim Yar Khan, Attock and Mansehra are facing less than thirty three percent rural household
people multidimensionally poor. Table A1 also shows that each indicator contribution in the
18 | P a g e
living standard (27%) and Wealth (34%) contribution in the overall district M0 (70%). In the 2nd
(M0) rank district Thatta education seems (27%), health (10%), living standard (32%) and
Wealth (31%) contribution in the overall district M0 (69%). In the 3th (M0) rank district D G
Khan education seems (30%), health (10%), living standard (30%) and Wealth (32%)
contribution in the overall district M0 (58%). In the 4th (M0) rank district Jaccobabad education
seems (31%), health (7%), living standard (28%) and Wealth (33%) contribution in the overall
district M0 (56%). In the 5th (M0) rank district Dadu education seems (35%), health (7%), living
standard (22%) and Wealth (36%) contribution in the overall district M0 (52%). In the 5th (M0)
rank district Sanghar education seems (26%), health (8%), living standard (31%) and Wealth
(37%) contribution in the overall district M0 (52%). In the 6th (M0) rank district Multan
education seems (28%), health (7%), living standard (28%) and Wealth (38%) contribution in the
overall district M0 (51%) and so on. In the all districts the major contribution in the poverty is
wealth and second is education. According to the David S. Landes (1998) and different
researchers you need money to make money. Money or wealth is the main proper instrument to
throw out the individual person or household or societies or nations from the poverty cycles. The
second education is the most important indicator to reduce the individuals or household level
poverty because the educational outcome greatly influences the family income. In poorer
families, children started school already to compare their peers who come from rich families this
show the measures of willingness but depth, duration and time of poverty all are influenced the
child education (Ferguson, Bovaired, & Mueller, 2007).
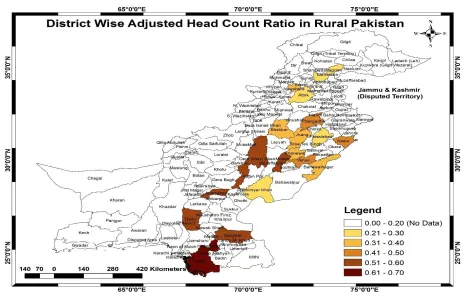
The given Map1, Map2 and Map3 presents the visually poverty status for the rural Pakistan in
19 | P a g e
Map1: Head Count Ratio
20 | P a g e
Map 3: Adjusted Head Count Ratio
3.2.2 Rural Pakistan Level Analysis
According to the previous studies and research shows that especially in the Pakistan, poverty is
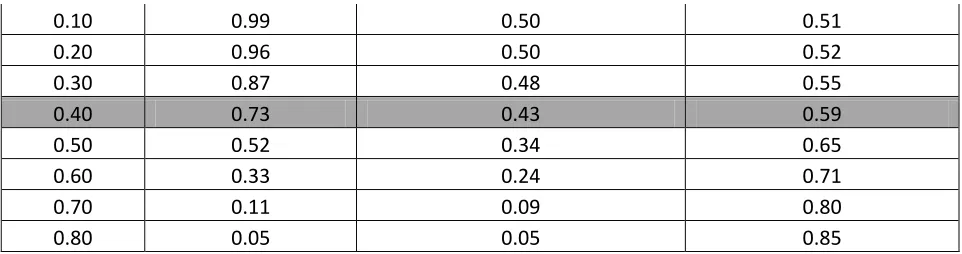
the rural phenomena. The Table 4 shows the rural poverty status at the country level. Results
show that 73 percent rural population belongs to the poor household if the poverty cutoff at 40
percent overall deprived score. If the poverty cutoff at 30 percent than 87 percent rural
population belong to the poor household in the Pakistan. The adjusted head count ratio is the
poverty depth, in the rural Pakistan 43 percent household facing multidimensionally poor with
respect to education, health, living standard and wealth. On-average 59 percent people of rural
[image:21.612.73.536.94.397.2]Pakistan below the poverty line.
Table 4: Overall Poverty Estimates for Rural Pakistan Level
Cutoff Point Head Count Ratio H Adjusted Head Count Ratio M0 Average Poverty A=M0/H
21 | P a g e
0.10 0.99 0.50 0.51
0.20 0.96 0.50 0.52
0.30 0.87 0.48 0.55
0.40 0.73 0.43 0.59
0.50 0.52 0.34 0.65
0.60 0.33 0.24 0.71
0.70 0.11 0.09 0.80
0.80 0.05 0.05 0.85
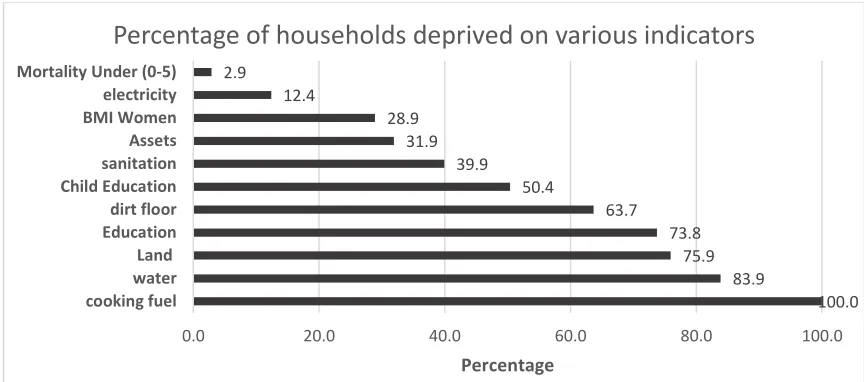
Figure 10 shows the percentage of households deprived on various indicators. The figure 10
results show that 2.9 % households in the rural Pakistan deprived due to mortality under the zero
to 5 years old, 12.4 % households in the rural Pakistan deprived due to electricity access, 28 %
households in the rural Pakistan deprived due to malnourishment in the women, 31 %
households in the rural Pakistan deprived due to the lack of monetary value assets, 39.9 %
households in the rural Pakistan deprived due to the lack of sanitation facility, 50.4 %
households in the rural Pakistan deprived due to the childe education because child going age
children are not going to school, 63.7 % households in the rural Pakistan deprived due to dirt
floor material and living in the mud houses, 73.8 % households in the rural Pakistan deprived
due to no one have completed five year of education, 75.9 % households in the rural Pakistan
deprived due to less than two acre agriculture land and not have any commercial plot, 83.9 %
households in the rural Pakistan deprived due to the lack of clean drinking water and 100.0 %
households in the rural Pakistan deprived due to use of dirt fuel ( wood, dang cake etc.) for the
cooking purpose.
[image:22.612.66.547.70.197.2]22 | P a g e
Figure 11 shows the decomposition of each indicator that 1% mortality under the zero to 5 years
old indicator contribution in the overall rural Pakistan level adjusted head count ratio, 8%
malnourishment in the women indicator contribution in the overall rural Pakistan level adjusted
head count ratio, 18% lack of monetary value assets, 1% lack of electricity access, 4% sanitation
indicator , 7% dirt floor, 7% clean drinking water , 8% cooking dirty fuel, 11% child education,
17 % household member education and 18% land indicators contribution in the overall rural
Pakistan level adjusted head count ratio.
Figure 11: Each indicator decomposition at rural Pakistan Level
100.0 83.9 75.9 73.8 63.7 50.4 39.9 31.9 28.9 12.4 2.9
0.0 20.0 40.0 60.0 80.0 100.0
cooking fuel water Land Education dirt floor Child Education sanitation Assets BMI Women electricity Mortality Under (0-5)
Percentage
Percentage of households deprived on various indicators
18% 18% 17% 11% 8% 8% 7% 7% 4% 1% 1%
0% 2% 4% 6% 8% 10% 12% 14% 16% 18% 20%
Land Assets Education Child Education cooking fuel BMI (Women) Clean water Dirt floor Sanitation Electricity Mortality under (0-5 )
23 | P a g e
Conclusions and the way forward
This paper implements the Alikire and Foster Measure (AFM) for the estimating rural poverty,
using the data cross sectional data for the year 2012 analyzed 11 indicators relating to 4
Millennium Development Goals (MDGs) dimensions of education, health, living standard and
wealth.
The paper results show that on average 59 percent households of rural Pakistan live below the
poverty line and 43 percent are multidimensionally poor with respect to education, health, living
standard and wealth. Decomposition of poverty analysis shows that in rural Pakistan 28 percent
education, 36 percent wealth, 9 percent health and 27 percent living standard contribute to
overall rural poverty.
The mapping of the average poverty shows that most of the rural poor districts are in Sindh and
Southern Punjab. These areas are deprived in all aspects of multidimensional poverty. Therefore,
federal and especially provincial governments need to increase allocation of funds for education
and health. There is also need for provision of opportunities for employment and improved living
standards. The wealth of the individual and community can increase just if the economy turns out
to be more gainful.
Acknowledgement:
This paper is carryout with the assistance of Innovative Development Strategies (Pvt.) Ltd. I
extraordinarily thank our associates from Innovative Development Strategies (Pvt.) Ltd who
gives the suggestions that helped the paper. We express gratitude toward Mr. Imran Malik
(Managing Director, Innovative Development Strategies (Pvt.) Ltd) for help with understanding
24 | P a g e References
Afzal, M., Malik, M. E., Begum, I., Sarwar, K., & Fatima, H. (2012). Relationship among Education, Poverty and Economic Growth in Pakistan: An Econometric Analysis. Journal of Elementary Education, 22(1), 23-45.
Alkire, S. (2007). Choosing Dimensions: The Capability Approach and Multidimensional Poverty. Oxford
Poverty & Human Development Initiative, Chronic Poverty Research Centre Working Paper(88).
Amjad, A., Hussain, M., & Hashmi, M. H. (2008). Trends and Determinants of Rural Poverty: A Logistic Regression Analysis of Selected Districts of Punjab. The Pakistan Development Review, 47(4), 909-923.
Anwar, T., Sarfraz K, Q., & Ali, H. (2004). Landlessness and Rural Poverty in Pakistan. The Pakistan
Development Review, 43(4), 855–874.
Arif, G. M., & Farooq, s. (2014). Rural Poverty Dynamics in Pakistan: Evidence from Three Waves of the Panel Survey. The Pakistan Development Review, 53(1), 1-28.
Davis, P. (2011). The Trappings of Poverty: The Role of Assets and Liabilities in Socio-economic Mobility in Rural Bangladesh. CPRC Working Paper(195).
Ferguson, H., Bovaired, S., & Mueller, M. (2007). The impact of poverty on educational outcomes for children. Paediatr Child Health, 28(8), 701-706.
Filipi, & Gjergji. (2014). Dwelling and living condition.Zhan D’Ark” Nr. 3, Tiranë: Swiss Agency for
Development and Cooperation.
Foster, J. E. (1998). Absolute versus Relative Poverty. The American Economic Review, 88(2), 335-341. Fry, Firestone, & Chakraborty. (2014). Measuring Equity with Nationally Representative Wealth
Quintiles. Washington, DC: PSI.
International Energy Agency. (2006). World Energy Outlook. 75739 Paris Cedex 15, France: International Energy Agency.
International Food Policy Research Institute, I. D. (2014). Pakistan Rural Household Panel Survey.
International Food Policy Research Institute, Washington, DC.
International Fund for Agriculture Development. (2007). Rural poverty in Pakistan. IFAD.
International Poverty centre. (2006). Poverty In Focus. Brazil: United Nation Develoment programme. Kemal, A. R. (2003). Agriculture Growth and Rural Poverty in Pakistan: A Regional Analysis. PIDE,
Islamabad.
Khan, A. U., Saboor, A., Hussain, A., Karim, S., & Hussain, S. (2015). Spatial and Temporal Investigation of Multidimensional Poverty in Rural Pakistan. A global journal of social security, Incom,Aid, and
welfare, 158-175.
25 | P a g e
Krishna, & Anirudh. (2011). Characteristics and Patterns of Intergenerational Poverty Traps and Escapes in Rural North India. CPRC Working Paper(189).
Mairena, R. (2008). An Analysis of the linkage between poverty and access to basic sanitation in
Honduras. Latin America / Caribbean: Water and Sanitation programme.
Malik, S. J. (2005). Agricultural Growth and Rural Poverty: A Review of the Evidence Pakistan Resident
Mission Working Paper Series. Asian Development Bank, Islamabad.
Naveed, A., & Islam, T. u. (2012). A New Methodological Framework for Measuring Poverty in Pakistan.
Islamabad,Pakistan: Sustainable Development Policy Institute.
Nazli, H., Haider, S. H., Hausladen, S., Tariq, A., Shafiq, H., Shahzad, S., . . . Whitney, E. (2012). Pakistan
Rural Household Survey Overview and Highlights. Islamabad,Pakistan: Pakistan Strategy Support
Program (PSSP).
Oxford Poverty & Human Development Initiative. (2014). Multidimensional Poverty Index. University of Oxford: OPHI.
Pakistan, G. o. (2006). Economic Survey of Pakistan. Islamabd: Finance Division. Pakistan, G. o. (2014). Economic Survey of Pakistan. Islamabad: Finance Division.
Saboor, A., Tanwir, F., Ali, I., & Maan, A. A. (2006). DEMOGRAPHIC DIMENSIONS OF RURAL POVERTY IN PAKISTAN. Pakistan Journal of Agriculture Sciences, 43(2).
Salahuddin, T., & Zaman, A. (2012). Multidimensional Poverty Measurement in Pakistan: Time Series Trend and Breakdown. The Pakistan Development Review, 51(4), 493-504.
Santos, M. E., & Alkire, S. (2011). Training Material For The producing national Human development Reports: Multidimensional Poverty Index. Oxford Poverty & Human Development Initiative. Suleri, A. Q. (2016). http://sdpi.org/media/media_details2417-press-2016.html.
Triassi, M., Alfano, R., Illario, M., Nardone, A., Caporale, O., & Montuori, P. (2015). Environmental
Pollution from Illegal Waste Disposal and Health Effects: A Review on the “Triangle of Death”.
International Journal of Environmental Research and Public Health, 12, 1216-1236.
Wlodzimierz, & Okrasa. (1999). Who Avoids and Who Escapes from Poverty during the Transition? Evidence from Polish Panel Data. World Bank Policy Research Working Paper.
World Bank. (1995). Components of a Poverty Reduction Strategy. Latin American and the Carihhean Regional Office.
World Health Orgnization. (2005). Water for life. Geneva 27, Switzerland: World Health Organization and UNICEF.
26 | P a g e Appendix
Table A1
Education Health Living Standard Wealth
Districts name Education Child Education BMI Mortality Electricity water Sanitation Dirt floor cooking fuel Assets Land M0
Attock 0.05 0.04 0.02 0.00 0.00 0.02 0.00 0.00 0.02 0.03 0.06 0.23
Break Down 21% 16% 10% 0% 0% 7% 0% 1% 10% 11% 25% 100%
Bahawal Nagar 0.06 0.03 0.03 0.00 0.00 0.02 0.02 0.03 0.03 0.06 0.06 0.33
Break Down 17% 8% 8% 1% 1% 6% 6% 8% 9% 18% 18% 100%
Bhakkar 0.07 0.04 0.04 0.01 0.00 0.03 0.02 0.02 0.03 0.06 0.05 0.35
Break Down 19% 10% 12% 2% 0% 9% 4% 6% 9% 16% 14% 100%
D G Khan 0.10 0.07 0.05 0.01 0.02 0.04 0.03 0.04 0.04 0.09 0.09 0.58
Break Down 18% 12% 9% 1% 3% 7% 5% 7% 8% 16% 16% 100%
Dadu 0.09 0.09 0.04 0.00 0.00 0.02 0.02 0.04 0.04 0.10 0.09 0.52
Break Down 18% 17% 7% 0% 0% 4% 3% 7% 8% 18% 18% 100%
Faisalabad 0.04 0.03 0.03 0.00 0.00 0.02 0.00 0.02 0.03 0.06 0.06 0.30
Break Down 13% 10% 10% 1% 0% 8% 1% 6% 9% 21% 20% 100%
Hyderabad 0.10 0.10 0.07 0.00 0.02 0.05 0.02 0.05 0.05 0.12 0.11 0.70
Break Down 14% 14% 10% 0% 3% 7% 3% 7% 7% 18% 16% 100%
Jaccobabad 0.11 0.06 0.03 0.01 0.00 0.05 0.02 0.04 0.05 0.10 0.09 0.56
Break Down 20% 11% 6% 1% 0% 8% 4% 8% 8% 17% 16% 100%
Jhang 0.05 0.04 0.01 0.01 0.00 0.04 0.02 0.03 0.04 0.08 0.08 0.39
27 | P a g e
Education Health Living Standard Wealth
Districts name Education Child Education BMI Mortality Electricity water Sanitation Dirt floor cooking fuel Assets Land M0
Kasur 0.08 0.04 0.03 0.00 0.00 0.04 0.02 0.03 0.04 0.09 0.09 0.44
Break Down 17% 8% 7% 0% 0% 8% 4% 7% 9% 19% 20% 100%
Khanewal 0.07 0.03 0.04 0.00 0.00 0.04 0.01 0.02 0.04 0.07 0.08 0.40
Break Down 18% 9% 9% 1% 0% 9% 2% 5% 9% 18% 19% 100%
Mansehra 0.05 0.03 0.01 0.00 0.00 0.01 0.00 0.00 0.02 0.04 0.05 0.22
Break Down 22% 12% 5% 0% 0% 5% 0% 1% 10% 18% 24% 100%
Multan 0.09 0.06 0.03 0.00 0.01 0.03 0.02 0.03 0.04 0.11 0.09 0.51
Break Down 17% 11% 6% 1% 1% 7% 5% 7% 8% 21% 17% 100%
Nowshera 0.07 0.04 0.02 0.00 0.00 0.03 0.01 0.03 0.04 0.06 0.07 0.37
Break Down 20% 11% 6% 1% 0% 8% 2% 9% 10% 15% 19% 100%
Rahim Yar Khan 0.04 0.03 0.03 0.01 0.00 0.02 0.01 0.02 0.03 0.05 0.06 0.30
Break Down 15% 9% 8% 4% 0% 8% 3% 7% 9% 15% 21% 100%
Sanghar 0.09 0.05 0.04 0.00 0.01 0.04 0.03 0.04 0.04 0.09 0.10 0.52
Break Down 16% 10% 7% 1% 2% 8% 6% 7% 8% 18% 19% 100%
Sargodha 0.08 0.04 0.03 0.01 0.00 0.04 0.03 0.03 0.04 0.09 0.10 0.48
Break Down 16% 8% 7% 2% 0% 9% 5% 6% 9% 18% 21% 100%
Thatta 0.09 0.09 0.07 0.00 0.04 0.05 0.04 0.05 0.05 0.12 0.09 0.69
Break Down 14% 13% 10% 0% 5% 7% 6% 7% 7% 18% 13% 100%
Vehari 0.07 0.06 0.03 0.00 0.00 0.04 0.02 0.03 0.04 0.08 0.07 0.44