Quantitative Evaluation of Calcium Phosphate on Surface of Titanium
by X-ray Fluorescence Analysis
Chikage Abe
1, Fuyuki Sakamoto
1, Naofumi Ohtsu
2, Tetsuya Ashino
1and Kazuaki Wagatsuma
1 1Institute for Materials Research, Tohoku University, Sendai 980-8577, Japan 2Instrumental Analysis Center, Kitami Institute of Technology, Kitami 090-8507, Japan
A quantitative analysis of calcium phosphate (CP) layers deposited on metallic titanium substrates was carried out by X-ray fluorescence spectrometry (XRF) in order to evaluate the osteogenic capability of metallic biomaterials. The titanium substrates were prepared by NaOH and heat treatments, and then, they were soaked in Hanks’ balanced saline solution (HBSS) at 310 K, leading to the deposition of a CP layer on the sample surface. The resulting samples were analyzed by XRF, and the amount of Ca and P in the CP layers was determined by inductively coupled plasma optical emission spectrometry (ICP-OES). As a result, calibration curves were obtained for determining the amounts of Ca, P and the CP deposition; the XRF quantification of the CP layers was carried out with good accuracy. [doi:10.2320/matertrans.M2009158]
(Received May 1, 2009; Accepted June 29, 2009; Published August 12, 2009)
Keywords: calcium phosphate, metallic titanium, X-ray fluorescence, inductively coupled plasma optical emission spectrometry, metallic biomaterial
1. Introduction
Metallic biomaterials have been widely used by orthoped-ists or dentorthoped-ists in clinical practice, because they can be used in appropriate parts of the human body. In particular, titanium or titanium alloys are expected to be alternative materials for hard tissues such as dental implants and artificial hip joints due to their high corrosion resistance and low toxicity.1–3)However, when immersedin vivo, they exhibit poor adhesion with the surface of bones because of their low biocompatibility.4)Recently, various surface
treat-ments employed for the improvement of hard-tissue compat-ibility have been investigated.5–13)
For the evaluation of hard-tissue compatibilityin vitro, an immersion test has often been conducted using a simulated body fluid.12–21)In this test, the amount of calcium phosphate
(CP) deposited on the surface of a substrate during immersion is estimated as an index of the hard-tissue compatibility. This estimation is generally carried out by observing the changes in the surface morphology by scanning electron microscopy (SEM).16–21) However, SEM images show only a narrow portion with semi-quantitative information. SEM cannot be used to obtain accurate quantitative data about the amount of deposited CP layer.
Therefore, other chemical or physical analytical methods should be employed to precisely and accurately determine the amount of deposited CP layer. The amount of Ca and P can be determined with good analytical precision by inductively coupled plasma optical emission spectrometry (ICP-OES); however, the CP layer deposited on the sample surface has to be decomposed using acids. As an alternative method to SEM or ICP-OES, we focused on X-ray fluorescence spectrometry (XRF), which is one of the methods used for the direct analysis of solid samples. XRF has several analytical benefits: nondestructive analysis of various materials, including insulators, and quantitative analysis over a wider sampling area as compared with SEM.
In XRF, both a calibration curve method and a funda-mental parameter (FP) method have been used for the
calibration of XRF instruments. In the FP method, the composition of unknown samples can be determined by comparing experimental data with a theoretical estimation of the X-ray intensities, which is obtained from the theory of X-ray excitation under the assumption that a homogeneous sample is analyzed. An advantage of this method is that several types of samples can be analyzed without preparing standard reference materials. However, analytical errors may be caused when several elements in the sample are not detected. Moreover, it is difficult to use this method for the analysis of heterogeneous samples. On the other hand, the calibration curve method can give a quantitative result of the chemical composition of various types of samples; however, a series of standard reference materials is required for each sample.
In order to carry out precise and accurate evaluation of the hard-tissue compatibility of metallic biomaterials, we carried out an XRF analysis of CP layers deposited on metallic titanium substrates. CP layers having an unknown thickness were deposited on the titanium substrates, which were prepared by soaking in a simulated body fluid, and then, the amounts of deposited CP layers were determined by ICP-OES. By comparing the XRF intensity with the amount of deposited CP layers determined by ICP-OES, an appropriate method based on the calibration curve method was inves-tigated for obtaining accurate analytical results. Further, the validity of the calibration curve method and FP method for carrying out a quantitative analysis of the CP layers was also discussed.
2. Experimental
2.1 Sample preparation
ethanol and dried in air. The specimens were soaked in 1-M sodium hydroxide at 333 K for 24 h. The surface of the specimens was washed using distilled water and dried at 293 K for 24 h in air. The specimens were subsequently heated up to 873 K and kept for 1 h.
After heat treatment, the specimens were soaked in Hanks’ balanced saline solution (HBSS), which was employed as a simulated body fluid, at 310 K for a certain standing time. The HBSS was prepared by dissolving appropriate amounts of reagent-grade NaCl, KCl, CaCl2, MgSO47H2O,
Na2HPO42H2O, KH2PO4 and NaHCO3 in deionized water
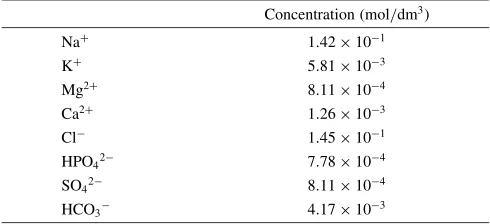
[image:2.595.46.291.85.197.2](Millipore). The ion concentration of the HBSS is shown in Table 1. The pH value of the HBSS was about 7.6, immediately after preparation. The HBSS was changed every 3 days to maintain the pH value. Soaking was carried out for 5–12 days. The surface of the specimens was finally washed using distilled water and dried at 310 K.
Grazing incidence X-ray diffraction (GI-XRD) measure-ments were performed using the specimens to identify the resultant compounds deposited on their surface; diffraction patterns showed peaks attributable to hydroxyapatite (HAp).
2.2 XRF measurements
The intensity of Ca-K and P-K lines was measured, which were excited from the CP layers deposited on the surface of the specimens. The intensities of Ti-K lines, which were excited from the titanium substrates, were also measured. A wavelength-dispersive XRF (ZSX-Primus, Rigaku Corp, Japan) equipped with an X-ray tube having a side window-type Rh anticathode was used. The X-rays emitted were passed through a slit with a width of 10 mm to remove X rays from the sample holder. The measurement conditions are shown in Table 2.
2.3 Quantitative analysis of Ca and P by ICP-OES
It is difficult to prepare a standard reference material having a well-defined thickness by immersing it in a simulated body fluid. Therefore, the amounts of Ca and P in the CP layers were determined by ICP-OES. The speci-mens were soaked in 7-M nitric acid solution and then heated to about 473 K. The CP layers were selectively dissolved in the solution, because titanium is insoluble in nitric acid. This method can be used in the case of materials that are insoluble in a specific acid. It was confirmed by XRF that the CP layers could be removed completely by this method. After cooling, yttrium solution was added to the sample solution as an internal standard, and then, the total volume was adjusted
to 25 cm3 by adding distilled water before performing the measurements.
The instrument operating conditions are shown in Table 3. The detection limit for quantitative analysis by ICP-OES was determined from the concentration corresponding to three times the standard deviation estimated from three standard solutions that contained neither Ca nor P. The detection limit for Ca was 0.05mg/cm2, and that for P was
0.5mg/cm2.
3. Results and Discussion
3.1 Relationship between fluorescent X-ray intensity and analytical value measured by ICP-OES
The thickness of the CP layers deposited on the surface of the titanium substrates by soaking in the HBSS was less than the effective depth for XRF; therefore, signals from elements present in both the CP layers and the substrates were detected. Therefore, the X-ray intensities of the Ca-K, P-K
and Ti-Klines were used for the analysis.
[image:2.595.303.550.86.152.2] [image:2.595.305.549.187.381.2]Figure 1 shows the relationship between the intensities of the Ca-K and P-K lines and the analytical values determined by ICP-OES. When the amount of deposited CP layer was small, the X-ray intensities increased monotoni-cally. However, the intensities gradually saturated, probably because the X-rays were self-absorbed within the CP layer, and the effect was more prominent with an increase in the sampling depth. The two curves shown in Fig. 1 correspond to the calibration curves for each Ca and P in the CP layer; they are called excitation curves. A quantitative determina-tion of Ca and P is made with good accuracy from this relationship on the basis of the data obtained by ICP-OES. Table 1 Ion concentrations of Hanks’ balanced saline solution (HBSS).
Concentration (mol/dm3)
Naþ 1:42101
Kþ 5:81103
Mg2þ 8:11104
Ca2þ 1:26103
Cl 1:45101
HPO42 7:78104
SO42 8:11104
HCO3 4:17103
Table 2 Experimental parameters of XRF analysis.
Element Rh tube Crystal Detector 2angle [] Counting time [s] kV mA
Ca 40 75 LiF(200) PC 113.120 150
P 30 100 Ge PC 141.190 150
Ti 50 60 LiF(200) SC 86.110 150
Table 3 Instrument operating conditions for ICP-OES.
Instrument IRIS Advantage DUO
(Thermo Fisher Scientific Co. Ltd.)
Plasma conditions RF frequency 27.12 MHz
RF power 1.15 kW
Ar gas flow rates Plasma gas 15 dm3/min
Nebulizer gas 28 psi Auxiliary gas 0.5 dm3/min
Spectrometer conditions Grating Echelle type
Detector CID
Wavelengh [nm] CaII 393.366
PI 185.943
PI 213.618
PI 214.914
Once calibrated by ICP-OES, it is possible to analyze with only XRF, though a drift correction is needed. The possible ranges of quantitative determination were 0.5–320mg/cm2
for Ca and 0.5–140mg/cm2for P. The limits were determined
from the detection limits of XRF, which were calculated by multiplying the standard deviation of the X-ray intensities by 10. The upper limits denote the amount of CP layers deposited on the specimens used in this study. In general, the amount of CP layer is estimated in terms of its thickness; however, the density of the CP layers could not be determined because the crystalline structure of the CP layers was variable.22) Therefore, the area density (mg/cm2) was
used for estimating the amount of CP layers deposited on the surface of the specimens.
The calibration curve method can be used for the quantitative determination of each Ca and P, because the method is not affected by the chemical form of the deposited CP layer. Further, this method can be used to estimate the [Ca]/[P] ratio. However, the X-ray intensities of the Ca-K
and P-Klines varied largely when the amount of deposited CP layers was small because of the statistical fluctuations in the X-ray detection, which may deteriorate the analytical precision.
On the other hand, the X-ray intensities of the Ti-Klines emitted from the substrates was sufficiently strong with a little fluctuation; accordingly, the method based on the X-ray intensity of the Ti-K was expected to give a more appropriate evaluation of the amount of CP layers. In addition, the quantitative determination of the total amount of CP deposition was performed easily and rapidly. Figure 2 shows the relationship between the X-ray intensities of the Ti-Klines and the amount of CP deposition. Only the X-ray intensities from specimens having a [Ca]/[P] ratio of
1:670:15 are plotted in Fig. 2, because the assumption that the deposition was stoichiometric HAp was required for calculating the amount of CP deposition. The intensities of the Ti-K lines decreased with increasing amount of CP deposition, implying that the X-rays excited from the titanium substrates were absorbed by the CP layers, because the primary X-rays could easily penetrate the titanium substrates through the CP layers. The curve shown in Fig. 2 was used as a calibration curve for the CP layers. The amount of CP deposition on the titanium substrates is evaluated accurately from the relationship shown in Fig. 2, though the method can be used only in the case of specimens
having a [Ca]/[P] ratio of around 1.67. The possible range of quantitative determination was 50–800mg/cm2 for the total
amount of CP layers.
3.2 Comparison between calibration curve method and FP method
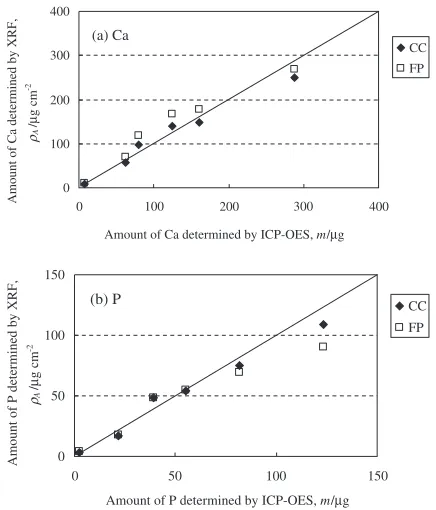
Figure 3 shows comparisons of the amount determined by ICP-OES with the results of the calibration curve and FP methods. In the FP method, a layer of each Ca and P deposited on the titanium substrates were calculated by using the element sensitivity coefficients of the instrument without standard certified materials. The difference in the analytical result between the FP method and ICP-OES was larger than that between the calibration curve method and ICP-OES. This result indicates that the calibration curve method provided more accurate results. In the FP method, the accuracy might be degraded because oxygen was present in the CP layer, which cannot be measured by XRF. 0
40 80 120 160
0 100 200 300 400
Amount determined by ICP-OES,ρA/µg cm -2
Intensity,
I
/kcps
Ca P
Fig. 1 Correlation of X-ray intensities with amounts determined by ICP-OES.
60 80 100 120
0 200 400 600 800
Amount of CP deposition on Ti, ρA/µg cm -2
Intensity of Ti-K
α
,
I
/kcps
Fig. 2 Correlation of X-ray intensities of Ti-Klines with amount of CP deposition on Ti.
0 100 200 300 400
0 200 400
Amount of Ca determined by ICP-OES, m/µg
Amount of Ca determined by XRF,
ρA
/
µ
g cm
-2
CC
FP
(a) Ca
100 300
0 50 100 150
0 150
Amount of P determined by ICP-OES, m/µg
Amount of P determined by XRF,
ρA
/
µ
g cm
-2
CC
FP
(b) P
50 100
[image:3.595.327.525.73.197.2] [image:3.595.71.270.73.196.2] [image:3.595.318.536.250.505.2]3.3 Application of quantitative evaluation by XRF 3.3.1 Determination of [Ca]/[P] ratio in CP layer
The [Ca]/[P] ratio in the CP layers is an important parameter that reveals the chemical form and deposition mechanism of the layers. The ratio was calculated from the amounts of Ca and P determined by using the calibration curves of Fig. 1. Figure 4 shows the relationship between the [Ca]/[P] ratio and the amount of Ca. The solid line in Fig. 4 is an atomic ratio of stoichiometric HAp, 1.67. As the amount of Ca increased, the ratio approached 1.67, suggesting that the chemical form of the deposition was HAp. Figure 4 also indicates that the calibration method based on the Ti-Kline can be used in the case of specimens having a predetermined amount of CP deposition. When the soaking time was kept short to produce small amounts of deposition, Ca was preferentially detected as compared to P. This observation supports the mechanism of CP deposition on a surface of alkali-heated titanium reported by Kokuboet al.23,24)
3.3.2 SEM images of several sample surfaces having different amounts of CP layers
Surface images of the specimens were obtained by a scanning electron microscope operated at an accelerating voltage of 15 kV. Figure 5 shows the SEM images of the specimens with different amounts of CP deposition. The amount of these CP depositions was determined by XRF:
190mg/cm2 (a), 365mg/cm2, (b) and 805mg/cm2 (c). In
general, SEM images can be used to observe the surface
morphology, and a semi-quantitative determination of the CP layers is also possible by estimating their size and shape. On the other hand, XRF measurements can provide an analytical method for precisely and accurately determining the con-centration of elements in the CP layers.
3.3.3 Reproducibility of amount of CP layers
During sample preparation, the number of substrates soaked in a vessel filled with HBSS is an important parameter. In this study, six or seven specimens were simultaneously soaked in the solution stored in a vessel. The amount of CP deposition was determined by XRF. HBSS solution of 20 cm3was prepared for one specimen, and thus, in total, 120 or 140 cm3of HBSS solution was used. Figure 6
shows the X-ray intensities of the Ti-Klines and the amount of CP deposition. Group A consists of specimens soaked for 9 days; group B, 12 days. The average amounts of CP deposition of specimens in group A was determined to be
197mg/cm2 with a small deviation and that of specimens
in group B was 344mg/cm2. These results indicate that
the amount of CP deposition can be estimated as a function of the soaking time when many titanium substrates are simultaneously soaked in a vessel filled with HBSS.
4. Conclusions
(1) The calibration curves obtained by XRF, together with ICP-OES results, can be used to determine the amounts of Ca, P, and CP deposition without preparing an appropriate series of standard reference materials. (2) The calibration method for Ca and P can be used to
determine the [Ca]/[P] ratio in CP layers, because this method is applicable regardless of the stoichiometry of the deposited layer. On the other hand, it is thought that the calibration method for Ti is more suitable for determining the amount of CP deposition, because the X-ray intensities of the Ti-k lines were relatively intense even when the thickness of the CP layers was small; however, this method can be used only in the case of specimens having a [Ca]/[P] ratio of around 1.67.
(3) The calibration curve method is suitable for quantitative analysis by XRF, whereas the accuracy of the FP
0 1 2 3 4 5
0
Amount of Ca determined by XRF, ρA/µg cm-2
[Ca] / [P]
10 20 30 40 50
Fig. 4 [Ca]/[P] ratio in CP layers.
60 80 100 120
0 200 400 600 800
Amount of CP deposition on Ti, ρA/µg cm-2
Intensity of Ti-K
α
,
I
/kcps (a)
(b)
(c)
(c) (b)
(a)
Fig. 5 SEM images of surfaces giving different intensities of Ti-Klines. The amounts of CP depositions were determined to be (a) 190mg/cm2,
(b) 365mg/cm2, and (c) 805mg/cm2.
0 100 200 300 400
Group A
Amount of CP deposition,
ρA
/
µ
g cm
-2
80 90 100 110 120
Intensity of Ti-K
α
,
I
/kcps
Group B
[image:4.595.70.272.71.193.2] [image:4.595.326.525.72.226.2] [image:4.595.51.289.228.389.2]method is not sufficiently high, because the CP layers contained a large amount of oxygen, which cannot be measured by XRF.
REFERENCES
1) S. G. Steinemann:Evaluation of Biomaterials, (John Wiley & Sons Inc, New York, 1980) pp. 1–34.
2) H. Kawahara: Bull. Japan Inst. Metals31(1992) 1033–1039. 3) Y. Okazaki, S. Rao, T. Tateishi and Y. Ito: Mater. Sci. Eng. A243
(1998) 250–256.
4) D. E. Steflik, R. S. Corpe, F. T. Lake, T. R. Young, A. L. Sisk, G. R. Parr, P. J. Hanes and D. J. Berkery: J. Biomed. Mater. Res.39(1998) 611–620.
5) A. Nanci, J. D. Wuest, L. Peru, P. Brunet, V. Sharma, S. Zalzal and M. D. McKee: J. Biomed. Mater. Res.40(1998) 324–335.
6) J. Pan, D. Thierry and C. Leygraf: J. Biomed. Mater. Res.30(1996) 393–402.
7) C. Ohtsuki, H. Iida, S. Hayakawa and A. Osaka: J. Biomed. Mater. Res. 34(1997) 39–47.
8) H. W. Kim, H. E. Kim and J. C. Knowlesb: Biomaterials25(2004) 3351–3358.
9) L. Tang, C. Tsai, W. W. Gerberich, L. Kruckebeu and D. R. Kania: Biomaterials16(1995) 483–488.
10) J. G. C. Wolke, K. de Groot and J. A. Jansen: J. Biomed. Mater. Res.39 (1998) 524–530.
11) S. Vercaigne, J. G. C. Wolke, I. Naert and J. A. Jansen: J. Biomed. Mater. Res.41(1998) 41–48.
12) X. Liu and C. Ding: Biomaterials23(2002) 4065–4077.
13) H. M. Kim, F. Miyaji, T. Kokubo and T. Nakamura: J. Biomed. Mater. Res.32(1996) 409–417.
14) P. Li, I. Kangasniemi, K. de Groot and T. Kokubo: J. Am. Ceram. Soc. 77(1994) 1307–1312.
15) L. M. Hirakata, M. Kon and K. Asaoka: Biomed. Mater. Eng.13(2003) 247–259.
16) T. Kokubo, F. Miyaji, H.-M. Kim and T. Nakamura: J. Am. Ceram. Soc.79(1996) 1127–1129.
17) A. Stoch, W. Jastrze˛bski, A. Broz˙ek, J. Stoch, J. Szaraniec, B. Trybalska and G. Kmita: J. Mol. Str.555(2000) 375–382.
18) C. Q. Ning and Y. Zhou: Biomaterials23(2002) 2909–2915. 19) L. Jonasova, F. A. Muller, A. Helebrant, J. Strnad and P. Greil:
Biomaterials25(2004) 1187–1194.
20) N. Ohtsu, K. Sato, A. Yanagawa, K. Saito, Y. Imai, T. Kohgo, A. Yokoyama, K. Asami and T. Hanawa: J. Biomed. Mater. Res.82A (2007) 304–315.
21) N. Ohtsu, K. Sato, K. Saito, K. Asami and T. Hanawa: J. Mater. Sci. Med.18(2007) 1009–1016.
22) H. Takadama, H. M. Kim, T. Kokubo and T. Nakamura: J. Biomed. Mater. Res.57(2001) 441–448.
23) T. Kokubo, H. M. Kim and M. Kawashita: Biomaterials24(2003) 2161–2175.