Munich Personal RePEc Archive
Job Creation and the Role of
Dependencies
Fornaro, Paolo and Luomaranta, Henri
1 May 2016
Job Creation and the Role of Dependencies
Paolo Fornaro*, Henri Luomaranta**
*Department of Political and Economic Studies, University of Helsinki
**Statistics Finland and University Of Toulouse 1
April 2016
PRELIMINARY DRAFT
Abstract
We contribute to the large literature on the relation between firm size and job creation by examining the effects of dependences between enterprises. Using Finnish monthly data encompass-ing the population of Finnish private businesses, we calculate gross job creation and destruction, together with net job creation, for different size classes and industries. Importantly, we divide firms into a dependent (i.e. owned, at least partially, by a large company) and independent category. The analysis is based on both a dataset including entry and exit and a sample considering only continuous companies, to control for the effects of firm’s age. Due to the quality of the data, we are able to isolate the ’organic’ growth of firms, disregarding the effects of mergers and split-offs together with other legal restructurings. We find that independent companies have shown consid-erably higher net job creation, even after taking age into account. However, dependent firms do not show particularly different behavior with respect to the sensitivity to aggregate conditions, compared to their independent counterparts.
1
Introduction
The relationship between employment generation and firm’s size has been the focus
of extensive research. Since the seminal article of Birch (1981), there has been a lot
of discussion about whether small firms are the main force underlying employment
growth. This view has been the center of political debate, where public support to small
businesses has been advocated in the light of their large growth enhancing capabilities.
However, the original insights by Birch have been contested in multiple empirical
works, which have pointed out issues underlying the data and the methodology adopted.
For example, Davis et al. (1996) argue that the procedure that Birch (1981) uses to
classify a firm as small or large (i.e. using the base year on which the growth rate
businesses. Subsequent works studying the effects of firms’ size and job creation are,
among many others, Davis et al. (1996) and Neumark et al. (2011). In these papers
it has been found that, after adjusting for the statistical biases of Birch (1981), small
firms do not create more net jobs compared to large ones, or at least not in such a
dramatic way as found in Birch’s work. For the Finnish economy, there has been a
number of studies where the relation between firm sizes and net job flows is examined.
Some examples of these analyses comprise Hohti (2000), Ilmakunnas and Maliranta
(2003), and more recently Wit and Kok (2014) and Anyadike-Danes et al. (2014).
The enterprise size has not been the only firm’s characteristic analyzed in regards
to employment creation. Another important feature that has been considered as a
contributing factor to net job growth is firm’s age. A key study in this respect is
Haltiwanger et al. (2013), where the authors show that once we control for firm’s age,
small and large firms do not show discrepancies in net job creation. Other studies which
are interested in the effect of the firms’ age on job creation are Criscuolo et al. (2014),
Distante et al. (2014) and Anyadike-Danes et al. (2014). The common finding of these
studies is that young firms are the main drivers of job creation, with start-ups being
especially important.
In this paper, we investigate another possible source of heterogeneity among firms
which might affect job creation, i.e. external ownership and dependence. In particular,
we look at how firms belonging to an enterprise group contribute to job growth (both
gross and net), within different size classes. Large corporations are a key player in
modern economies, accounting for a large share of aggregate output and potentially
have substantial effects on the business cycle (see, e.g., Gabaix, 2011). However, as
pointed out in the previous literature, large firms are usually associated with lower
creation compared to small enterprises. The fact that previous analyses do not separate
dependent and independent enterprises might be a decisive factor behind this results.
In a recent Eurostat report (Airaksinen et al., 2015), the share of dependent enterprise
employment within the small and medium enterprises (SME) category is documented to
be substantial in several European countries, including Finland. This result casts doubt
on many previous conclusions in the small versus large literature where the SME status
is systematically defined by the number of employees only, regardless of the ownership
structure. For example, the statistical result that small firms tend to create more jobs
looser control, it is arguable the employment generation of small dependent enterprises
could be impacted by the decisions of the mother company. If dependent, small firms
are behind the large job creation rates of SMEs, then the narrative of small businesses
being the driver of employment generation should actually being interpreted in the light
of large corporations creating jobs through subsidiaries.
The contribution to job creation by dependent and independent enterprises has
not been studied extensively in the literature. A notable exception is Boccara (1997),
where the author examines the job growth stemmed from small and medium firms
belonging to enterprise groups in France during the 1984-1992 period, finding that the
small firms belonging to large business groups exhibit higher job creation. Another
work which touches the issue of dependencies and employment growth is the OECD
report Schreyer (2000), in which the author discusses possible economic channels behind
the relationship. Small firms might have multiple benefits from belonging to a large
corporation. Subsidiaries owned (even partly) by a large company might have a better
access to financing (both internal and external), together with more informal advantages
such as access to a wider human capital and information related to market conditions
and technology. However, there are possible channels leading to a negative impact of
dependencies onto job creation. Large firms could consider their small subsidiaries as
a small part of the production chain which must perform a well defined and limited
amount of tasks, without reasons to grow in size.
We use monthly employment data of Finnish firms to study how the dependence
to large companies affect the job creation (both gross and net) of small enterprises.
The data, extracted from the Statistics Finland database, allows us to verify if an
enterprise belongs to a business group and how large is the share of the firm owned
by the mother company, giving us the possibility to disentangle control from more
informal dependencies and networks. The employment figures are adjusted to represent
the ’organic’ growth of the firms, disregarding the effects of merger, split-offs and other
legal restructuring. In addition, we examine the possible heterogeneity between the
different industries of the economy (e.g. manufacturing and services), which might have
an impact on how belonging to an enterprise group affects the job creation of a company.
For example, it is likely that in the service industry, where human capital plays a larger
role, firms benefits more from dependencies and connections than in, e.g., constructions.
aggregate economic conditions. In particular, we examine the job flows of firms with
different ownership structures during periods of economic expansion (which we identify
as periods in which monthly output is above trend) and economic downturns (output
below trend).
We find that small, medium and micro independent firms have experienced
consis-tently higher growth rates compared to their dependent counterparts, regardless of the
size classification methodology and age (i.e. considering only long lasting enterprises).
On the other hand, the effect of dependencies is not unique across industries. In
partic-ular, while dependent firms exhibit lower job creation rates inside the trade, services
and construction industries, the negative effect of dependencies disappears or reverts
in the manufacturing and financial sectors. Finally, we do not find a clear effect of
dependencies onto the sensitivity to the business cycle for SMEs enterprises.
The remainder of the paper is structured as follows: In Section 2 we describe the
main methodological issues underlying the analysis, in Section 3 we briefly describe the
data and in Section 4 we present the results of the analysis. Section 5 concludes.
2
Methodological issues
The analysis of job creation and its relation with the firm size is highly sensitive to the
data source and the methodology adopted. For example, the criterion to determine
if a given enterprise is to be included in the small or large size class is not uniform
over the literature and using different selection procedures can yield very disparate
results. In the work of Birch (1981), firms are included in the small class if the number
of employees during the base year of the job growth calculation was below a threshold.
This criterion, as argued by Davis et al. (1996) among others, can lead to a serious
overestimation of the job creation stemmed from smaller businesses. In particular,
using the base year to classify a firms will lead to include many enterprises affected
by temporary negative shocks in the small class (this phenomenon is addressed in the
literature as the regression to the mean bias). Neumark et al. (2011) find that, using the
base year classification of Birch (1981), small firms are generating a substantial larger
share of employment compared to big enterprises. However, when they use the firms’
average size the gap between the job creation of small and large businesses shrinks
substantially.
dynamic size classification method: enterprises are classified each year, using the average
between the two years on which the growth rate is computed. The number of FTEs
obtained is then compared to the cutoff points used by Statistics Finland to determine
the size class of a company. As discussed in papers such as Davis et al. (1996) and
Haltiwanger et al. (2013), this type of classification is robust to the regression to the
mean bias (firms wrongly classified because of temporary shocks). However, allowing
companies to change size class over time tends to exacerbate the sensitivity of the
enterprises to the business cycles. As discussed in Moscarini and Postel-Vinay (2012),
during times of economic hardship we can expect firms to move to the small category
and vice versa during expansions.
The second size classification criterion we use is called average size classification
and it is based on the mean number of employees (full time equivalents in our case)
computed over the existence of the firm. As in the case of thedynamic classification,
this methodology is robust to the regression to the mean bias. However, contrary to
the dynamic classification, this methodology does not suffer from procyclicality issues.
One problem with the average size classification is that it relies on the assumption
that firms reach a long-term scale of operations during their lifespan, implying that the
process underlying a firm’s size is stationary.
The key measures of the analysis reported in Section 4 are the gross job creation,
gross job destruction and net job growth. The gross job creation is defined as the sum
of positive changes in the number of FTEs within a certain firm category, i.e. we have
gct=
PN
i dE
+
it where dE
+
it are the positive changes in employment between time t and
t−12and which are then summed over the N firms belonging to a certain class. Job
destruction is defined asgdt =PNi |dEit−|, with dEit− being the negative change in the
number of FTEs for company i. Importantly, we use the adjusted values for the FTEs
in the base year, to control for mergers and acquisitions (details on the methodology
are provided in the Appendix) and obtaining a measure of the organic growth of a
firm. The net job creation is defined as the difference between gross job creation and
job destruction. Finally, we compute two measures of net job creation rate. The first
one is used to compute the contribution to the overall net job creation by a category
of companies. Denoting the net job creation at time t for category C as N JCtC, we
compute
N JCR1
t,C =
N JCt,C
(1/2Et+ 1/2Et−1),
where Et is total employment. The denominator in (1) is suggested throughout the
literature (e.g. Moscarini and Postel-Vinay, 2012) because it is more robust the
regression to the mean bias. Another interesting measure is
N JCR2
t,C =
N JCt,C
(1/2Et,C + 1/2Et−1,C),
(2)
whereEt,C indicate the total number of employees in categoryC, making (2) a indicator
of how a certain category is growing over time.
A final issue worth discussing in this section is the role firms’ age. As pointed out in
Haltiwanger et al. (2013), the age of a company is a key determinant in explaining its
job creation. In particular they show that, after controlling for age, there is no clear
difference in the net job creation rate of small and larger companies. To make sure
that our results are not driven by the longevity of the firms we examine, we consider a
subset of companies which are present throughout our sample period. In this way, we
can analyze a subsample of firms which have been long lasting and should be of roughly
similar age.
3
Data Description
The data is extracted and anonymized at the premises of Statistics Finland, the Finnish
national statistics agency. The data contains monthly observations of persons employed
(as full time equivalents, FTEs) for the entire business sector, excluding public sector and
primary producers. Thus, we analyze the employment generation patterns of enterprises
that are active in the business economy. The analyzed enterprises are classified by
Statistics Finland into broad activity categories based on the classification of economic
activities system in the EU (NACE Rev. 2). In order to control for heterogeneities
arising from the different activity categories, we group the enterprises in manufacturing,
construction, trade, services and finance industries.
The Finnish Business register contains information on ownership links between the
enterprises that belong to a group. Furthermore, the register holds information on the
nationality of the enterprise group, and thus the Statistics agency is able to distinguish
between foreign and domestically owned enterprise groups. By linking these data
sources at micro-level, we are able to pinpoint whether at any given time an enterprise is
owned by a mother company, or the enterprise is a mother company itself), "controlled"
(the mother company owns over 50% of the enterprise), or "foreign controlled" (the
enterprise group head is foreign, and its ownership exceeds 50%). After applying these
classifications to the enterprises, we use two sets of data. The first sample includes
monthly observations of employment destruction and creation for all the enterprises
that are active at any given month between January 1998 and September 2014, and the
second sample includes employment creation and destruction of only those enterprises
that are present for the full sample period, thus excluding entries and exits. Net job
creation computation are based on adjusted FTEs, where the effects of mergers and
split-offs are eliminated by the methodology of Statistics Finland. For the foreign
controlled enterprises, the data is available only from January 2007 onward and hence
is analyzed in a separated subsection.
The sample including entries and exits contains 253,685 enterprises in September
2014 and 234,257 enterprises in January 1998. The sample where only long lasting
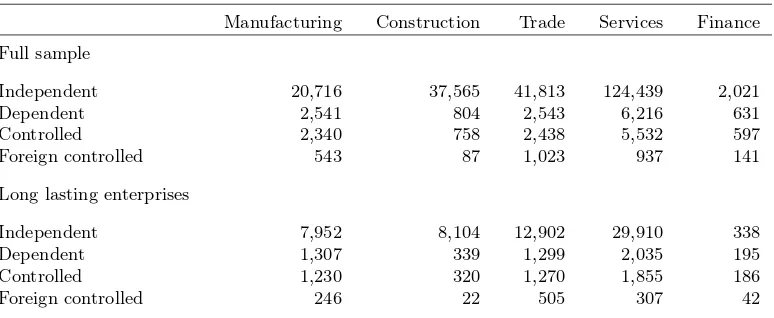
enterprises are included contains 70,356 enterprises. The following tables provide the
number of enterprises in each of the analyzed categories by industry (Table 1) and size
category (Table 2) in 07/2014 for both samples, in order to characterize the data and
the Finnish business economy.
Manufacturing Construction Trade Services Finance Full sample
Independent 20,716 37,565 41,813 124,439 2,021 Dependent 2,541 804 2,543 6,216 631 Controlled 2,340 758 2,438 5,532 597 Foreign controlled 543 87 1,023 937 141
Long lasting enterprises
[image:8.595.112.499.467.626.2]Independent 7,952 8,104 12,902 29,910 338 Dependent 1,307 339 1,299 2,035 195 Controlled 1,230 320 1,270 1,855 186 Foreign controlled 246 22 505 307 42
Micro Small Medium Large Full sample
Independent 216,093 9,634 775 52 Dependent 6,643 3,816 1,727 549 Controlled 5,840 3,611 1,672 542 Foreign controlled 1,110 918 500 203
Long lasting enterprises
Independent 54,041 4,728 400 37 Dependent 2,163 1,862 855 287 Controlled 1,963 1,783 832 283 Foreign controlled 313 448 261 100
Table 2: Number of enterprises on September 2014, divided by class size and dependency status
While the figures reported in Table 1 point toward dependent firms being a small
share of the overall population of enterprises, Table 2 provides key information to
motivate this analysis. The number of dependent medium-sized and small enterprises
represents a large share of the total, highlighting the fact that disregarding the possible
links between larger companies and subsidiaries might bias the results for two important
size class of firms such as the small and medium enterprises.
4
Results
We start our empirical analysis by studying the relationship between firm size and the
measures of interest reported in Section 2. In this fashion, we can compare the Finnish
setting with the findings obtained in studies as, e.g. Davis et al. (1996) and Haltiwanger
et al. (2013).
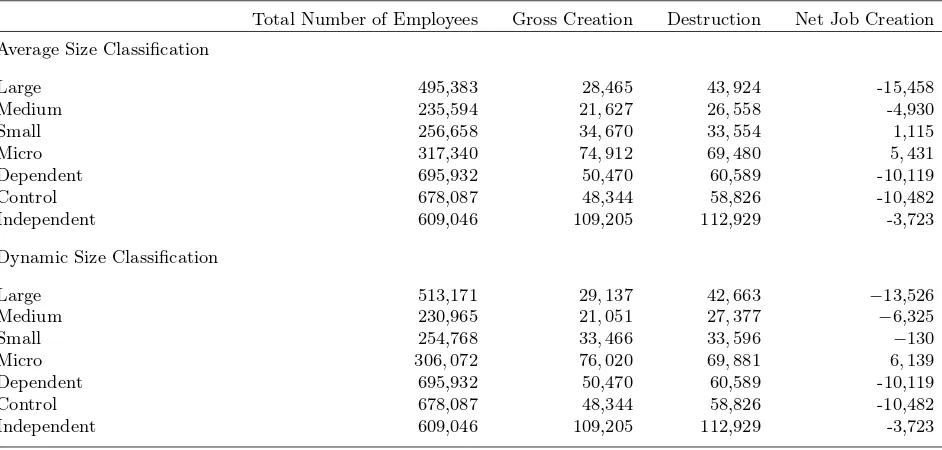
In particular, in Table 3, we report the total number of employees, the gross job
creation and destruction, together with net job creation, for large and SMEs (i.e. the
category encompassing small, medium and micro firms) companies. Moreover, we
compare enterprises with different dependencies status, even though we do not separate
firms of different size class within the same dependency class. We report results for
both dynamic and average size classification and the results are expressed in terms of
Total Number of Employees Gross Creation Destruction Net Job Creation Average Size Classification
Large 495,383 28,465 43,924 -15,458
Medium 235,594 21,627 26,558 -4,930
Small 256,658 34,670 33,554 1,115
Micro 317,340 74,912 69,480 5,431
Dependent 695,932 50,470 60,589 -10,119
Control 678,087 48,344 58,826 -10,482
Independent 609,046 109,205 112,929 -3,723
Dynamic Size Classification
Large 513,171 29,137 42,663 −13,526
Medium 230,965 21,051 27,377 −6,325
Small 254,768 33,466 33,596 −130
Micro 306,072 76,020 69,881 6,139
Dependent 695,932 50,470 60,589 -10,119
Control 678,087 48,344 58,826 -10,482
[image:10.595.87.558.88.313.2]Independent 609,046 109,205 112,929 -3,723
Table 3: Average number of total number of employees, gross creation, destruction and net job creation. Enterprises are divided by size class and dependency status
The figures reported in Table 3 are somewhat similar to what has been found in
the literature. Firms of smaller size exhibit large gross job creation and destruction,
especially the enterprises in the micro category. Independently from the size classification
methodology, large firms are the most important employer of the Finnish economy,
considering the average number of FTEs between 1998 and 2014. At the same time,
they have experienced the lowest net job creation, shredding on average more than
10,000 jobs on a year-on-year basis. Micro enterprises, on the other hand, seem to
be the ones contributing the most to net job growth. This result holds regardless of
the size classification method, even though the net job creation of these enterprises is
slightly smaller if we use the average classification methodology. Interestingly, by using
the dynamic size classification, micro firms are the only ones generating positive net
job creation.
From this very simple analysis, we can already draw some interesting conclusions
regarding the dependency effect on job creation. On average, dependent firms represent
the majority of the population, employing almost 100,000 employees more than the
independent enterprises. Moreover, the vast majority of employees within the dependent
firms class work in controlled enterprises. In other words, most dependent enterprises
are tightly controlled by their mother company (in terms of ownership). Independent
with the highest net job growth. However, in Table 1 we are not separating the size
effect and the dependency effect. For example, it might be that very low net job creation
of dependent firms is due to the fact the larger companies are more likely to belong to
this category and hence distort their actual contribution to job creation. Below, we
report similar figures for SMEs firms and considering different type of dependency.
Total Number of Employees Gross Creation Destruction Net Job Creation
Average Size Classification
Medium Dependent 161,656 13,288 16,513 -3,224
Small Dependent 72,757 8,665 9,608 -942
Micro Dependent 16,137 3,341 3,378 -36
SMEs Dependent 250,551 25,296 29,500 -4,203 Medium Controlled 155,015 12,594 15,953 -3,359 Small Controlled 67,371 7,937 9,028 -1,090
Micro Controlled 14,223 2,945 3,028 -82
SMEs Controlled 236,609 23,477 28,010 -4,533 Medium Independent 73,938 8,339 10,045 -1,706 Small Independent 183,901 26,004 23,946 2,058 Micro Independent 301,202 71,570 66,102 5,468 SMEs Independent 559,042 105,913 100,093 5,819
Dynamic Size Classification
Medium Dependent 152,675 12,970 16,278 -3,307
Small Dependent 67,119 8,308 9,299 -991
Micro Dependent 14,736 3,253 3,562 -309
SMEs Dependent 234,531 24,532 2,9141 -4,608 Medium Control 146,267 12,332 15,746 -3,414
Small Control 61,856 7,585 8,749 -1,164
Micro Control 12,883 2,816 3,218 -401
SMEs Control 221,007 22,735 27,715 -4,979
[image:11.595.76.556.195.557.2]Medium Independent 78,289 8,080 11,098 -3,017 Small Independent 187,649 25,158 24,297 861 Micro Independent 291,335 72,767 66,318 6,449 SMEs Independent 557,274 106,006 101,714 4,292
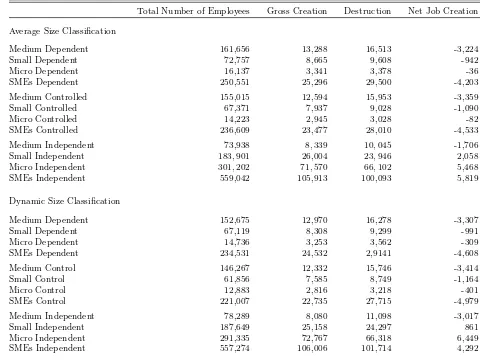
Table 4: Average number of total number of employees, gross creation, destruction and net job creation for small, medium and micro enterprises, divided by dependency status
The results reported in Table 4 underline some substantial differences between
dependent and independent firms, with respect to employment creation and destruction.
Within the small and medium enterprises, independent firms represent the largest
category, with more than the double the FTEs of dependent companies. Moreover,
independent firms have experienced a much larger gross job creation and destruction,
during our sample. Finally, companies which belong to the independent category seem
to be the main source of the positive net job creation observed for small and micro
The channels underlying the effect of dependency on firms’ job creation does not
have a clear a priori positive or negative impact. On the one hand, we expect that
small firms belonging to a corporation benefits to the access of a large stock of human
capital and knowledge which is likely to be available to the mother company. Moreover,
the subsidiary can benefit from participation to the formal and informal networks of a
large corporation, e.g. the ability to reach new clients and suppliers. These benefits
can lead to a better performance of the small company, which in turn can lead to an
increase in its size and hence to a larger job creation. On the other hand, a mother
company can consider its subsidiaries as small parts of its production process, which
are highly specialized. For example, a large mother company might be in charge of
the administrative side of multiple subsidiaries, which would not require separate staff
to handle managerial duties. In this way, the small enterprises belonging to a large
corporation would be organized in a way to achieve maximum productivity and hence
they might actually reduce the number of employees, leading to a lower job creation of
dependent companies.
The findings outlined in this subsection point toward a negative impact of dependency
onto job growth, with small companies belonging to a corporation showing negative
job creation. Small dependent firms seem to be restricted to a specialized task and do
not increase in size. The fact that they have been shredding jobs can be interpreted as
an attempt of their mother companies to achieve a high level of productivity. Another
possible explanation is that small dependent enterprises have been dragged down by
the poor performance their large mother companies, which have been declining in terms
of job creation.
4.1 The role of age: continuous firms
Even though the results of Table 4 are extremely interesting in the light of showing the
dependency effect against the size effect in job creation, we should examine another
factor that has been regarded in the literature (see, e.g., Haltiwanger et al., 2013)
as key in explaining the net job creation of different type of enterprises, i.e. firm
age. To address this issue, we use two different datasets containing dependent and
independent SME enterprises. The first dataset is the same adopted to obtain the
results in Table 3 and 4 and consider entries and exits of firms, while the second one
compare companies which have been long lasting and hence the effect of age should
be milder. For example, Haltiwanger et al. (2013) show that the effect of age on job
creation is especially strong on start-up companies, while it reduces substantially for
older firms.
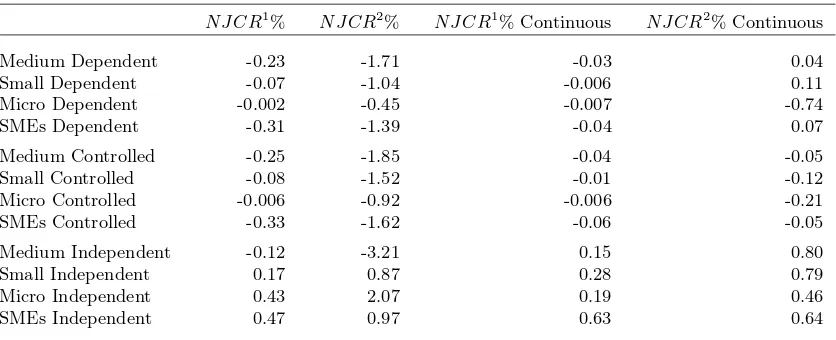
In Table 5, we report the net job creation rates for dependent and independent
medium, small and micro firms, computed using (1) and (2). To keep the analysis
contained, we consider the results for the average size classification methodology only.
N J CR1% N J CR2% N J CR1%Continuous N J CR2% Continuous
Medium Dependent -0.23 -1.71 -0.03 0.04 Small Dependent -0.07 -1.04 -0.006 0.11 Micro Dependent -0.002 -0.45 -0.007 -0.74 SMEs Dependent -0.31 -1.39 -0.04 0.07 Medium Controlled -0.25 -1.85 -0.04 -0.05 Small Controlled -0.08 -1.52 -0.01 -0.12 Micro Controlled -0.006 -0.92 -0.006 -0.21 SMEs Controlled -0.33 -1.62 -0.06 -0.05 Medium Independent -0.12 -3.21 0.15 0.80 Small Independent 0.17 0.87 0.28 0.79 Micro Independent 0.43 2.07 0.19 0.46
[image:13.595.96.514.237.407.2]SMEs Independent 0.47 0.97 0.63 0.64
Table 5: Net job growth rates for micro, small and medium sized enterprises, divided by dependency status. Both the dataset with entries and exits and the one with long-lasting firms only are considered and results are obtained using the average size classification.
The results included in Table 5 confirm the strong effect of dependencies on the net job
creation and the rate of growth of firms of different size class. Enterprises which depend
or are controlled by a mother company have lower job creation rates and seem to grow
less. The effect is especially pronounced for small and micro enterprises, while medium
independent enterprises seem to have a lower growth rate, with respect to their initial
size (i.e. looking at N JCR2
), compared to their dependent counterparts. However,
they have a larger net job creation with respect the overall number of employees.
These considerations are not affected by shifting our focus to continuous enterprises.
When we consider more stable companies, the net job creation rates and the growth rates
of dependent firms become less negative or even turn positive. However, independent
firms are still the ones that have contributed the most to employment generation.
Overall, it seems that taking firms’ age into consideration, while still important, does
4.2 Cyclical Analysis
The results discussed in the previous subsections evidence the strong impact of ownership
structure onto the average gross and net job creation. It is also interesting to analyze
how dependency from a mother company affects the sensitivity of a firm to the business
cycle. To do this we compute the euclidean distance between the mean net job creation
of a certain category of firms during periods of low and high economic growth. A
contractionary period is defined as month in which the indicator of real economic
activity1 is below its trend and vice versa for an expansionary period.
In other words, our measure of sensitivity to aggregate economic conditions is given
by:
ΓC =
q N JC2
Rec,C+N JC
2
Exp,C
EC
, (3)
where N JCRec,C is the average net job creation for category C during periods of slow
economic growth and N JCExp,C is the same measure taken during period of good
aggregate economic conditions. Finally,EC is the average number of FTEs for category
of firms C, which is used to make the figure comparable across companies of different
class sizes and dependency status. Intuitively, a low value of ΓC indicates that the
employment generation of a certain type of enterprises does not vary substantially
during different macroeconomic conditions. On the other hand, a large value of this
indicator points toward a remarkable sensitivity of certain class of firms to the business
cycle.
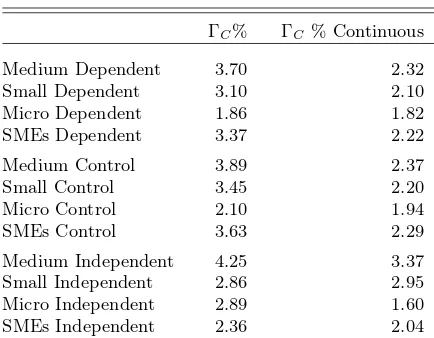
We report, in Table 6, this measure of sensitivity to the business cycle for SME firms
of various ownership structure, considering both the dataset which includes entry and
exit and the one with only continuous companies.
1We use the Trend Indicator of Output (TIO), produced by Statistics Finland, as monthly measure of real economic
ΓC% ΓC % Continuous
[image:15.595.195.412.82.251.2]Medium Dependent 3.70 2.32 Small Dependent 3.10 2.10 Micro Dependent 1.86 1.82 SMEs Dependent 3.37 2.22 Medium Control 3.89 2.37 Small Control 3.45 2.20 Micro Control 2.10 1.94 SMEs Control 3.63 2.29 Medium Independent 4.25 3.37 Small Independent 2.86 2.95 Micro Independent 2.89 1.60 SMEs Independent 2.36 2.04
Table 6: Sensitivity of micro, small and medium sized enterprises to aggregate economic conditions. Higher numbers indicate more sensitivity to the business cycle. Both the dataset with entries and exits and the one with long-lasting firms only are considered.
Looking at Table 6, we see that the sensitivity to business cycles varies widely across
different types of firms. First of all, it seems that micro firms tend to be more stable
with respect to different aggregate economic conditions. While this can be surprising in
the light of works such as Gertler and Gilchrist (1994), where smaller enterprises are
seen as especially sensitive to economic downturn, it resembles the conclusions obtained
in Moscarini and Postel-Vinay (2012). In their analysis, the authors found that larger
firms employment behavior exhibits stronger correlation to the business cycle.
Firms’ age also plays an influential role in terms of the sensitivity to the
macroeco-nomic cycle. This comes as no surprise, given that we expect older firms to fluctuate less
and because we omit entries and exits, which are heavily affected by different economic
conditions. The dependency status, however, does not seem to have a clear effect on
the cyclicality of job creation. For example, independent medium and micro enterprises
seem to be more sensitive to the aggregate economic environment compared to their
dependent counterpart, while the opposite holds for small firms and SME category as
a whole. A pretty important exception stands in the behavior of foreign-controlled
enterprises. Interestingly, we can see that SMEs which depend on a foreign mother
company exhibit a substantially higher sensitivity to the business cycle.
Overall, while dependencies have a strong effect on the average job creation, it does
4.3 Sectoral Analysis
So far, we have analyzed firm-level data without distinguishing the industry to which a
certain enterprise belongs to. We can expect that the effect of dependencies to vary
across different industries. For example, the sharing of know-how between the mother
company and its subsidiaries might be more relevant in firms working in the service
sector compared to the ones working in the construction or manufacturing sector.
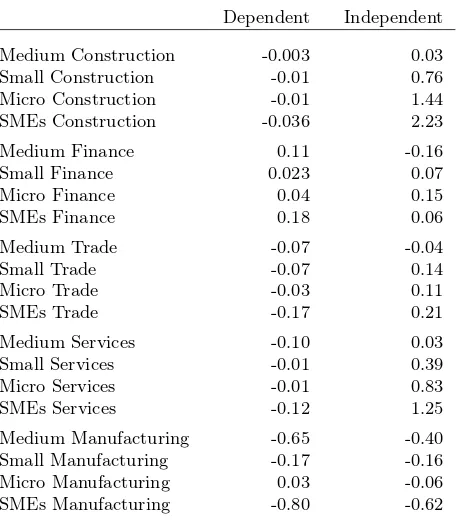
In Table 7, we examine the net job creation rate defined following (1), where we use
the total number of employees belonging to an industry as the denominator. We do
this for dependent and independent SME firms belonging to various industries. For the
sake of brevity, we limit our analysis to the dataset including entries and exits, and to
the average size classification method.
Dependent Independent
[image:16.595.191.420.331.591.2]Medium Construction -0.003 0.03 Small Construction -0.01 0.76 Micro Construction -0.01 1.44 SMEs Construction -0.036 2.23 Medium Finance 0.11 -0.16 Small Finance 0.023 0.07 Micro Finance 0.04 0.15 SMEs Finance 0.18 0.06 Medium Trade -0.07 -0.04 Small Trade -0.07 0.14 Micro Trade -0.03 0.11 SMEs Trade -0.17 0.21 Medium Services -0.10 0.03 Small Services -0.01 0.39 Micro Services -0.01 0.83 SMEs Services -0.12 1.25 Medium Manufacturing -0.65 -0.40 Small Manufacturing -0.17 -0.16 Micro Manufacturing 0.03 -0.06 SMEs Manufacturing -0.80 -0.62
Table 7: Net job creation for micro, small and medium sized enterprises, divided by industry and dependency status. We consider only the average classification methodology and the dataset with entries and exits.
Table 7 highlights some interesting industry specific features to the relationship
between dependency and job creation. Importantly, there is no a unique effect of
dependency across industry. While we see that independent companies belonging to
the service, trade and construction industries show substantially larger net job creation
and manufacturing industries. In particular, the net job creation of enterprises in
manufacturing do not seem to be affected by the dependency status. Moreover, we find
that independent firms in the finance industry have experienced lower growth compared
to the dependent ones.
The results reported in this subsection shed some more light onto the possible
interpretation of the general finding of the negative impact of dependency on job
creation. One can argue that in the service and trade industries the mother company
can intervene strongly in the administration side of its subsidiaries, which are then
limited to some specialized tasks. On the other hand, in the manufacturing industry it
is likely that the mother company cannot centralize some activities in the same fashion.
4.4 The Role of Foreign Ownership
As mentioned in Section 3, our data on foreign controlled enterprises start in January
2007. Given that this period is of particular importance, in the light of the Great
Recession, and given the possible idiosyncrasies characterizing firms belonging to a
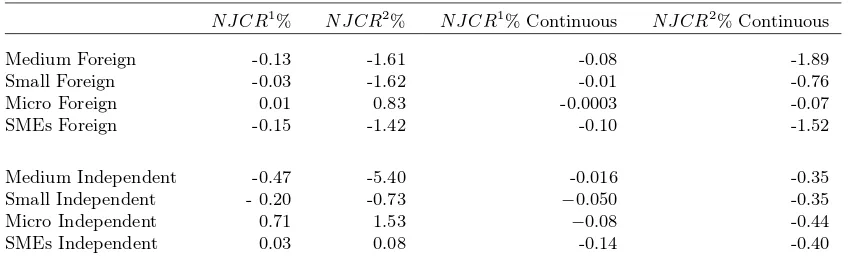
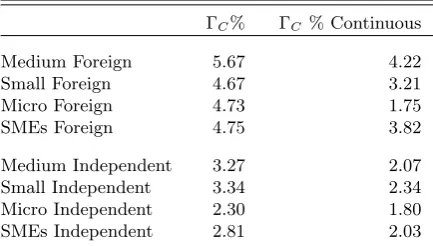
foreign corporation, we decided to analyze them separately. In tables 8 and 9, we
report both net job creation rate measures defined in Section 2 and the business cycle
sensitivity indicator, respectively. We compare foreign controlled firms with the behavior
of independent companies during the same sample period and consider both the data
including entry and exit and the one with continuous firms only.
N J CR1% N J CR2% N J CR1%Continuous N J CR2% Continuous
Medium Foreign -0.13 -1.61 -0.08 -1.89 Small Foreign -0.03 -1.62 -0.01 -0.76 Micro Foreign 0.01 0.83 -0.0003 -0.07
SMEs Foreign -0.15 -1.42 -0.10 -1.52
Medium Independent -0.47 -5.40 -0.016 -0.35 Small Independent - 0.20 -0.73 −0.050 -0.35
Micro Independent 0.71 1.53 −0.08 -0.44
[image:17.595.93.517.513.646.2]SMEs Independent 0.03 0.08 -0.14 -0.40
ΓC% ΓC % Continuous
Medium Foreign 5.67 4.22 Small Foreign 4.67 3.21 Micro Foreign 4.73 1.75 SMEs Foreign 4.75 3.82
[image:18.595.196.413.86.209.2]Medium Independent 3.27 2.07 Small Independent 3.34 2.34 Micro Independent 2.30 1.80 SMEs Independent 2.81 2.03
Table 9: Sensitivity of micro, small and medium sized enterprises to aggregate economic conditions. Higher numbers indicate more sensitivity to the business cycle. Both the dataset with entries and exits and the one with long-lasting firms only are considered.
Tables 8 and 9 highlight some surprising results which go in a different direction
compared to what we have found so far. Medium and small foreign-controlled firms
show a higher (albeit still negative) net job creation rate from 2007 to 2014, compared
to their independent counterparts. On the other hand, micro independent enterprises
had a much better performance, in terms of job creation. Looking at the over SMEs,
we find that both net job creation rate measures indicate a superiority of independent
firms in generating employment. For long-lasting enterprises we find that the for all
SMEs firms the dependence status has a positive effect on the net job creation rate,
but they have grown less (as evidenced by lowerN JCR2
).
The results contained in Table 9 evidence a clear characteristic of foreign-controlled
firms, i.e. their high sensitivity to the business cycle. Enterprises that are controlled by
a foreign corporation adjust better to different economic conditions and adjust their
employment level accordingly. This holds true for both the data including entry and
exits and the one with only continuous firms.
5
Conclusions
We contribute to literature on the relationship between firms’ size and job creation
by investigating an additional source of heterogeneity within the SMEs, i.e. their
dependency status. In particular, we separate the small and medium enterprises
population using different degrees of control and examine their gross job creation and
destruction, together with their net job growth.
We find that independent SMEs have experienced, on average, higher net job creation
size classes and different degrees of control. Moreover, we find that the negative effects
of dependency onto job creation is present also when we examine only long-lasting
enterprises. On the other hand, SMEs in different industries exhibit different patterns.
Importantly, dependency status does seem to play a role in the job creation for the
manufacturing industry. Finally, we do not find a specific impact of dependencies onto
the sensitivity of SMEs to the business cycle.
There are multiple channels that can explain the negative effect of being a subsidiary
on the job creation of small firms. First of all, dependent enterprises are more than likely
influenced by their mother company in their hiring decisions. If the mother company is
shredding jobs, as it can be seen in the very negative net job creation of large companies
in Table 3, it will probably impact its subsidiary, by blocking the creation of new jobs
or even imposing job cuts to its small affiliates. Another explanation can be found in
the attempt to achieve higher productivity. It is possible for the mother company to
centralize some tasks which were previously conducted within the subsidiary. In this
view, the mother company sees the small subsidiary as a small part of the production
process and does not have particular incentives in increasing the scale of its controlled
firms.
The analysis conducted in this paper can be extended in multiple ways. First of
all, we can examine different aspects of dependent and independent SMEs, other than
employment. For example, we could look at labor productivity or the value added
produced in different types of small enterprises, based on their dependency status.
Moreover, it could be interesting to analyze the share of firms contributing to the
negative and positive job creation inside a given category. In this way, we could see if
the negative job creation is generated by the largest companies within a size class or if
the contribution to the job creation is evenly distributed.
References
Aarno Airaksinen, Henri Luomaranta, Pekka Alajääskö, and Anton Roodhuijzen.
De-pendent and indeDe-pendent SMEs and large enterprises. Statistics explained, Eurostat,
2015.
Michael Anyadike-Danes, Carl-Magnus Bjuggren, Sandra Gottschalk, Werner Holzl, Dan
Johansson, Mika Maliranta, and Anja Myrann. An international cohort comparison
David L. Birch. Who Creates Jobs? Public Interest, 65(3):3–14, 1981.
Frédéric Boccara. Mythes et réalités sur l’emploi et la croissance des PME : le rôle des
groupes (1984-1992). Document de travail, INSEE, 1997.
Chiara Criscuolo, Peter N. Gal, and Carlo Menon. The Dynamics of Employment
Growth: New Evidence from 18 Countries. CEP Discussion Papers dp1274, Centre
for Economic Performance, LSE, June 2014.
Steven J. Davis, John Haltiwanger, and Scott Schuh. Small Business and Job Creation:
Dissecting the Myth and Reassessing the Facts. Small Business Economics, 8(4):
297–315, August 1996.
Roberta Distante, Ivan Petrella, and Emiliano Santoro. Size, Age and
the Growth of Firms: New Evidence from Quantile Regressions.
Work-ing Papers 2014.69, Fondazione Eni Enrico Mattei, July 2014. URL
https://ideas.repec.org/p/fem/femwpa/2014.69.html.
Xavier Gabaix. The Granular Origins of Aggregate Fluctuations. Econometrica, 79(3):
733–772, 05 2011.
Mark Gertler and Simon Gilchrist. Monetary Policy, Business Cycles, and the Behavior
of Small Manufacturing Firms. The Quarterly Journal of Economics, 109(2):309–340,
1994.
John Haltiwanger, Ron S. Jarmin, and Javier Miranda. Who Creates Jobs? Small
versus Large versus Young. The Review of Economics and Statistics, 95(2):347–361,
May 2013.
Satu Hohti. Job flows and job quality by establishment size in the finnish manufacturing
sector 1980-94., 2000.
Pekka Ilmakunnas and Mika Maliranta. The turnover of jobs and workers in a deep
re-cession: evidence from the finnish business sector. International Journal of Manpower,
24(3):216–246, 2003.
Giuseppe Moscarini and Fabien Postel-Vinay. The Contribution of Large and Small
Employers to Job Creation in Times of High and Low Unemployment. American
David Neumark, Brandon Wall, and Junfu Zhang. Do Small Businesses Create More
Jobs? New Evidence for the United States from the National Establishment Time
Series. The Review of Economics and Statistics, 93(1):16–29, August 2011.
Paul Schreyer. High-Growth Firms and Employment. OECD Science, Technology and
Industry Working Papers 2000, OECD, 2000 2000.
Gerrit Wit and Jan Kok. Do small businesses create more jobs? New evidence for