Munich Personal RePEc Archive
Mercosur- EU Trade negotiations:
ending trade diversion, strengthening
trade institutions
Nogues, Julio J.
Academia Nacional de Ciencias Economicas, Argentina
2017
Online at https://mpra.ub.uni-muenchen.de/92287/
Trade, Law and Development
9(1) Trade L. & Dev. 1 (2017)
http://www.tradelawdevelopment.com/index.php/tld/issue/view/
9%281%29%20TL%26D%20%282017%29
Mercosur- EU Trade Negotiations: ending trade diversion, strengthening trade institutions
Julio J. Nogués1
Abstract
After a long impasse, Mercosur and the European Union are once again negotiating to reach a Free Trade Agreement. The benefits from such a trade liberalization would be significant since these are essentially complementary economic regions. An agreement would also end decades of costly trade diversion effects and few of these are quantified in this paper. But, trade is only one of the important issues in these negotiations. The biggest Mercosur countries are making efforts towards leaving behind a decade long experiment with populism that violated several World Trade Organisation rules while Europe is increasingly being threatened by right wing populism that is outspoken in favor of inward-looking economic and social policies. A Mercosur-EU would create a significant economic region with enormous potential for trade creation; such an agreement would also serve to strengthen western trade institutions and challenge the populist threats that is hanging over both of these regions.
I. Introduction
After more than a decade of minimal progress, the European Union [EU] and Mercosur are actively negotiating with the goal of reaching
an agreement on a Free Trade Agreement [FTA].2 Shortly after
1 Member, Academia Nacional de Ciencias Economicas Argentina (www.anceargentina.com). Email Id:
noguesjuliojorge@gmail.com. I am gratefull to J. Michael Finger for commenting on a preliminary draft of this paper. Any remaining errors are my sole responsibility.
2 The negotiations are being held under the principles of Interregional Framework Cooperation Agreement
these talks were initiated in the late 90s, Argentina and Brazil shifted towards extremely inward oriented trade policies guided by corrupt left-wing populism that openly violated many of the most significant World Trade Organisation [WTO] rules. Recently, the economic and political vision in both of these countries have once again shifted towards outward orientation and this has opened the opportunity for reaching an agreement with the EU.
Important issues are at stake including trade goals. Likewise, but perhaps as important, in a world characterized by expanding populism, both sides have significant institutional themes that need
to be developed and strengthened.3 How should parties assess the
extent to which these negotiations will be beneficial to their people and economies? On the extreme end, one of the possible negotiating goals would be a strategy where each party attempts to come out as a clear winner in terms of market access; however, this would ignore the times we are living in. The near term outlook calls for a vision among like-minded politicians regarding the importance of strengthening increasingly threatened trade institutions.
On the trade side, this paper reminds that since their inception, both the European Community [EC] and the EU have been very successful in expanding their internal markets as well as in negotiating and implementing numerous FTAs with non-member countries. In contrast, Mercosur has failed to expand markets either through inclusion of new countries (except troubled Venezuela!) or signing FTAs. A brief review of the literature and new estimates presented below suggests that a successful outcome will put an end to much of the costs associated with growing trade diversion that each region has inflicted on the other.
Under the latest populist experience of Argentina and Brazil, trade flows (exports and imports) were quantitatively managed by few
3 For a discussion of populism in Latin America during the last decade see Steven Levitsky & Kenneth M.
Roberts, The Resurgence of the Latin American Left, THE JOHNS HOPKINS UNI. PRESS, https://edisciplinas.usp.br/pluginfile.php/394272/mod_resource/content/1/The%20Resurgence%20of%20 the%20Latin%20Ame%20-%20Steven%20Levitsky%20Intro.pdf. For a macroeconoomic analysis of populism in Latin America see Jose L. Machinea, “Populismos latinoamericanos a comienzos del siglo XXI: una caracterización económica” in Funglode and Fondation Maison des Sciences de l’Homme (Paris) (2017 in print). For a recent perspective of populism in the US and Europe see JOHN B. JUDIS, THE POPULIST
bureaucrats who, after a formal petition from private firms and persons, would arbitrarily decide which would be approved or disapproved; this system meant adoption of corrupt means by all the
parties involved in these decisions.4 This way of enacting policies
was applied by Argentina with greater enthusiasm than Brazil.
In contrast to the big countries in Mercosur, the EU is moving towards more nationalistic and populist policy proposals and the current political environment suggests that this tendency is likely to deepen. A similar degree of arbitrary decision making has taken hold under Mr. Trump in the United States of America [US]; Mr. Trump has threatened to take a number of arbitrary micromanagement actions like increasing barriers for firms relocating abroad where production costs can be minimized. He has already imposed prohibitive immigration flows from several Muslim countries and has threatened to impose trade barriers against
countries like China and Mexico, raising risky geopolitical tensions.5
Some in Europe, like Marie Le Pen, have applauded these proposals. Under these circumstances, the leaders in favor of an open Europe should consider whether a successful negotiation with the
Mercosur—which would create one of the biggest FTA in the
world—could strengthen their case. The trade institutions of the
Mercosur countries (particularly Argentina and Brazil) would also benefit greatly from a successful negotiation with the EU for it would help them lock-in reasonable trade rules.
Also, on the trade front, the best case scenario is an agreement that would open highly protected markets (mainly agriculture in Europe and some highly protected industrial sectors and services in Mercosur). This time economists cannot just conclude that this FTA
4 See Elias A. Baracat et al., Trade Reform and Institution Building: Peru and Argentina in the WTO, 14(2) WORLD
TRADE REV. 579 – 615 (2015) [Baracat, Trade Reform].
For the underlying book extending the details and analysis of this paper see ELIAS A. BARACAT ET AL., SUSTAINING TRADE REFORM:INSTITUTIONAL LESSONS FROM ARGENTINA AND PERÚ(World Bank, 2013), http://documents.worldbank.org/curated/en/782131468003316059/pdf/796180PUB0REPL00Box377374 B00PUBLIC0.pdf
5 See Gary Clyde Hufbauer, As President, Trump Can Shackle Trade. But Will He?, Peterson Inst. for Int’l Eco.
will result in winners and losers. If this agreement stands, parties have to ensure that workers losing their jobs will be adequtely compensated.
The rest of this paper has the following order: Section II reviews previous estimates of trade diversion effects triggered by the early expansions of the EC as well as the creation of Mercosur. Section III offers new estimates of trade diversion effects from the enlargement of the EU to several central and eastern European countries. Section IV will address other trade related issues like the political economy and rent-seeking; it also offers comments on threats from the growing populist tide in Europe, which also remains a political menace to Mercosur countries. The author offers few final remarks in Section V.
II. Trade and Trade Diversion Between the EC and Mercosur
This section starts by offering a brief review of the economic complementarity between Mercosur and the EU. Subsequently, it reviews part of the literature analyzing the trade diversion effects against the Mercosur from the EC’s expansions during the 80s and 90s and against the EC and other countries following the creation of the Mercosur.
1. Complementary Trade between Mercosur and the EU
The EU is Mercosur’s most important trading partner. According to the data published in trademap, in 2015 the aggregate exports from Mercosur to the EU28 reached USD 46,847 million and accounted for 16% of total exports while EU’s exports to Mercosur reached USD 54,122 million.
Trade patterns reflect the comparative advatage of these regions: Mercosur is relatively well endowed with natural resources and the
EU is relatively well endowed with capital.6Accordingly, “Mercosur
6 Estimates show that in terms of potential income gains for Mercosur, an ambitious FTA with the EU is at
is the biggest exporter of agricultural products to the EU (43% of total) and raw materials (28% of total), while the EU mostly exports manufactured products to Mercosur (machinery, transport equipment and chemicals). The EU is also a major exporter of commercial services to Mercosur, as well as one of the the biggest
foreign investor in the region.”7
2. Trade Diversion Effects Against Mercosur from the Expansions of the EC and EU During the 80s and 90s
Initially before it became the EU in 1993, the EC completed several expansions towards western and south European countries. More recently in 2004 and 2007, the EU expanded to several central and eastern European countries. Furthermore and most significantly, in 1962 the then EC Members (Belgium, France, Holland, Italy and Luxembourg) agreed to implement the highly protectionist Common Agricultural Policy (CAP), which since then has had to be adopted by all the joining countries.
In case of countries that provided low protection to their agricultural sectors before joining the EC, it is most likely that their adoption of the CAP generated trade diversion effects against efficient agricultural exporters such as the Mercosur countries.
During the 80s and 90s, the EC expanded to include Greece (1981), Spain and Portugal (1986) and then the EU expanded to Austria, Finland and Sweden (1995). At the time, Greece, Spain and Portugal were mostly agricultural-based economies that provided lower agricultural protection than that mandated by the CAP. If so, these expansions must have generated trade diversion effects against efficient exporters, particularly in the case of Spain which was by far
7 For, statistics on bilateral trade flows and general information on the relationships between both regions see
PIERRE BOULANGER ET AL., EUROPEAN COMMISSION, CUMULATIVE ECONOMIC IMPACT EFFECTS OF
FUTURE TRADE AGREEMENTS ON EUAGRICULTURE (JRC Science For Policy Report, EUR28206, 2016). For the first time in the history of the GATT, the EU agreed to negotiate its agricultural protectionism in the Uruguay Round. However, it resulted in only marginal liberalization see, for e.g., J. Michael Finger & Julo J. Nogués, The Unbalanced Uruguay Round: The New Areas in Future WTO Negotiations, 25 THE WORLD ECONOMY
(2002). Furthermore, the Common Agricultural Policy of the EU continues to offer high protection to the member countries see Agricultural Policy Monitoring and Evaluation 2015, ORGANIZATION FOR ECONOMIC CO
the most economically important country joining the EC during the
80s and 90s.8
Based on the work by Goto,9 Table 1 shows the proportional
variation in the average annual share of agricultural imports by Spain and Portugal from the EC members before and after joining the EC. The table also presents the same variation for the share of imports by the old EC members from Spain and Portugal . Following enlargement, these numbers show an notable increase in the intra-regional share of agricultural trade. Surprisingly, the numbers also suggest that these expansions helped to accelerate the agricultural exports from the old EC members to the new ones more than from the new EC members to the old ones. Goto presents similar estimates for the 1981 expansion of the EC to include Greece, which shows similar effects to those presented in Table 1 for Spain and Portugal.
Figures in Table 1 are aggregates as they refer to all encompassing agricultural trade and therefore do not illuminate what was going on at the product level. In 2003, I presented disaggregated numbers for a sample of products in relation to the 1995 accession of Finland
and Sweden to the EU.10 The first example in Table 2 shows that
between 1991 and 2000 imports of apples by Sweden from Argentina declined while imports from the EU increased more than eleven times. It is clear that Sweden substituted imports that used to come from Argentina (and other efficient producers) with EU sources, which the figures suggest were previously
non-competitive.11
8 As per the figures for 2014 out of the total GDP of EU, Greece represents 1.2%; Spain and Portugal
represents 12% and; Austria, Finland and Sweden represents 7% (see Figure 7).
9 Junichi Goto, Regional Economic Integration and Agricultural Trade (The World Bank, Policy Research Working
Paper No. 1805, 1997), http://documents.worldbank.org/curated/en/377041468771280438/Regional-economic-integration-and-agricultural-trade [hereinafter Goto, Regional Economic Integration].
10 Julio J. Nogués, Mercosur Labyrinth and World Regionalism, 40 CUADERNOS DE ECONOMIA 452-459 (2003),
http://www.scielo.cl/scielo.php?script=sci_arttext&pid=S0717-68212003012100010 [hereinafter Nogués,
Mercosur Labyrinth].
Table 1: Intra regional agricultural trade of Spain and Portugal with the EC before and after 1985: share in total agricultural imports.12 The “Before” figure are an average for the period between 1976-1985 and “After” figure are an average for the period between 1986-1995.
Year Argentina EU15
1991 10,1 3,6
1992 14,5 1,9
1993 5,1 0,0
1994 2,8 0,0
1995 5,3 23,5
1996 3,9 29,8
1997 3,8 38,4
1998 3,0 37,7
1999 2,9 34,6
2000 2,1 40,9
Table 2: Sweden’s imports of apples from Argentina and the EU15 (in million USD)13
For two other products, Figures 1 and 2 show Brazil’s dramatic loss
12 Goto, Regional Economic Integration,supra note 9. 13 Nogués, Mercosur Labyrinth, supra note 10. Share of EC agricultural
imports from Spain and Portugal
Share of agricultural imports of Spain and Portugal from the EC
Before After Variation Before After Variation
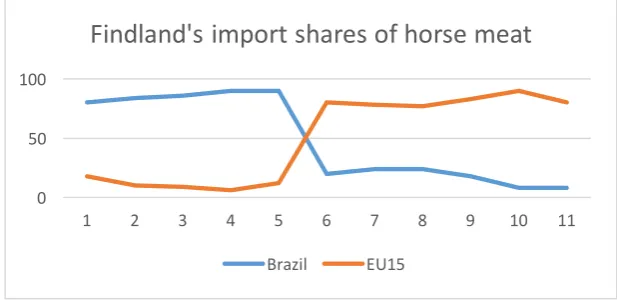
[image:8.595.79.485.315.689.2]of market share from 1990 to 2000. Figure 1 shows Brazil’s and EU15’s share in the import of horse meat by Finland, while Figure 2 shows similar numbers for orange juice imported by Sweden. In 1990, 80% of Finland’s imports of horse meat came from Brazil; but, by 2000, this share had declined to only 7%. During the same years, the corresponding share of the EC countries increased from 15% to 79%.
Figure 1: Finland’s imports of horse meat from Brazil and the EU15 between 1990 and 2000: % of aggregate horse meat imports.14
Figure 2 shows that in 1990, Brazil’s share in the imports of frozen orange juice by Sweden was 42%, but by 2000 it declined to only 16%. In contrast, the shares of EU countries increased from zero to 83%. Note that in all the three cases the crossing of the import share numbers from these two origins occurs around 1995, when in
fact Finland and Sweden joined the EU.15
14Id.
15 The next section will show that for apples and horse meat the degree of the EUs self sufficiency continued
to increase until 2014.
0 50 100
1 2 3 4 5 6 7 8 9 10 11
Findland's import shares of horse meat
Figure 2: Sweden’s imports of orange juice from Brazil and the EU15 between 1990 and 2000: % of aggregate frozen juice
imports.16
Quite clearly at the product level it is possible to find trade diversion effects that are more dramatic than what can be uncovered using aggregate agricultural trade numbers. For a sample of products, Section III will expand this type of disaggregated analysis to quantify the likely trade diversion against Argentina from the recent expansions of the EU to central and eastern European countries.
Before that let us consider the evidence on trade diversion effects on third countries triggered by the creation of Mercosur.
3. Terms of Trade Effects Against Third Countries from the Creation of Mercosur
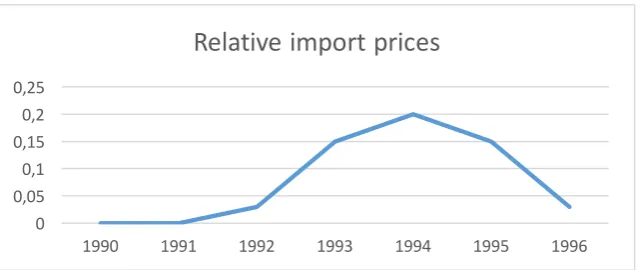
The trade diversion effects of a FTA can be studied by analyzing trade patterns as done above or by studying changes in relative prices of traded commodities between members and non-members.
In 1999, the latter approach was taken by Chang and Winters.17
Their analysis examines whether there was any difference in the import prices paid by Brazil on products coming from members and
non-members before and after the formation of Mercosur.18 One
would expect that after its formation, Mercosur’s important margins
16 Nogués, Mercosur Labyrinth, supra note 10.
17 Won Chang & L. Alan Winters, How Regional Blocs Affect Excluded Countries: The Price Effects of Mercosur (The
World Bank, Working Paper No. 2157, 1999), http://elibrary.worldbank.org/doi/abs/10.1596/1813-9450-2157revised in Won Chang & L. Alan Winters, How Regional Blocs Affect Excluded Countries: The Price Effects of MERCOSUR, 92 AM.ECO.REV. 889-904 (2002) [hereinafter Chang & Winters, Regional Blocks].
18 See Chang and Winters, 92 AM.ECO.REV. 889-904.
0 50 100
1 2 3 4 5 6 7 8 9 10 11
Sweden's imports shares of frozen orange juice
of tariff preferences provided by its Common External Tariff (CET) would have resulted in relatively higher import prices for goods coming from other members than from non-members. Put differently, one would expect the regional terms of trade to have moved in favor of Mercosur suppliers and against non-members.
Among members, Argentina was chosen as Brazil’s source of regional imports as it is the second largest Mercosur partner, which also has a diversified economy that supplies a variety of agricultural
and industrial products to Brazil.19 The non-member countries
[image:11.595.86.408.375.510.2]whose relative prices were being compared with those of Argentina included Chile, Germany, Japan, Korea and the US. Figure 3 summarizes the main findings and shows that after the formation of Mercosur, Brazil’s relative import prices moved in favor of Argentina.
Figure 3: Brazil’s relative import prices: Argentina versus sample of other exporting countries.20
Using 1991 aggregate imports as a base, the authors estimate the value of foregone exports of non-members from the decline in
regional terms of trade (ToT) to have been 10%.21 Table 3 shows
that in the sample, Germany suffered the second biggest loss; further, although other EU countries were not included, it is more than likely that following the formation of Mercosur, they also
19 INTERNATIONAL TRADE CENTRE, http://www.trademap.org. (last visited Nov.15,2017) [hereinafter
Trademap]. According to statistics published in trademap in 2016 the following were the major Harmonised System chapters covering goods exported from Argentina to Brazil: vehicles (87); cereals (10); plastics (39) and machinery (84).
20 Chang & Winters, Regional Blocks, supra note 17.
21 Chang & Winters, Regional Blocks, supra note 17. This number is not that different from the simulation that
resulted in the lower terms of trade loss for non members: USD 802 millions (Table 7).
0 0,05 0,1 0,15 0,2 0,25
1990 1991 1992 1993 1994 1995 1996
incurred exports costs from declining regional ToT.
Country
Exports to Brazil in 1991
Foregone exports from lower regional
terms of trade
Chile 524 -17,3
Germany 2,030 -236
Japan 1,350 -59
Korea 147 -14
USA 5,396 -624
[image:12.595.78.516.123.313.2]Total 9,446 -950,0
Table 3: Total 1991 exports to Brazil and losses to non
members from lower regional terms of trade (million USD).22
Lastly, Chang and Winters concluded that: “…Price data on exports to Brazil from countries excluded from Mercosur show that preferential trading agreements hurt non-member countries by compelling them to reduce their prices to meet competition from suppliers within the regional trading bloc”. It can be stated that, generally, it is difficult to believe that there can be a FTA that does
not create negative effects on non-members.23
One can speculate whether the creation of Mercosur, partially or totally, compensated the trade diversion effects from the succesive enlargements of the EU, but we can be quite sure that in terms of comparative statics both regions lost. Starting in the new milleniu,m the future that awaited both of these regional arrangements were quite different. While the EU continued to expand towards several central and eastern European countries, the Mercosur (particularly Argentina and Brazil), once again and until late 2015, embraced arbitrary import substitution policies that implied both lower regional and non-regional imports. As a result, they eliminated all
22 Chang & Winters, Regional Blocks, supra note 17.
23 This assertion is in contrast with the previous position of the EU. See, for e.g., Allen, Gasiorek & Smith,
Subseries IV - Impact on Trade and Investment, Trade Creation and Trade Diversion, THE SINGLE MARKET REVIEW
SERIES OF THE EUROPEAN UNION (1996),
possibilities of Mercosur concluding a FTA with the EU or for that matter, with any other law-abiding country. In particular, the widespread violation of WTO rules by Argentina is telling of the high degree of autarky into which its economy was taken by populist
governments.24
III.Trade Diversion Against Argentina Created by the EU Expansion Towards Central and Eastern European Countries
Before these enlargements were implemented in 2004 and 2007, several observers concluded that they would not inflict costs against non-member countries. A study by Comisión Económica para América Latina y el Caribe (CEPAL) for example concluded that: “Por su composición, parece que las exportaciones de América Latina a la Unión Europea complementan las de los países de Europa central y oriental.”25
The issue of trade overlap was brought up in another study arguing that there was no reason for Latin American Countries (LAC) to worry about the consequences of enlargement, since it would not hurt their interests; it stated that: “…for 78% of Latin American agricultural exports to the EU, there is no competitive threat from
24 Council for the Trade in Goods,Argentina’s Import Restricting Policies and Practices: Joint Statement by Australia,
The European Union, Israel, Japan, Korea, Mexico, New Zealand, Norway, Panama, Switzerland, Chinese Taipei, Thailand, Turkey and The United States, WTO Doc.G/C/W/667 (Apr. 4, 2012). This statement begins by stating that: “We would like to express jointly our continuing and deepening concerns regarding the nature and application of trade-restrictive measures taken by Argentina, which are adversely affecting imports into Argentina from a growing number of WTO Members” and ends by stating that: “We Members who support this Joint Statement request that Argentina take immediate steps to address the concerns we have raised today, and that many Members have raised in the past, by removing or terminating these import-restrictive measures and practices.” Shortly after this statement was released Argentina was taken to the Dispute Settlement Body which eventually concluded that it had violated several WTO rules and agreements. For a detailed discussion of the trade policies applied by governments during this period and the WTO dispute see,
Baracat, Trade Reform, supra note 4.
the CEEC countries.”26
At the time, I questioned these conclusions by stating that: “… The experience of the Mercosur’s countries during the 90s of rapidly expanding agricultural output and exports following structural reforms suggest that exactly the same could happen in the CEECs
with negative effects on third countries.”27 As analyzed, for example
by Bierut et. al., this was what eventually happened.28
This section analyzes trade patterns that point in the direction of trade diversion effects against Argentina post the the 2004 and 2007
EU enlargements29. Argentina is used here as an example of the
broader effects that are likely to have occurred against the other Mercosur countries that export agricultural products. First, we present brief considerations on the aggregate statistics on income and per capita exports of the new EU members. Then, we discuss several pieces of information regarding the structure and the extent of agricultural protection that these countries had prior to the enlargement of EU and their adoption of the CAP. Finally, for a small sample of products (honey; wine; horse meat; sunflower oil;
apples and animal feed),30 we analyze the indicators that suggest the
occurence of trade diversion effects against Argentina triggered by these latest EU enlargements.
1. Aggregate Trade Patterns
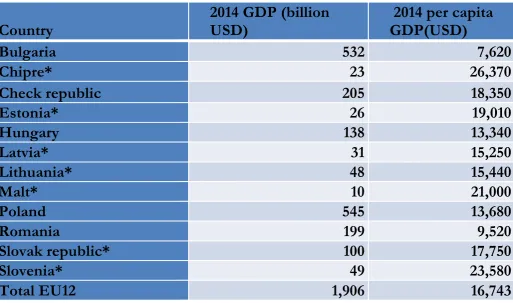
Table 4 shows GDP and per capita GDP of the new members. It is well known that the difference in the average degree of economic development between the EU15 and the new members, which for simplicity we will call EUnew, is quite telling. In 2014 the EU15 had
26 SERGIO A. BERUMEN,CLOSER EUROPEAN UNION LINKS WITH EASTERN EUROPE: IMPLICATIONS FOR
LATIN AMERICA (1997). CEEC stands for “Central and East European Countries” [hereinafter BERUMEN, EUROPEAN UNION].
27 Nogués, supra note 10 at 456.
28 Beata K. Bierut & K. Kuziemska-Pawlak, Competitiveness and Export Performance of CEE countries (Narodowy
Bank Polski, Working Paper No. 248, 2016), https://www.nbp.pl/publikacje/materialy_i_studia/248_en.pdf
[hereinafter Bierut, CEE Countries].
29 These enlargements included the countries listed in Table 4. Croatia joined the EU in 2013 but because our
estimates use 2000-2014 time series, the trade patterns of this country have not been included.
30 These products were chosen for no particular reason other than they were exportable and covered a range
a per capita GDP USD45,700 while the average for the EUnew was
USD16,700 dollars.31
Table 4: GDP and per capita GDP.32 Note: *=Adopted the euro.
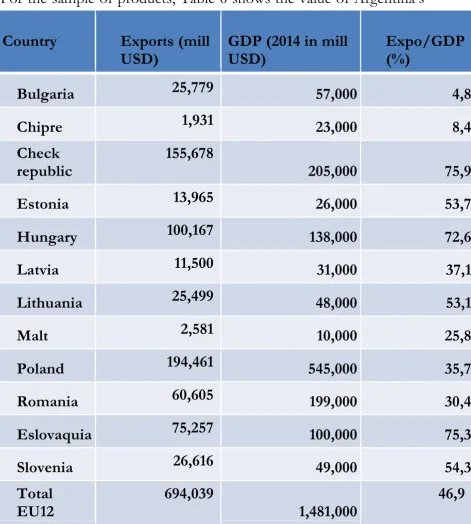
Table 5 shows that except for Bulgaria and Chipre, the rest of the new members have a relatively high export to GDP ratio. In part, this is due to the fact that shortly after the fall of the Berlin wall several of these countries adopted trade liberalization programs and despite the fact that some of such initiatives were later partly reversed, at the time of joining the EU the new members were more
open than they had been under communist rule.33
31 This is a simple average of individual countries’ per capita GDP as per World Bank database. 32 Author’s own elaboration based on UN data published in Wikipedia.
33 By the time of joining the EU, these countries had improved their productive efficiencies. Pavel Ciaian &
Johan F.M. Swinnen, Distortions to Agricultural Incentives in Central and Eastern Europe (The World Bank,
Agricultural Distortions, Working Paper No. 07, 2007),
http://siteresources.worldbank.org/INTTRADERESEARCH/Resources/544824-1163022714097/Eastern _Europe_0309rev.pdf [Ciaian & Swinnen, Distortions]. See also Beirut, CEE Countries, supra note 28.
Country
2014 GDP (billion USD)
2014 per capita GDP(USD)
Bulgaria 532 7,620
Chipre* 23 26,370
Check republic 205 18,350
Estonia* 26 19,010
Hungary 138 13,340
Latvia* 31 15,250
Lithuania* 48 15,440
Malt* 10 21,000
Poland 545 13,680
Romania 199 9,520
Slovak republic* 100 17,750
Slovenia* 49 23,580
[image:15.595.20.534.114.417.2]Table 5: 2014 exports and exports to GDP ratio.34
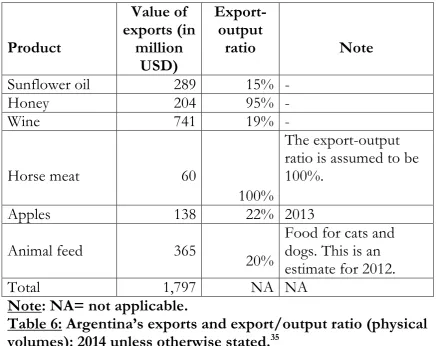
For the sample of products, Table 6 shows the value of Argentina’s
exports and the physical ratio of exports to production. The most significant product is wine with exports totalling USD741. million. In 2014 exports of the products in the sample reached USD 1,797 million and represented 2.5% of the Argentina’s aggregate exports.
34 Author’s own elaboration on the basis of data from UN data published in Wikipedia and Trademap, supra,
note 19.
Country Exports (mill
USD)
GDP (2014 in mill USD)
Expo/GDP (%)
Bulgaria 25,779 57,000 4,8
Chipre 1,931 23,000 8,4
Check republic
155,678
205,000 75,9
Estonia 13,965 26,000 53,7
Hungary 100,167 138,000 72,6
Latvia 11,500 31,000 37,1
Lithuania 25,499 48,000 53,1
Malt 2,581 10,000 25,8
Poland 194,461 545,000 35,7
Romania 60,605 199,000 30,4
Eslovaquia 75,257 100,000 75,3
Slovenia 26,616 49,000 54,3
Total EU12
694,039
1,481,000
Product
Value of exports (in
million USD)
Export-output
ratio Note
Sunflower oil 289 15% -
Honey 204 95% -
Wine 741 19% -
Horse meat 60
100%
The export-output ratio is assumed to be 100%.
Apples 138 22% 2013
Animal feed 365
20%
Food for cats and dogs. This is an estimate for 2012.
Total 1,797 NA NA
[image:17.595.78.515.69.415.2]Note: NA= not applicable.
Table 6: Argentina’s exports and export/output ratio (physical volumes): 2014 unless otherwise stated.35
2. Agricultural Protection in the EUnew and EU15
As mentioned, the lower the level of protection before accession and the higher the margin of trade preference created by moving towards the CAP levels, the more likely that trade diversion effects against Mercosur and other efficient agricultural exporters would
take place.36 Unfortunately, data on product specific level of
protection of the new members before accession was not readily available, so in order to arrive at a rough assessment, we relied on studies undertaken at a more aggregate level which quite clearly
35 Value and quantity exported from Trademap supra note 19. For the sources of physical volumes of
sunflower oil see BOLSA DE CEREALES DE CÓRDOBA, http://www.bccba.com.ar (last visited Nov. 15, 2017); for honey see PORTAL APÍCOLA, http://api-cultura.com/argentina-sigue-perdiendo-terreno-a-nivel-mundial/(last visited Nov. 15, 2017); for wine see INSTITUTO NACIONAL DE VITIVINICULTURA, http://www.inv.gov.ar/index.php (last visited Nov. 15, 2017); for horse meat author’s own estimate; for apples see MINISTERIO DE ECONOMÍA, https://www.economia.gob.ar (last visited Nov. 15, 2017); and for animal feed see Carlos Manzoni, El alimento para gatos y perros mueve millones, LA NACION, (last visited Jun. 02, 2013),http://www.lanacion.com.ar/1587425-el-alimento-para-gatos-y-perros-mueve-millones.
36 For, a discussion on the adoption of the CAP by the new members seeEnlargement, Two Years After: An
Economic Evaluation, BUREAU OF EUROPEAN POLICY ADVISERS &DIRECTORATE-GENERAL FOR ECONOMIC
AND FINANCIAL AFFAIRS, ECFIN/REP/53347, (2006),
conclude that before accession, agricultural protection of the EUnew was lower than that prevailing in the EU15.
For example, in 2000 OECD observed that: “Current levels of protection for industrial goods in some CEECs (central and eastern European countries) are considerably above EU levels, while
agricultural protection is much lower.”37 This also comes out quite
clearly in the only country specific study we have found presenting agricultural protection levels before and after joining the EU: “… a review of the detailed data shows that there are many cases when the gradual liberalization increased Slovakia’s agricultural imports from the EU15 + CEEC while at the same time Slovakia agricultural imports from the ROW decreased. Out of 193 agricultural commodities classified by the four-digit HS code, in 42 cases agricultural imports from the EU15 + CEEC increased between 2000– 2001 and 2004–2005, while imports from the ROW declined. This is an indication that imports from the EU15 + CEEC, which are positively discriminated against, replaced imports
from the ROW, an indication of trade diversion.”38
The detailed study by Anderson and Swinnen also arrives at similar conclusions: “Between 2000 and 2003, the average rate of assistance to agriculture in the CEE10 was just under 25%, slightly less than half the rate of assistance (including from programs somewhat
decoupled from production), provided to farmers in the EU15.”39
These authors also suggest that adoption of the CAP is expected to have increased the rate of assistance to a level closer to that of the EU15 farmers.
Much of the assistance to agriculture in the EU is provided by the prices paid by consumers that remain above international levels. On the Consumer Tax Equivalent (CTE), Anderson and Swinnen estimated in 2008 that “…in 2000-2003 the CTE of the new
37 The EU Policies and their Economic Effects, ORGANISATION FOR ECONOMIC CO-OPERATION AND
DEVELOPMENT (2000), http://www.oecd.org/economy/growth/1886277.pdf.
38 Dusan Drabik et al., Trade Creation and Diversionin the Enlarged EU Market: Evidence for Agricultural Trade in
Slovakia, 57 Czech J. of Eco. and Fin., 9-10 (2007).
39 Tim Josling, Distortions to Agricultural Incentives in Western Europe (The World Bank, Agricultural Distortions
Working Paper No. 61, 2009),
members was 17% …compared with nearly twice that in the
EU15.”40
Accession by the new members to the EU also ensured investment in their agricultural sectors and this coupled with access to a wide
protected market, propelled agricultural exports to Europe.41
Finally, it is also of importance to note that so far we have only referred to standard protectionist instruments such as tariffs and quotas. Nevertheless, it is pertinent to stress that some observers highlight the importance of non-tariff measures as barriers to enter the EU market. For example, a recent piece mentions that: “…Australia has already initiated preliminary discussions with the EU about an Australia-EU free trade agreement, and it seems likely that if such an agreement eventuates, there will be some downward movement in the level of agricultural tariffs imposed on agricultural imports by the EU. In the past, such changes have tended to be offset by increases in technical trade barriers (for example biosecurity and safety testing protocols) meaning that the net impact
is difficult to estimate.”42
Therefore, the global picture that emerges indicates that before accession the new members had lower levels of agricultural protection than the EU15 and this level increased on accession. Under this dynamic pattern of trade policy changes we would expect that for any given agricultural product exported by non-members to the EU three effects would take place: 1) exports to the EU27 would decelerate or decline as the twelve EUnew countries adopted the CAP protection levels; 2) given the increasing levels of investments by the EU15 countries in the agricultural sectors of the new members that expanded their productive capacities, the share of the EU15 imports from the new countries would increase,
40 Kym Anderson & Johan Swinnen, Distortions to Agricultural Incentives in Eastern Europe and Central Asia (The
World Bank, Agricultural Distortions Working Paper No. 23, 2009), http://siteresources.worldbank.org/INTTRADERESEARCH/Resources/544824-1163022714097 /Eastern _Europe_0309rev.pdf.
41 Ciaian & Swinnen, Distortions, supra note 33, at 28 (“For the CEE countries wanting to join the EU,
accession (or wider European integration) had taken priority. Moreover, they benefitted strongly from private inflows of capital, know-how and technology, for example through large foreign direct investment in their food industries in the late 1990s and 2000s”).
42 Mick Keogh, The Impact on Australian Agriculture of Britain Leaving the EU, AUSTRALIAN FARM INSTITUTE
whereas the imports from relatively efficient non-members exporters like Argentina would decline; and 3) therefore, the enlargement would result in an increase in the degree of the EU27 agricultural self sufficiency.
We have analyzed these hypotheses for six products: apples, honey, horse meat, sunflower oil, wine and animal feed. Before presenting the results, a brief comment on the current level of protection in the EU provided to these products is in order as following the enlargement the protective schedules of the new members increased towards these levels. Appendix A shows that of the six products, three are protected with ad valorem tariffs and two of them (horse meat and sunflower oil), have relatively low trade barriers. Honey is the third product and its ad valorem tariff at 17,3% is quite high.
The other three products are highly protected. First, apples are classified under ten tariff lines all of which have an ad valorem plus a specific tariff that varies according to the month of the year. Second, wine is classified under 51 tariff lines all of which are specific. Finally, animal feed is classified under 17 tariff lines and here the specific component reaches a maximum of 948 euros
which implies an ad valorem equivalent tariff close to 100%.43
3.Trade Patterns and Trade Diversion in an Enlarged EU
3.1 Argentina’s Exports to the EU27 and the World
Figure 4 shows the time paths of Argentina’s exports to the world and to the EU27 for the abovementioned products. These trends indicate that Argentina’s declining export shares to the EU are not correlated with exports to the world, which in fact has been more dynamic. The differences are sufficiently strong to suggest that these widening time paths are likely to be attributable to the EU’s agricultural protection and the dynamic export behavior of the new
members (EUnew).44
43 In 2012 the unit price of Argentina’s exports of animal feed was USD 980 per ton.
44 For, all six products and for the most recent years, the graph shows deceleration of export growth which to
Annex B presents tests for the difference between the means of several of the variables discussed in this section. Table B1 of that annex shows the tests for the difference between the means of Argentina’s aggregate exports and exports to the EU 27 for two periods: 2001-2003 (before enlargement, m1) and 2005-2014 (after enlargement, m2). The values of the t-statistic indicate that the difference between the means in Argentina’s exports to these two destinations grew after enlargement suggesting that the forces
[image:21.595.85.515.283.509.2]leading to trade diversion were likely to be working.45
Figure 4: Exports of Argentina to the world and to the EU27 (000 USD).46
3.2 Pattern of the EU15 Imports
Figure 5 presents the share of Argentina and that of the EUnew in
EU15 imports.47 Except for wine, the EU15 import pattern is
characterized by an increasing share from the EUnew and a declining share from Argentina. For four of the products (sunflower oil, horse meat, apples and honey) the shares of both origins cross during the period of analysis indicating that the new members had
45 The underlying time series data is from trademap where observations begin in 2001. Given that at the time
of processing the data some observations for 2015 were missing, we ended the statistical analysis in 2014.
46 Author’s own elaboration on the basis of Trademap supra note 19.
47 In addition to individual country trade data, trademap also presents data by several groupings including the
EU15 and EU27. EU15 imports from the new members (EUnew) are estimated as the difference between EU15 imports from EU27, and EU15 imports from EU15.
0 200000 400000 600000 800000 1000000 1200000 1400000 1600000
1 2 3 4 5 6 7 8 9 10 11 1213 14
Sunflower
A5la5 UE275 Al5mundo
0 20000 40000 60000 80000 100000 120000
1 2 3 4 5 6 7 8 9 1011121314
Horse5meat UE275 World 0 100000 200000 300000 400000 500000 600000 700000 800000 900000
1 2 3 4 5 6 7 8 9 10 11 12 13 14
Animal5feed EU27 World 0 50000 100000 150000 200000 250000
1 2 3 4 5 6 7 8 91011121314
Honey EU27 World 0 100000 200000 300000 400000 500000 600000 700000 800000 900000 1000000
1 2 3 4 5 6 7 8 910 11 12 13 14
Wine EU27 World 0 20000 40000 60000 80000 100000 120000 140000 160000 180000 200000
1 2 3 4 5 6 7 8 910 11 12 13 14
Apples
or created sufficient productive capacity so as to partly replace Argentina (and other efficient exporters) as suppliers to the EU15. The shares for wine also cross; but, this is not because the EUnew substituted Argentina, since its export share to the EU15 also
[image:22.595.95.520.71.584.2]increased.48
Figure 5: Share of Argentina and the EUnew in EU15 imports: % of aggregate imports49
Figure 6 in consonance with the previous discussion, shows that in all of these products the EU27 has become increasingly self-sufficient. As discussed above, except for wine, the increasing exports of the EUnew to the EU15 is part of the explanation. In the case of wine, this increasing self-sufficiency should be attributed to increasing exports by the EU15.
48 Table B2 in appendix B shows that most of these differences are statistically significant.
49 Author’s own elaboration on the basis of Trademap supra note 19. 0 0,05 0,1 0,15 0,2 0,25 0,3 0,35
1 2 3 4 5 6 7 8 9 10 11 12 13 14
EU15.sunflower. oil.imports
Share. of.EU12 Share. of.Argentina
0 0,05 0,1 0,15 0,2 0,25
1 2 3 4 5 6 7 8 9 10 11 12 13 14
EU15.horse.meat.imports
Share. of.EU12 Share. of.Argentina
0 0,01 0,02 0,03 0,04 0,05 0,06 0,07 0,08 0,09
1 2 3 4 5 6 7 8 9 10 11 12 13 14
EU15.imports. of.animal.feed
Share. of.EU12 Share. of.Argentina
0 0,01 0,02 0,03 0,04 0,05 0,06 0,07
1 2 3 4 5 6 7 8 9 10 11 12 13 14
EU15.apple.imports
Share. of.EU12 Share. o.Argentina
0 0,05 0,1 0,15 0,2 0,25 0,3
1 2 3 4 5 6 7 8 9 10 11 12 13 14
EU15.honey. imports
Share. of.EU12 Share. of.Argentina
0 0,002 0,004 0,006 0,008 0,01 0,012 0,014 0,016
1 2 3 4 5 6 7 8 9 10 11 12 13 14
EU15.wine.imports
Summing up, this section has shown a correlation between the enlargement of the EU (on inclusion of members from the Eastern and Central Europe during 2004 and 2007) and the loss of trade shares in this market that characterizes several of Argentina’s agro industrial products (and probably that of other efficient exporters as well). In four of the six products we find that the share of Argentina in the EU15 imports declined while the degree of the EU27’s self sufficiency increased. We also find that the time paths of Argentina’s exports to the EU was increasingly below that of its exports to the world.
Figure 6: Intra EU27 imports relative to aggregate EU27 imports.50
Finally, the increasing degree of the EUs self-sufficiency that characterizes most of the products in the sample is in contrast to the overall degree of the EU’s self sufficiency, which in fact has been
declining.51 This is another reason to suspect that the loss of
Argentina’s agricultural exports in the EU market can be traced to an increasing number of new members adopting the highly protectionist CAP. This conclusion is in contrast to several studies, which were conducted before enlargement, predicting that this
50 Author’s own elaboration on the basis of Trademap supra note 19.
51 According to numbers in trademap in 2005, intra EU27 imports as a share of aggregate EU27 imports was
64%, while in 2014 this number had declined to 57%.
0 0,1 0,2 0,3 0,4 0,5 0,6 0,7 0,8 0,9 1
1 2 3 4 5 6 7 8 9 10 11 12 13 14 15 16
EU27.self.sufficiency
Aniimal.feed Horse.meat Sunflower.oil
0 0,1 0,2 0,3 0,4 0,5 0,6 0,7 0,8 0,9
1 2 3 4 5 6 7 8 9 10 11 12 13 14 15 16
EUs.self.sufficiency
policy would have minimal effects on LAC countries.52
IV. Political Economy Issues
It is quite clear from the previous sections that Mercosur and the EU have inflicted trade diversion costs on each other. It is also the case that among the FTA options opened to the EU the one with Mercosur holds the promise of generating one of the most
significant trade creation zones in the world.53 Beyond trade, what
else can be said to be in favor of a balanced FTA between Mercosur and the EU? In what follows, we address issues related to political economy and rent seeking as well as to populism and trade institutions.
1. Political Economy and Rent Seeking
A successful outcome of the Mercosur-EU negotiations would entail moving their productive systems in a direction which will allow each partner to undertake relevant structural transformations that will put their economies in a better position to accelerate and sustain their economic growth. This entails opening economies and improving resource allocation, while at the same time, reducing the wastage from rent seeking activities.
Meaningful liberalization in Mercosur includes liberalizing trade in protected manufacturing and service sectors while for the EU it
entails liberalizing trade in agriculture.54 Not surprisingly, the
strongest opposition to this liberalization comes from the sectors that are most protected within each of these regions.
52 Nunnekamp, supra note 25; BERUMEN,EUROPEAN UNION, supra note 26.
53 In terms of GDP, among the ongoing FTA negotiations by the EU, the following are the most significant:
US, Japan, Mercosur and Australia. Given that under Trump the TTIP is unlikely to materialize, the two most significant FTA negotiations are with Japan and Mercosur. For, the significance of economic size for defining the negotiating priorities of the EU see, e.g., Patrick Messerlin, The Mercosur-EU Preferential Trading Agreement: A view from Europe (Centre for European Policy Studies, Working Document No. 377, 2013), http://aei.pitt.edu/40233/1/WD_377_Messerlin_Mercosur-EU_Trade.pdf.
54 For an analysis of the impact of an FTA agreement with the Mercosur (as well as other relatively likely
Both Mercosur and the EU, have been clinging for decades to structures of protection that have shielded major economic sectors from external competition. Arbitrary and excessively high industrial protection has been a drag for the Mercosur economies and their
consumers particularly in Argentina and Brazil55. Having both
liberalized between the late 80s and early years of this millennium, they then, under populist governments, reverted to highly protectionist industrial policies and this trend lasted until late 2015. Between 2006 and 2015, Argentina also discriminated heavily
against its primary exporting sectors at a very high cost.56
Agricultural protectionism in the EU is also a drag to these economies. Although this is not the place to discuss the costs of the CAP, consider the fact that only around 3% of the EU is engaged in agriculture and yet this sector receives by far the single most important subsidy item of the EU budget. EU consumers also pay prices of food products above international levels.
In Argentina, up to the late 2015 and adding to the losses triggered by high protectionism, was a system of trade policy administration where bureaucratic arbitrariness, instead of transparent ad valorem tariffs, had the say of the day. Bureaucrats chose sectors and enterprises to grant or deny them petitions for import and export
licenses.57 Rent seeking and corruption activities flourished under a
system divorced from international and regional trade rules. By one estimate, in 2012 the value of protectionist rents generated by arbitrary export permits, which is only a fraction of the rents generated by trade controls on imports, reached USD 1,600 million; further, over the period 2006 and 2015, while export barriers were enforced, aggregate protectionist rents were in the order of USD
9,000 million.58
55 See, for e.g., Julio J. Nogués, Barreras sobre las exportaciones agropecuarias: impactos económicos y sociales de su
eliminación, (The World Bank, Working Paper No. 3, 2015), http://documents.worldbank.org/curated/en/2016/03/26071462/barriers-agricultural-exports-economic- social-impacts-disposal-barreras-sobre-las-exportaciones-agropecuarias-impactos-económicos-y-sociales-de-su-eliminación.
56 See, for e.g., id.
57Baracat, Trade Reform, supra note 4.
58 While only the exports of a few major agricultural products were arbitrarily regulated, between 2011 and
As said, the opposition to the Mercosur-EU trade negotiations comes mainly from the most protected sectors. In the EU, a large number of countries led by France have stated their opposition to
negotiations with the Mercosur.59 Thus, rent seeking by highly
protected EU farmers have already made their way to the highest political levels. For example, the Irish opposition is grounded on “…adverse market developments arising from increased access for Mercosur beef to the EU market, given that more than 90% of Irish
beef production is exported to the EU market.”60
2. Populism and Trade Rules
It takes only a fraction of the time necessary to build systems of openness and transparency to undo them. Shortly after taking power in 2003 a new government in Argentina was walking over the rules based trade policy which it inherited from the reformist
governments of the 90s.61 In contrast, since 2015 governments in
the Mercosur countries particularly Argentina and Brazil, face the daunting challenge and lengthy hurdle of moving away from
decades old populist economic policies.62
Populism is also threatening the EU. In terms of economic magnitude, Figure 7 shows that Brexit is of higher significance than the numerous countries from central and eastern Europe that joined
the EU in recent years.63 The growing number of citizens that in
surrounding these regulations. For import permits, see, e.g., Cronista Comercial, La afip denuncio fraudes con las djai por usd14.000 millones: hubo giro de divisas al exterior sin que hubiera ingreso de mercaderías, EL CRONISTA, Aug. 17, 2016, http://www.cronista.com/economiapolitica/La-AFIP-denuncio-fraudes-con-las-DJAI-por-us-14.000-millones-20160817-0070.html. For, export permits, see, e.g., Matías Longoni, GRANOS: 25% De los permisos de exportación va a firmas dudosas, CLARIN, May 31, 2015, http://www.clarin.com/ieco/granos-permisos-exportacion-firmas-dudosas _0_SJZb5ut Dme. amp.html
59 See Christian Oliver & Tobias Buck, France Leads Revolt Against Mercosur Trade Talks, F.T., May 5, 2016,
https://www.ft.com/content/d7ac18ec-12a9-11e6-839f-2922947098f0.
60 See Irish beef farmers strongly reject accord with Mercosur, MERCO PRESS, Apr. 8, 2016,
http://en.mercopress.com/2016/04/08/irish-beef-farmers-strongly-reject-accord-with-mercosur-protest-letter-to-trade-commissioner-malmstrom.
61 Baracat, Trade Reform,supra note 4. Another example is Mr. Trump’s decision to abandon the TPP.
62 In the short run and on matters of trade, for Argentina this means among others: i) complying with adverse
rulings under the WTO dispute mechanism; ii) returning Mercosur to the basic rules upon which it was created and, iii) reorganizing the administration of trade policy including unfair trade measures, in line with WTO rules. Progress has been achieved in all three fronts.
63 Although the goals sought by the UK in the Brexit negotiations with the EU lead us to identify it as a
Europe are apparently embracing populist proposals have also
increased the likelihood that other countries could eventually leave.64
Even if this does not occur, Europe will be faced with increasing protectionist demands. Moreover, Mr. Trump has also not been
kind to NAFTA and the WTO65. Essentially, in only a matter of few
months the events that have evolved are threatening the trading system that has, painstakingly, taken decades to construct.
Figure 7: Relative Economic Importance of the EUs
successive enlargements and contraction (Brexit): percent of EU27 GDP.66
Confronting these threats succesfully will require unique political skills. By the recent experience of Mercosur in the serious difficulties implied by attempting to leave behind its populist culture, leaders should consider knitting together defensive agreements and implementing reforms that could help to sustain growth while at the same time ensuring that those workers who will bear the costs of adjustment will be adequately compensated.
years time the UK will become a liberalized country as it has been leading continental Europe in this direction.
64 In such a world Mercosur will no longer face the trade diversion costs created by an expansionary EU but
it will face an increasingly arbitrary protectionism that is likely to be even more damaging.
65 Hufbauer, Trump, supra note 5. 66 UN data published in Wikipedia.
0 2 4 6 8 10 12 14 16 18
Greece 1981 Spain and Portugal 1985
Austria, Finland and Sweden 1995
EU10 2004 Bulgaria and Romania 2007
[image:27.595.85.453.215.435.2]Clearly Europe’s traditional structures that have consolidated under protection should also give way to reform. The CAP is one of such niches of high protection that requires change so as to ensure that domestic consumer prices move closer to international levels thereby increasing the likelihood of consumers voting in favour of an open rules-based trading system.
A balanced and ambitious Mercosur-EU FTA could go a long way in facilitating this process as well as strengthening that segment of Mercosur and Europe’s leadership that still hold the basic foundations of the post World War II trading system in high esteem.
V. Conclusion
This paper argues that during the last decades, the creation of Mercosur and the successive enlargements of the EU have inflicted extensive trade diversion costs against each other. Therefore, the forces that have impeded reaching an agreement on a Mercosur-EU FTA during this long period of time have been quite costly to both regions.
This failure has two main origins: first, the EU’s agricultural protectionism, which has strengthened interest groups in their effort to create a barrier and prevent the EU from coming up with a reasonable trade offer; and, second, starting the new millenium and until 2015, the arbitrary protectionism practised by Argentina and Brazil, which was well divorced from the spirit of oppeness and support for the multilateral trading system that characterized the 90s.
to be blamed for the social conditions. Once in control, populism seeks to remain in power by implementing any policy option that is perceived to increase its voting force. Populism drives in the massess who view their charismatic leader as the solution to their conditions. The southern cone countries are clear examples of the negative effects of populism.
Presently, the political systems of Europe are also being threatened by populist ideas that are challenging with increasing force, the political power of politicians who embrace the idea of an open and competitive Europe. This brings closer to home the specter of forces seeking to modify for the worst, the rules-based system that flourished after WWII something that would naturally result in a contraction of world trade.
Annexures
Annex A: Current protection granted by the EU to the sample products67
HS classifi
cation Product
No. tariff lines
Average ad valorem
tariff
Non AV
tariff Maximum Note
80810 Apples 10 None 10
11,2%+Euro 23,8/100 kg
All lines have mixed tariffs
40900 Honey 1 17.3% 0 0 ----
20500
Horse
meat 3 5.1% 0 0 Only AV tariffs
151211
Sunflowe
r oil 3 6.4% 0 0 Only AV tariffs
220421 Wine 51 None 51
206ECU/To n
All are non AV tariffs
230990
Animal
feed 17 7.4% 12
Euro948/To n
All non AV tariffs are specific
AnnexB: Testing for the difference between means of variables during 2001-2003 (before enlargement) and 2004-20014 (after enlargement).
This annex presents the t values for the difference between means
of the variables discussed in section III.68 We seek to highlight
differences between the periods 2001/2003 before new members (EUnew) entered the EU, and 2005/2014 after the enlargement of EU.
67 WTO, https://www.wto.org/english/tratop_e/schedules_e/goods_ schedules_table _e. htm.
68 For the null hypothesis, the t statistic used is as follows: