Previously we reported changes in whole-body CO2stores, estimated from transients in CO2elimination, with temperature changes (∆CO2WB/∆T ) in three species of reptiles and one amphibian species (Stinner and Wardle, 1988; Stinner et al. 1994a; Stinner, 1982). The ∆CO2WB/∆T coefficient varied from −0.18 mmol kg−1°C−1 in the black racer snake Coluber constrictor to −0.05 mmol kg−1°C−1 in the cane toad Bufo marinus. The absolute value of the plasma ∆pH/∆T coefficient also differs among these species and is low in C. constrictor compared with B. marinus (−0.003 units °C−1 versus −0.015 units °C−1between 30 and 10 °C, respectively; Stinner et al. 1996; Boutilier et al. 1987). This inverse relationship between the ∆CO2WB/∆T and ∆pHpl/∆T coefficients suggests an explanation for the thermal dependence of CO2 stores. When temperature is changed, the change in [CO2] is related to the nonbicarbonate buffer value (βNB), the change in the
ionization constant of the nonbicarbonate buffers (∆pK) and ∆pH by the expression ∆[HCO3−]=βNB(∆pK−∆pH) (Heisler and Neuman, 1980; Heisler, 1986a). Thus, if βNBand ∆pK/∆T are similar among species, ∆[HCO3−] (and hence the change in total [CO2]) will be greatest in species exhibiting the smallest change in pH. For example, the ∆pK/∆T coefficient for 4-methyl-imidazole is −0.023 units °C−1 (Figge et al. 1991a) and so, when body temperature changes, the absolute value of ∆pKim−∆pH is much greater in C. constrictor than in B. marinus (0.019 versus 0.007 units °C−1). Consequently, there would be considerably more nonbicarbonate buffering of CO2, with concomitant changes in net imidazole charge, in C. constrictor than in B. marinus.
This study tests the hypothesis that the increase in whole-body CO2 stores with cooling results from titration of proteins by carbonic acid. We estimated ∆[CO2]WB/∆T JEB1145
Whole-body CO2 stores are known to increase with
cooling in reptiles and amphibians (−∆[CO2]/∆T ). The
aim of this study was to determine the mechanism(s) producing this inverse relationship. The ∆[CO2]/∆T
coefficients were determined for eight reptilian and one amphibian species and were found to differ by a factor of approximately 10, from −0.21 mmol kg−1°C−1 in the Mediterranean spur-thighed tortoise Testudo graeca to
−0.02 mmol kg−1°C−1 in the bullfrog Rana catesbeiana. The ∆[CO2]/∆T coefficients were correlated with values in
the literature for in vivo plasma ∆pH/∆T coefficients
(∆[CO2]/∆T=−0.18–8.24∆pH/∆T; r2=0.87). Plasma
electrolyte concentrations (Na+, K+, Ca2+, Mg2+, Cl−,
inorganic phosphate, SO42−and lactate), [protein], [CO2], PCO2 and pH were measured in chronically cannulated resting black racer snakes Coluber constrictor. When the temperature was reduced from 30 to 10 °C, pH increased slightly (by −0.0028 pH units °C−1), PCO2 decreased by 7 mmHg, [CO2] increased by 3.2 mmol l−1 and
[HPO42−+H2PO4−] increased by 0.7 mmol l−1.
Concentrations of protein and of the remaining electrolytes were not significantly different (P>0.05) at 30 and 10 °C. Net plasma protein charge, calculated from the
principle of electroneutrality (the sum of the cations in mequiv = the sum of anions in mequiv), was
−0.48 mequiv g−1protein at 30 °C and
−0.38 mequiv g−1protein at 10 °C. This 21 % decrease was attributed to the increases in [CO2] (i.e. carbonic acid) and
inorganic phosphate concentration. Between 30 and 10 °C, skeletal muscle pH and [CO2] in C. constrictor increased
(by −0.009 units °C−1 and −0.125 mmol kg−1°C−1, respectively), [Na+] and [Cl−] each decreased by
approximately 12 mequiv l−1, and [K+] and the percentage
of water did not change significantly. It is concluded that the increase in whole-body CO2 stores with cooling in
reptiles and amphibians results from the passive effects of temperature changes upon the ionization constants of proteins and the active adjustment of PCO2 (ventilatory regulation), so that −∆pK is greater than −∆pH. Active transmembrane ion-exchange processes do not appear to be involved.
Key words: Coluber constrictor, reptiles, amphibians, temperature, respiratory exchange ratio, oxygen consumption, carbon dioxide production, acid–base balance, pH, protein charge, tissue carbon dioxide content, electrolytes, skeletal muscle.
Summary
Introduction
A PROTEIN TITRATION HYPOTHESIS FOR THE TEMPERATURE-DEPENDENCE
OF TISSUE CO
2CONTENT IN REPTILES AND AMPHIBIANS
J. N. STINNER*, L. K. HARTZLER, M. R. GRGURIC ANDD. L. NEWLON Department of Biology, The University of Akron, Akron, OH 44325-3908, USA
*e-mail: JStinner@UAkron.Edu
coefficients in eight additional species of reptiles and one additional amphibian species from measurements of the respiratory exchange ratio (rate of CO2elimination/rate of O2 uptake), and compared ∆[CO2]WB/∆T coefficients with values from the literature for ∆pHpl/∆T coefficients. In addition, we estimated net plasma protein charge in C. constrictor at 30 and 10 °C from the principle of electroneutrality. Strong ions (Na+, K+, Ca2+, Mg2+, Cl−, SO42−, lactate), inorganic phosphate, protein concentration, total [CO2], PCO∑and pH were measured in plasma at the two temperatures in resting chronically cannulated black racer snakes under steady-state conditions. The interspecific ∆CO2WB/∆T coefficients were found to be strongly correlated with the interspecific ∆pHpl/∆T coefficients, and net plasma protein charge in C. constrictor fell by 21 %. Furthermore, between 30 and 10 °C, [CO2] of skeletal muscle in C. constrictor increased, without corresponding changes in intracellular [Na+], [K+] or [Cl−]. The findings of this study support the hypothesis that the thermal dependence of whole-body CO2stores in reptiles and amphibians results from the titration of protein by CO2.
Materials and methods
Animals
Animals were purchased from commercial suppliers, except for painted turtles (Chrysemys picta) and snapping turtles (Chelydra serpentina) which were collected locally. They were housed in the animal facility at The University of Akron, where room temperature was maintained at 25–30 °C. The cages contained light bulbs set to a 12 h:12 h L:D cycle that provided basking sites at 35–40 °C. Approximately once weekly, the snakes, American alligators (Alligator mississippiensis), savannah monitors (Varanus exanthematicus), snapping turtles and bullfrogs (Rana catesbeiana) were fed on mice and rats. The desert iguanas (Dipsosaurus dorsalis), painted turtles and Mediterranean spur-thighed tortoises (Testudo graeca) were fed on canned dog food, fruit and vegetables several times each week. All animals used in this study appeared to be in excellent health. The animals were starved for 1 week prior to experimentation in order to avoid metabolic, acid–base and electrolyte changes associated with the digestion and absorption of food.
Metabolism studies
Net changes in whole-body CO2stores caused by changes in body temperature were assessed indirectly from measurements of the respiratory exchange ratio (RE). Rates of O2 consumption (V
.
O∑) and CO2 production (V .
CO∑) in undisturbed animals were determined in a sealed recirculating apparatus housed inside a darkened temperature-controlled cabinet (Precision Scientific, model 815, ±1 °C). The details of this apparatus and the procedure followed have been described previously (Stinner et al. 1994a). Briefly, animals were allowed to adjust to the experimental apparatus for 24 h. The chamber was then sealed, and air was recirculated at
2.1–2.5 l min−1. A portion of the recirculated air was continuously passed through a Drierite column and O2 and CO2analyzers (Ametek S-3A and CD-3A; Ametek, Pittsburgh, PA, USA). The analyzers were calibrated with dry, CO2-free room air and a 5 % CO2(balance N2) certified gas mixture. The metabolism chamber was flushed with room air when the O2 levels had fallen to no lower than 19 % and/or the CO2levels had risen to a maximum of 1.0 %, V.O∑and V
.
CO∑were calculated using the equations for closed-system respirometry given by Stinner et al. (1994a). Net changes in whole-body CO2stores caused by changing the temperature were estimated from the differences between nonsteady-state and steady-state (control) RE values (see Stinner, 1982, for details of the integration procedure). The animals remained inside the metabolism apparatus for up to 3 weeks. They appeared to be in excellent condition at the end of these studies. The temperatures used and masses of each species are listed in Table 1.
Surgery and blood analyses
The dorsal aorta of 49 C. constrictor (mean mass 217±87 g) was occlusively cannulated (PE 50 or PE 10) as described by Stinner et al. (1996). After a recovery period of at least 72 h, the snakes were placed inside individual chambers within a darkened Precision temperature-controlled cabinet. The trailing ends of the cannulas extended outside the cabinets so that blood could be sampled without disturbing the snakes. Additional details of this apparatus and the blood sampling procedure (see below) are given in Stinner et al. (1996). The snakes were left undisturbed for 24 h at 30 °C and 20 °C and for 48 h at 10 °C before blood sampling began to allow them to achieve steady state with respect to whole-body CO2stores.
For PCO∑, pH and [CO2] measurements, a train of four heparinized microhematocrit tubes was connected to a cannula and filled with a total volume of approximately 300µl of blood. The capillary tube train was then immediately sealed and immersed in iced water. All blood sample analyses of PCO∑, pH and [CO2] were completed within 1 h of collection. PCO∑ and pH were measured on blood from two and one of the microcapillary tubes, respectively, using Radiometer BMS-3 electrodes thermostatted to the snake’s body temperature and PHM 72 acid–base analyzers (Radiometer, Copenhagen, Denmark). The PCO∑ electrode was calibrated using a 1.39 % CO2mixture supplied by mass-flow controllers (Tylan Corp., Torrance, CA, USA). The pH electrode was calibrated using Radiometer precision buffers. Plasma [CO2] was determined in duplicate on the fourth microcapillary tube using a Capni-con 3a CO2analyzer (Cameron Instrument Co., Port Aransas, TX, USA). pK1′ was calculated for each blood sample using the solubility coefficients given by Severinghaus (1965) (see Table 3). Snakes at 10 °C were sampled once each day for four consecutive days and snakes at 30 °C were sampled once each day for 2 days. Replicate values for each snake were then averaged before calculating group means ± S.D.
whole blood was collected directly into heparinized microcapillary tubes and immediately centrifuged at 2000 g for 5 min in an Eppendorf microcentrifuge. For lactate analysis, 100µl of the plasma was immediately deproteinized by adding 200µl of a cold 8 % perchloric acid solution. The mixture was centrifuged at 15 000 g for 10 min, and the supernatant was then frozen for no more than 1 week before plasma [lactate] analysis using an enzymatic test kit (Sigma no. 726-uv/826-uv) and Coleman Jr II model 6/20 spectrophotometer. The remaining plasma was frozen for future determination of ion concentrations.
Plasma [Na+] and [K+] were analyzed in duplicate using flame photometry (Coleman model 51; Bacharach, Inc., Pittsburgh, PA, USA). Plasma [Cl−] was measured (six replicates) using a Digital chloridometer (Buchler Instr., Lenexa, KS, USA). Total plasma osmolality was determined in duplicate using a model 5500 vapor pressure osmometer (Wescor, Inc, Logan, UT, USA). Means of the replicates were used to calculate group means ± S.D. for tabulation. Total plasma Ca2+, Mg2+, inorganic phosphate and protein concentrations were determined using Sigma diagnostic test kits (procedure nos 587, 595, 360-uv and 690, respectively; Sigma Diagnostics, St Louis, MO, USA). Calibration curves were constructed for [protein] from Sigma protein standards provided with the diagnostic kit, for [Ca2+] and [phosphate] from Sigma standards no. 360-11, and for [Mg2+] from Sigma standards no. 595-11. [SO42−] was determined using high-pressure liquid chromatography (Dionex HPLC 2010i; Dionex Corp., Sunnyvale, CA, USA).
Skeletal muscle
Skeletal muscle [CO2] was measured using the technique described by Stinner et al. (1994a). Twelve black racer snakes (mean mass 158±93 g) and 42 bullfrogs (mean mass 353±84 g) were individually housed inside Precision temperature cabinets at 30 or 10 °C, as described above. The bullfrogs had access to water (10–15 cm deep) as well as dry areas. After at least 48 h at 30 °C and 96 h at 10 °C, animals were gently taken by hand from the temperature cabinets and decapitated. The spinal cord of the bullfrogs was immediately pithed, and their deep body temperature was taken using a Schultheis quick-reading cloacal thermometer. Duplicate pieces of skeletal muscle weighing 0.2–0.3 g were swiftly harvested and added to 0.7 ml of 0.1 mol l−1 NaOH for soaking overnight in sealed bottles. [CO2] of the solution was measured for each bottle in duplicate using a Capni-con 3a CO2 analyzer. The four [CO2] measurements for each muscle were then averaged before calculation of group means ±S.D.
[image:3.609.50.567.99.349.2]Analysis of intracellular pH (pHi) in 19 black racer snakes (mean mass 170±88 g) was performed on muscle homogenates after metabolic inhibition according to the method of Pörtner et al. (1990). The snakes were housed inside Precision temperature cabinets for at least 48 h at 30 °C and 96 h at 10 °C. The cabinets were then briefly opened, and gauze soaked in isoflurane was dropped into the chambers. The chambers were then sealed for 15–20 min. The anesthetized snakes were removed and immediately decapitated. Four muscle samples (a combination of the transversospinalis, longissimus dorsi and iliolumbaris) were quickly taken from the mid-region of each Table 1. Oxygen consumption rates of animals kept at constant temperature for at least 24 h (temperature >30 °C) or for at
least 48 h (temperature <15 °C)
Body mass Rate of oxygen consumption (ml kg−1h−1)
Species (g) 40 °C 35 °C 30 °C 15 °C 10 °C 5 °C
Savannah monitor (4) 654±100 75.9±3.7 8.4±2.0
Varanus exanthematicus
Mediterranean spur-thighed tortoise (5) 642±138 32.1±1.7 4.0±2.6
Testudo graeca
Coachwhip snake (4) 488±86 54.1±11.3 5.2±0.9
Masticophis flagellum
American alligator (4) 180±55 65.5±2.1 7.7±2.1
Alligator mississippiensis
Painted turtle (4) 509±88 66.9±6.4 5.2±1.5
Chrysemys picta
Snapping turtle (7) 2,460±1,682 38.7±9.5 3.6±0.8
Chelydra serpentina
Western diamondback rattlesnake (5) 1,256±1,103 48.1±18.2 6.0±2.7
Crotalus atrox
Desert iguana (5) 47.2±11.8 142.5±18.2 8.6±1.6
Dipsosaurus dorsalis
Bullfrog (6) 608±65 72.9±6.4 3.7±0.8
Rana catesbeiana
snake, freeze-clamped and stored in liquid N2 for up to 2 h. Additional muscle samples were taken for electrolyte and water content determinations (see below). Frozen muscle samples were rapidly transferred to a porcelain mortar half-filled with liquid N2inside an ice chest and ground to a fine powder using a pre-cooled pestle. Grinding typically took 1 min. Approximately 150 mg of the powder was rapidly strained under the liquid N2 atmosphere of the mortar and transferred to a 500µl Eppendorf microcentrifuge tube containing 200µl of ice-cold inhibitor solution (150 mmol l−1 potassium fluoride, 5 mmol l−1 nitrilotriacetic acid; pH approximately 7.00). The transferred powder was quickly covered with the inhibitor solution and mixed with a needle in order to release the N2bubbles from the thawed tissue powder. The microcentrifuge tube was then filled with the inhibitor solution and capped. The mixture was agitated for 3 s using a vortex mixer, centrifuged for 20 s at maximal speed in an Eppendorf centrifuge, and stored in ice for no more than 1 h. The supernatant pH was repeatedly measured using a Radiometer BMS-3 pH electrode thermostatted to the snake’s body temperature and a PHM 72 acid–base analyzer. At least three pH measurements from each centrifuge tube were averaged, and the pH of the four muscle samples from each snake was averaged before calculation of group means ±S.D. In two snakes held at 10 °C and three snakes held at 30 °C, additional samples of the muscle powder were prepared and analyzed as described above, except that pH was measured at 30 °C and at 10 °C, respectively. The difference in supernatant pH between the 10 and 30 °C samples taken from the same ground muscle powder was used to determine the passive component of the temperature-dependent adjustment of pHi.
Muscle samples weighing approximately 0.25 g were analyzed for [Na+], [K+] and [Cl−] according to the method of Boutilier et al. (1986). Four samples from each of 25 C. constrictor (mean mass 167±80 g) were placed in tared vials containing 4 ml of 0.1 mol l−1 HNO3, weighed, and gently shaken for 24 h at room temperature. Dissolved [Na+], [K+] and [Cl−] were determined as described above for plasma. Four additional muscle samples from 21 of the snakes were weighed and dried overnight to a constant mass at 60 °C.
Statistics
Comparisons between values were performed using paired t-tests, Student’s t-tests and least-squares regression. Significance was assumed when P<0.05. Means ± S.D. are reported for group values.
Results
Metabolism and whole-body CO2stores
Metabolic rates (V.O∑) for the nine species studied are listed in Table 1. These rates are for animals kept for at least 24 h at the specified body temperatures. They do not necessarily represent minimal resting values because the animals were occasionally active inside the metabolic chambers, especially at 30–40 °C. This probably accounts for the high thermal quotients (Q10>3) evident in Table 1 (e.g. Q10for C. picta of 3.6).
[image:4.609.76.522.464.701.2]Cooling and heating the animals produced transient decreases and increases, respectively, in the respiratory exchange ratio. In eight of the nine species studied, steady-state RE values were not significantly affected by temperature
Fig. 1. Effect of lowering the temperature from 30 to 10 °C upon the respiratory exchange ratio in Testudo graeca (N=5) and Alligator
mississippiensis (N=4). The length of the horizontal bars corresponds to the duration of individual measurement periods. The arrow at 50 h
marks the time at which ambient temperature was lowered from 30 to 10 °C. The change in air temperature took 1.5–2 h to complete.
Respiratory exchange ratio
Alligator mississippiensis
0.4 0.5 0.6 0.7 0.8 1.0 0.9
10 20 30 40 50 60 70 80 90 100 110 120 130 140
0 B
Time (h) Time (h) A
Testudo graeca
0.2 0.3 0.4 0.5 0.7 0.6 0.8 1.0 0.9
20 40 60 80 100 120 140 160 180 200 220 240 260 280 300 320 340 360 380 400
(P>0.05). However, in T. graeca, mean steady-state RE at 30 °C (0.78±0.08) was significantly higher than mean RE measured after 150 h at 10 °C (0.61±0.06), suggesting that the animals still had not returned to steady state. Estimates of changes in whole-body CO2stores in T. graeca at 10 °C were made using the 30 °C steady-state RE values. As expected, there were large differences among species, as illustrated by comparing T. graeca with A. mississippiensis (Figs 1, 2). Cooling T. graeca from 30 to 10 °C reduced the RE to approximately 0.3–0.5, which was then followed by a gradual increase in RE (Fig. 1A). Heating the tortoises back to 30 °C resulted in a sharp increase in RE to well above 1.0, and even above 2.0 in one tortoise, and then a return to steady state by approximately 12 h (Fig. 2A). The effect of temperature changes upon the RE was smaller in A. mississippiensis. Lowering body temperature from 30 to 10 °C lowered the RE
to approximately 0.6–0.7, and steady state returned within approximately 20 h (Fig. 1B). Raising the temperature back to 30 °C increased the mean RE to a little above 1.0, and RE then returned to steady state within 5 h (Fig. 2B).
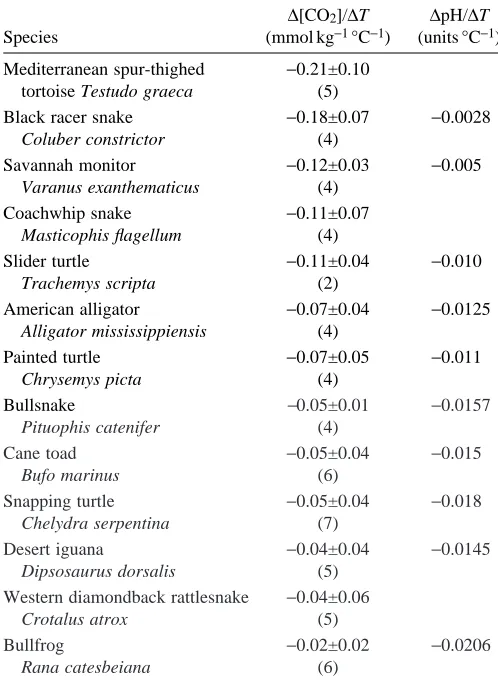
Calculated changes in whole-body CO2stores are listed in Table 2, and range from −0.21±0.10 mmol kg−1°C−1 in T. graeca to −0.02±0.02 mmol kg−1°C−1 in R. catesbeiana. In addition to the nine species measured in this study, Table 2 contains ∆CO2/∆T coefficients for four species taken from earlier reports and ∆pHpl/∆T coefficients available for 10 of the species. There is a significant correlation (r2=0.87, P<0.01) between ∆CO2WB/∆T and ∆pHpl/∆T (Fig. 3). Least-squares linear regression yields ∆CO2/∆T=−0.18−8.24∆pHpl/∆T, where
[image:5.609.55.298.290.681.2]∆CO2/∆T is in mmol kg−1°C−1and ∆pH/∆T is in pH units °C−1. The equation predicts that a ∆pHpl/∆T=−0.022 units °C−1 will result in no changes in whole-body CO2stores with changes in temperature (x-intercept of the line) and that a ∆pHpl/∆T=0.0 units °C−1will result in a whole-body change in CO2stores of −0.18 mmol kg−1°C−1(y-intercept of the line).
Fig. 2. Effect of raising the temperature from 10 back to 30 °C upon the respiratory exchange ratio in five Testudo graeca and four
Alligator mississippiensis. Symbols as in Fig. 1. Air temperature was
raised at the conclusion of the measurements at 10 °C (see Fig. 1) and took 1.5–2 h to reach 30 °C.
Alligator mississippiensis
Time (h)
Respiratory exchange ratio
0.6 0.7 0.8 1.1 1.2 1.3
1.0
0.9
5 10 15
0
Testudo graeca
Time (h)
10 20 30 40
0 0.6 0.8 1.2 2.2 2.0
1.8 1.6
1.4
1.0
A
[image:5.609.315.564.345.689.2]B
Table 2. Changes in whole-body CO2stores and plasma pH with changes in body temperature
∆[CO2]/∆T ∆pH/∆T
Species (mmol kg−1°C−1) (units °C−1)
Mediterranean spur-thighed −0.21±0.10 tortoise Testudo graeca (5)
Black racer snake −0.18±0.07 −0.0028
Coluber constrictor (4)
Savannah monitor −0.12±0.03 −0.005
Varanus exanthematicus (4) Coachwhip snake −0.11±0.07
Masticophis flagellum (4)
Slider turtle −0.11±0.04 −0.010
Trachemys scripta (2)
American alligator −0.07±0.04 −0.0125
Alligator mississippiensis (4)
Painted turtle −0.07±0.05 −0.011
Chrysemys picta (4)
Bullsnake −0.05±0.01 −0.0157
Pituophis catenifer (4)
Cane toad −0.05±0.04 −0.015
Bufo marinus (6)
Snapping turtle −0.05±0.04 −0.018
Chelydra serpentina (7)
Desert iguana −0.04±0.04 −0.0145
Dipsosaurus dorsalis (5) Western diamondback rattlesnake −0.04±0.06
Crotalus atrox (5)
Bullfrog −0.02±0.02 −0.0206
Rana catesbeiana (6) ∆[CO2]/∆T values are reported as means ±S.D.
Numbers in parentheses are the number of animals sampled.
∆pH/∆T values were taken from Jackson (1986) and Table 3 for
Plasma CO2, pH and electrolytes
Although mean plasma pH in C. constrictor was higher by 0.056 units at 10 versus 30 °C (Table 3), the difference was not significant (P<0.1). PCO∑ was 7.1 mmHg lower, and total plasma [CO2] was 3.2 mmol l−1higher, at 10 versus 30 °C. The values for PCO∑ and pH at 30 °C listed in Table 3 also include measurements for five snakes from previous work in this laboratory (Stinner and Wardle, 1988). Plasma [HCO3−] and dissolved [CO2] were estimated from mean total [CO2] and mean PCO∑ using the solubility coefficients listed in Table 3. Between 30 and 10 °C, [HCO3−] increased by 3.1 mmol l−1and dissolved [CO2] remained virtually unchanged. pK1′ was slightly but significantly higher (0.111 units) at 10 °C.
Inspection of Table 4 reveals that plasma electrolyte concentrations were largely unaffected by cooling the snakes from 30 to 10 °C. Only [phosphate] changed significantly, increasing by 0.7 mmol l−1. However, at 20 °C, the concentrations of several electrolytes (Na+, K+, Mg2+ and phosphate) were significantly different from those at 10 and/or 30 °C. The higher [Na+] at 20 °C appeared to have been accompanied by a higher [Cl−]. There was no effect of temperature upon [protein]. Protein charge (in mequiv 1−1) was calculated as (the sum of the concentrations of Na+, K+, 2×Ca2+ and 2×Mg2+) minus (the sum of the concentrations of Cl−, lactate, 2×SO42−, 2×HPO42−and H2PO4−). The concentrations of HPO42− and H2PO4− were estimated using the Henderson–Hasselbalch equation, mean pH values from
Table 3 and a pK of 6.791 at 37 °C (Siggaard-Anderson, 1974). The van’t Hoff equation [pK=(∆H°/4.576)(1/T2−1/T1)] was used to correct pK to 30 and 10 °C, where ∆H°=982 cal mol−1 (Edsall and Wyman, 1958). Protein charge decreased from −0.48 mequiv g−1protein at 30 °C to −0.38 mequiv g−1protein at 10 °C (Fig. 4), largely because of the increases in total [CO2] (carbonic acid) and inorganic [phosphate].
Skeletal muscle
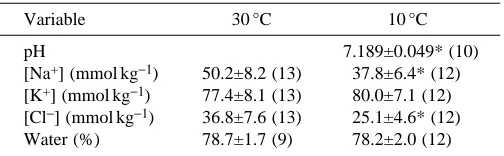
Between 30 and 10 °C, [CO2] increased significantly by approximately 2.5 mmol kg−1in the three muscles studied in C. constrictor (Table 5). This contrasts sharply with the pattern found in R. catesbeiana (Table 6): in 14 skeletal muscles, only one exhibited a significant increase in [CO2] with cooling. Intracellular muscle pH in C. constrictor increased significantly with cooling (∆pHi/∆T=−0.009 units °C−1; Table 7). The passive component was ∆pHi/∆T=−0.013± 0.001 units °C−1. Muscle [Na+] and [Cl−] each decreased significantly by approximately 12 mequiv l−1, but there were no significant differences in [K+] or in percentage water content in snakes at 30 and 10 °C (Table 7).
Discussion
The temperature-dependence of whole-body CO2 stores is
−0.05
−0.005 −0.010 −0.015 −0.020 −0.025
0 −0.10 −0.15 −0.20
0
∆pH/∆T (units °C−1)
∆
[CO
2
]/
∆
T
(mmol kg
−1°
C
[image:6.609.48.286.73.348.2]−1)
Fig. 3. Thermal dependence of whole-body CO2stores versus thermal
dependence of plasma pH in 10 species of reptiles and amphibians. Values are taken from Table 2. The line represents the least-squares regression (y=−0.18−8.24x, r2=0.87, P<0.01).
Table 3. Steady-state values for systemic arterial plasma pH, carbon dioxide and oxygen in the snake Coluber constrictor
at 30 and 10 °C
Variable 30 °C 10 °C
pH 7.531±0.042 7.587±0.079
(10) (8)
PCO2(mmHg) 21.5±2.5* 14.4±2.1
(10) (8)
Total [CO2] (mmol 1−1) 22.1±2.8* 25.3±2.0
(26) (17)
αCO2(mmol 1−1mmHg−1) 0.0356 0.0629
pK1′ 6.069±0.016* 6.180±0.023
(5) (6)
[HCO3−] (mmol 1−1) 21.3 24.4
Dissolved [CO2] (mmol 1−1) 0.8 0.9
PO2(mmHg) 75 17
αO2(mmol 1−1mmHg−1) 1.4×10⁻³ 1.99×10⁻³
Dissolved [O2] (mmol 1−1) 0.10 0.03
pH, PCO2, total [CO2] and pK1′, are reported as means ± S.D.; numbers in parentheses are the number of animals used; *indicates values significantly different (P<0.05) from those at 10 °C.
Dissolved [CO2] and [HCO3−] were calculated from the mean
values of total [CO2] and PCO2.
The solubility coefficients (α) for CO2and O2were taken from
Severinghaus (1965) and Christoforides et al. (1969), respectively.
PO2values were predicted from an equation in Stinner and Wardle
(1988).
[image:6.609.308.560.108.302.2]strongly correlated with changes in plasma pH per unit change in temperature in reptiles and amphibians (Table 2; Fig. 3): species exhibiting relatively small absolute ∆pH/∆T coefficients experience greater changes in whole-body CO2 stores. An explanation for this relationship is that, with differences between ∆pK and ∆pH, there is titration of nonbicarbonate buffers by CO2 (see Introduction). Assuming that the ∆pHpl/∆T coefficients correspond to whole-body ∆pH/∆T coefficients, as reported by Bickler (1982) and by Cameron and Kormanik (1982), the absolute value of the slope in Fig. 3 (8.24 mmol kg−1pH unit−1) then represents a whole-body nonbicarbonate buffer value and
Table 4. Steady-state levels of systemic arterial plasma electrolytes in the snake Coluber constrictor
Variable 30 °C 20 °C 10 °C
[Na+] (mmol 1−1) 154.5±3.5† 158.2±5.4* 153.9±5.9
(18) (13) (20)
[K+] (mmol 1−1) 3.7±0.6† 3.1±0.3* 3.9±0.5
(13) (13) (13)
[Ca2+] (mmol 1−1) 2.9±0.4 2.7±0.3 2.8±0.3
(26) (13) (13)
[Mg2+] (mmol 1−1) 1.2±0.2† 1.5±0.3* 1.2±0.35
(11) (13) (13)
[Cl−] (mmol 1−1) 114.3±4.0 118.3±4.7 114.7±4.5
[image:7.609.48.300.95.356.2] [image:7.609.317.564.474.676.2] [image:7.609.49.298.476.549.2](9) (9) (9)
[Phosphate] (mmol 1−1) 1.2±0.3*,† 1.6±0.4* 1.9±0.4
(13) (13) (13)
[Protein] (g 1−1) 47.7±10.9 45.5±11.1 44.8±9.0
(29) (13) (17)
[SO42−] (mmol 1−1) 2.3±0.6 2.8±1.2 2.6±0.6
(6) (8) (7)
[Lactate] (mmol 1−1) 1.0±0.5 0.8±0.2
(13) (6)
Osmolality (mmol kg−1) 307±22
(14)
Values are means ±S.D., numbers in parentheses are the number of animals sampled.
Comparisons of values were performed using paired tests or t-tests for two means, and significance was assumed when P<0.05; * indicates values that are significantly different from those at 10 °C; † indicates values that are significantly different from those at 20 °C.
Fig. 4. Plasma electrolyte concentrations (in mequiv l−1) in the snake Coluber constrictor kept at 30 °C for 24 h or more and at 10 °C for
48 h or more. Values were calculated from the concentrations (in mmol l−1) listed in Tables 3 and 4. Note that the increase in [HCO3−]
between 30 and 10 °C was accompanied by a reduction in net negative protein charge, indicating titration of plasma proteins by carbonic acid. See text for additional explanation. L, lactate; P, protein.
20 40 60 80 100 120 140 160 180
0
(3.6) (2.2)
Electrolyte concentration (mequiv l
−
1)
30°C
166.4 mequiv l−1 165.8 mequiv l10°C −1
Na+ (154.5)
Cl− (114.3)
Na+ (153.9)
Cl− (114.7)
Mg2+ (2.4)
K+ (3.7) Ca2+ (5.8)
SO42− (4.6)
P (23.0) HCO3−
(21.3) HCO3
−
(24.4)
P (17.1) Ca2+ (5.6)
K+ (3.9) SO 42− (5.2) L(1.0) L(0.8) H2PO4− ,
HPO42−
H2PO4− , HPO42−
Mg2+ (2.4)
Table 5. Steady-state skeletal muscle CO2levels in black racer snakes Coluber constrictor
[CO2] (mmol kg−1)
Muscle 30 °C 10 °C
Transversospinalis 11.2±1.5 13.9±1.4* Longissimus dorsi 10.5±1.3 13.7±1.9* Iliolumbaris 10.3±2.1 11.9±0.9*
Values are reported as means ±S.D.
Six snakes were sampled at each temperature.
*Indicates a value significantly different from that at 30 °C.
Table 6. Steady-state skeletal muscle CO2level as a function of body temperature in bullfrogs Rana catesbeiana
[CO2] (mmol l−1)
Muscle 28.1±0.6 °C 9.5±1.5 °C
Submaxillary 15.4±1.2 16.3±1.5 Rectus abdominis 12.8±1.2* 14.9±1.5 Oblique (external plus 13.2±2.0 14.3±1.1
internal)
Coccygeo-iliacus 10.1±1.0 10.2±1.3 Longissimus dorsi 11.1±1.0 10.7±1.2 Iliolumbaris 12.8±1.6 12.7±1.7 Anconeus 12.5±1.4 13.0±1.2 Extensor carpi ulnaris 13.1±1.9 13.7±1.5 Pectoralis 12.1±1.8 11.9±1.3 Triceps femoris 13.8±3.7 13.0±2.6 Semimembranosus 13.1±3.5 13.2±2.6 Gracilis major 13.2±3.7 13.3±2.6 Sartorius 13.5±3.9 14.6±2.9 Gastrocnemius 13.3±3.6 13.1±2.9
Values are reported as means ±S.D.; each muscle was sampled from
seven animals at each temperature and no more than five muscles were sampled from each animal.
the x-intercept (−0.022 units °C−1) represents the change in the mean whole-body ionization constant. Hence, ∆CO2WB/∆T=8.24(−0.022−∆pHpl/∆T), which fits the general expression ∆[HCO3−]=βNB(∆pK−∆pH), but with the addition of dissolved CO2(the effect of which is minor; see Table 3). While this explanation is speculative, it is interesting to note that the mean temperature coefficient for biological imidazole-like buffers is ∆pK/∆T≈−0.02l units °C−1(Edsall and Wyman, 1958), which is very close to the −0.022 units °C−1 obtained in the present study. This implies that the postulated nonbicarbonate buffering is dominated by proteins (as opposed to phosphates, where ∆pK/∆T=−0.0025 units °C−1; Edsall and Wyman, 1958).
Increases in whole-body CO2stores with cooling in reptiles and amphibians obviously represents CO2(and hence carbonic acid) retention. However, within a given tissue compartment (e.g. extracellular fluid), a rise in [HCO3−] may not be accompanied by increases in [H+] because the protons can be removed by ion-exchange mechanisms (e.g. by the kidney, stomach and skeletal muscle cells). If this were to occur, then there must be adjustments in the levels of other ions in order to preserve electroneutrality with the rise in [HCO3−]. The data contained in Tables 3 and 4 and Fig. 4 for plasma in C. constrictor clearly show that ion-exchange mechanisms were not involved. There were no changes in strong ion levels (Na+, K+, Mg2+, Cl−, Ca2+ SO
42− and lactate) or protein concentration, and phosphate concentration (a weak acid) actually increased with cooling. Thus, the 3 mmol l−1increase in [HCO3−] was accompanied by an equivalent increase in [H+]pl that was buffered by the plasma proteins. The rise in phosphate concentration also titrated the plasma proteins. Consequently, net protein charge fell by 21 %, from −0.48 mequiv g−1protein at 30 °C to −0.38 mequiv g−1protein at 10 °C. Plasma protein charge at 37 °C and pH 7.4 in humans is −0.6 mequiv g−1protein (Figge et al. 1991b). Plasma strong ion levels have been shown to be independent of temperature in other air-breathing ectotherm species (Bickler, 1984; Herbert and Jackson, 1985; Douse and Mitchell, 1991).
The data in Table 3 also show that the change in [CO2]pl
cannot be explained by simple increases in the solubility coefficients (αO∑, αCO∑) with cooling. Depending upon the in vivo steady-state PO∑ and PCO∑, the increase in αO∑ and αCO∑ could potentially result in an accumulation of dissolved O2and dissolved CO2. This would have the effect of adding to the pulmonary O2 uptake and reducing the pulmonary CO2 elimination with cooling. Hence, the depression in RE and elevation in CO2stores could be interpreted on the basis of the solubilities of the respiratory gases. However, inspection of Table 3 reveals that between 30 and 10 °C there was no change in dissolved [CO2]pland dissolved [O2]pldecreased, because of the reductions in PO∑ and PCO∑.
In previous reports, increases in extracellular CO2stores at lower temperatures were attributed to ion-exchange mechanisms generating HCO3− (which is equivalent to removal of H+) (Stinner and Wardle, 1988; Stinner et al. 1994a, 1996). This view now appears to be incorrect. The suggestion of ion exchange was based upon the lengthy time courses for accumulation of CO2 in C. constrictor (35 h to reach steady state when cooled from 30 to 10 °C, and 60 h to reach steady state when cooled from 30 to 5 °C) and the relatively large changes in [CO2]pl which could not be accounted for by estimated extracellular fluid nonbicarbonate buffering (Stinner et al. 1996). However, the estimates of [HCO3−] generated from extracellular fluid nonbicarbonate buffers did not include ∆pK/∆T, and it was assumed that interstitial fluid is free of proteins. This assumption is not consistent with the high protein concentrations reported for interstitial fluid and lymph in ectotherms (30–100 % of plasma protein concentration; Hargens et al. 1974; Hillman et al. 1987). In mammals, the interstitial colloid osmotic pressure in loose connective tissue is approximately 50 % of the plasma colloid osmotic pressure (Aukland and Reed, 1993). Thus, the estimated extracellular fluid βNB was too low. Extracellular
βNBfor C. constrictor can be obtained from the [HCO3−]pland pHpl values listed in Table 3 and an assumed ∆pK/∆T of −0.022 units °C−1, where βNB=∆[HCO3−]/(∆pK−∆pH). The resulting calculation yields an extracellular fluid βNB of 8.1 mmol l−1pH unit−1, which is close to the value of 6.2 mmol l−1pH unit−1 measured in the toad B. marinus (Boutilier et al. 1979). Hence, we conclude that nonbicarbonate buffering and ∆pKpr/∆T account for the rise in [HCO3−] with cooling in C. constrictor.
[image:8.609.42.294.108.186.2]A similar pattern for CO2was found in skeletal muscle tissue of C. constrictor cooled from 30 to 10 °C. [CO2] increased by approximately 2.5 mmol kg−1, which is close to that measured in plasma. Skeletal muscle [Na+] and [Cl−] each decreased significantly by approximately 12 mequiv l−1, but the small increase in [K+] was not significant (P>0.4; Table 7). These changes in whole-muscle electrolyte levels suggest that there was a decrease in the fraction of extracellular fluid volume relative to intracellular fluid volume with cooling, as reported for B. marinus (Stinner et al. 1994a). Extracellular fluid, relative to intracellular fluid, is high in Na+and Cl−but low in K+. Hence, a decrease in the fraction of extracellular fluid will produce a decrease in whole-muscle [Na+] and [Cl−], and an Table 7. Steady-state values for skeletal muscle pH,
electrolyte levels and water content in the black racer snake Coluber constrictor
Variable 30 °C 10 °C
pH 7.189±0.049* (10)
[Na+] (mmol kg−1) 50.2±8.2 (13) 37.8±6.4* (12)
[K+] (mmol kg−1) 77.4±8.1 (13) 80.0±7.1 (12)
[Cl−] (mmol kg−1) 36.8±7.6 (13) 25.1±4.6* (12)
Water (%) 78.7±1.7 (9) 78.2±2.0 (12)
Values are means ±S.D.; numbers in parentheses are the number of animals sampled.
Each muscle sample was a combination of the transversospinalis, longissimus dorsi and iliolumbaris.
increase in whole-muscle [K+]. We conclude that the increase in [CO2] within the muscle resulted from an increase in [H2CO3] rather than from active ion exchange across the sarcolemma. The absolute value of the skeletal muscle ∆pHi/∆T coefficient was greater than the ∆pHpl/∆T coefficient (0.009 versus 0.003 units °C−1, respectively). In terms of our protein titration hypothesis, the higher absolute ∆pH/∆T coefficient in skeletal muscle resulted from its higher βNB(e.g. 19.8 mmol kg−1fresh mass pH unit−1 in B. marinus skeletal muscle; Pörtner, 1990) compared with βNB for extracellular fluid (approximately 8 mmol kg−1pH unit−1in C. constrictor). This higher buffering capacity is, however, partly offset by a lower absolute ∆pK/∆T coefficient. In C. constrictor, the passive ∆pH/∆T coefficient (and hence ∆pK/∆T) is −0.013 pH units °C−1compared with a plasma passive ∆pH/∆T coefficient of approximately −0.019 pH units °C−1 (Reeves, 1976). The result in skeletal muscle, relative to extracellular fluid, is that when cooled the passive component elevates pHi less but then the superimposed CO2retention lowers pHi very little so that the net ∆pHi/∆T coefficient is greater than the ∆pHpl/∆T coefficient.
In the discussion above, Fig. 3 was viewed as a whole-body nonbicarbonate buffer curve. Support for this conclusion in C. constrictor comes from the nearly identical value for the change in plasma [CO2] per unit change in plasma pH (−8.3 mmol l−1pH−1; Table 3) and the ∆[CO2]WB/∆pHpl coefficient in Fig. 3 (−8.24 mmol l−1pH unit−1). The ∆[CO2]pl/∆T in C. constrictor was not associated with ion exchange, but was instead apparently the result of the change in pK of the protein buffers (physicochemical buffering) and the change in PCO∑(ventilatory regulation). The same was also apparently true for the intracellular fluid of skeletal muscle. When cooled, reptiles and amphibians increase their air convection requirement and thus lower blood PCO∑ (Ultsch and Jackson, 1996). CO2is lipid-soluble, it readily diffuses across cell membranes, and intracellular fluid PCO∑ decreases in a parallel fashion. The ∆[CO2]/∆T coefficients of skeletal muscle in C. constrictor and in R. catesbeiana parallel the ∆[CO2]/∆T coefficients of plasma ([CO2]plis independent of temperature in R. catesbeiana; Reeves, 1972). Also, changes in extracellular pH appear to correspond to changes in whole-body pH (Bickler, 1982; Cameron and Kormanik, 1982). Consequently, it is reasonable that the ∆[CO]2WB/∆pHpl coefficient of Fig. 3 is similar in magnitude to the ∆[CO2]pl/∆pHpl coefficient measured in C. constrictor (Table 3). Alternatively, the close agreement between the slope of Fig. 3 and βNB estimated from Table 3 may simply be coincidental.
The absence of changes in strong ion levels refers to steady-state conditions, i.e. after the change in whole-body CO2stores has been completed. Presumably, the ∆pK occurs virtually instantaneously with the ∆T so that, during the nonsteady-state period, there are transient adjustments in plasma and intracellular fluid strong ion levels, such as the rise in plasma lactate concentration observed in C. constrictor during cooling (Stinner et al. 1996). However, when comparing steady-state
conditions, the ∆pK/∆T accounts for CO2retention in plasma and cells, despite hyperventilation and a lowering of PCO∑ with cooling. According to this hypothesis, individual differences in the ∆[CO2]/∆T coefficients among tissues, as found in B. marinus (Stinner et al. 1994a), result from differences in βNB and/or differences in (∆pK−∆pH).
In summary, on the basis of the findings of this study, titration of proteins with cooling occurs because the rising air convection requirement does not lower PCO∑ sufficiently to maintain a constant (∆pK−∆pH)/∆T, i.e −∆pK is greater than −∆pH. C. constrictor at 10 °C compared with 30 °C maintains a lower PCO∑ by hyperventilating, but [CO2] is higher (Tables 3, 5) because of the thermally induced upward shift in pK. This protein titration hypothesis does not support general theories of acid–base regulation in ectotherms that are based upon preserving the same net protein charge irrespective of body temperature (i.e. constant relative alkalinity, alphastat and z-stat; Austin et al. 1927; Howell et al. 1970; Reeves, 1972; Cameron, 1989). In the present study, only bullfrogs appear to conform closely to the alphastat model, which predicts constant tissue CO2content. What effect, if any, CO2 retention and changes in protein charge have upon enzyme activities and the physiology of these animals is unknown (Heisler, 1986b). There is a growing body of evidence that CO2 retention (acidification) and low PO∑ (see Table 3) are potent metabolic inhibitors in ectotherms (Boutilier et al. 1997; Guppy et al. 1994). Furthermore, mammalian hibernators exhibit a transient reduction in RE when entering torpor and a transient elevation in RE during arousal (Nestler, 1990). C. constrictor is native to all 48 contiguous North American states and extends into southern Canada and northern Mexico. Black racer snakes have a wide temperature range and are even somewhat active in hibernacula below 5 °C (Stinner, 1987; Sexton and Hunt, 1980). By contrast, bullfrogs (R. catesbeiana) show minimal changes in whole-body CO2 stores, but they also occupy a wide range in North America and are active at near-freezing temperatures in ice-covered ponds during winter (Stinner et al. 1994b). The possible relationship between CO2 retention, protein charge and behavior is an important topic that deserves careful study in the future.
The authors wish to thank Dr H. O. Pörtner for providing encouragement and valuable technical advice on the measurement of intracellular pH.
References
AUKLAND, K. AND REED, R. K. (1993). Interstitial–lymphatic
mechanisms in the control of extracellular fluid volume. Physiol.
Rev. 73, 1–73.
AUSTIN, J. H., SUNDERMAN, F. W. ANDCAMACK, J. G. (1927). Studies in serum electrolytes. II. The electrolyte composition and the pH of serum of a poikilothermous animal at different temperatures. J.
biol. Chem. 72, 677–685.
in relation to changing body temperatures. J. appl. Physiol. 53, 1466–1472.
BICKLER, P. E. (1984). Effects of temperature on acid and base excretion in a lizard, Dipsosaurus dorsalis. J. comp. Physiol B 154, 97–104.
BOUTILIER, R. G., DONOHOE, P. H., TATTERSALL, G. J. ANDWEST, T.
G. (1997). Hypometabolic homeostasis in overwintering aquatic amphibians. J. exp. Biol. 200, 387–400.
BOUTILIER, R. G., EMILIO, M. G. ANDSHELTON, G. (1986). The effects of mechanical work on electrolyte and water distribution in amphibian skeletal muscle. J. exp. Biol. 120, 333–350.
BOUTILIER, R. G., GLASS, M. L. ANDHEISLER, N. (1987). Blood gases
and extracellular/intracellular acid–base status as a function of temperature in the anuran amphibians Xenopus laevis and Bufo
marinus. J. exp. Biol. 130, 13–25.
BOUTILIER, R. G., RANDALL, D. J., SHELTON, G. ANDTOEWS, D. P.
(1979). Acid–base relationships in the blood of the toad, Bufo
marinus. J. exp. Biol. 82, 331–344.
CAMERON, J. N. (1989). Acid–base homeostasis: past and present perspectives. Physiol. Zool. 62, 845–865.
CAMERON, J. N. AND KORMANIK, G. A. (1982). Intracelluar and extracellular acid–base status as a function of temperature in the freshwater channel catfish, Ictalurus punctatus. J. exp. Biol. 99, 127–142.
CHRISTOFORIDES, C., LAASBERG, L. H. ANDHEDLEY-WHITE, J. (1969). Effect of temperature on solubility of O2in human plasma. J. appl. Physiol. 26, 56–60.
DOUSE, M. A. AND MITCHELL, G. S. (1991). Time course of
temperature effects on arterial acid–base status in Alligator
mississippiensis. Respir. Physiol. 83, 87–102.
EDSALL, J. T. ANDWYMAN, J. (1958). Biophysical Chemistry, vol. 1. New York: Academic Press.
FIGGE, J., MYDOSH, T. ANDFENCL, V. (1991a). Serum proteins and acid–base equilibria: a follow-up. J. Lab. clin. Med. 117, 713–719. FIGGE, J., ROSSING, T. H. ANDFENCL, V. (1991b). The role of serum proteins in acid–base equilibria. J. Lab. clin. Med. 117, 453–467. GUPPY, M., FUERY, C. J. ANDFLANIGAN, J. E. (1994). Biochemical
principles of metabolic depression. Comp. Biochem. Physiol. 109B, 175–189.
HARGENS, A. R., MILLARD, R. W. AND JOHANSEN, K. (1974). High
capillary permeability in fishes. Comp. Biochem. Physiol. 48A, 675–680.
HEISLER, N. (1986a). Buffering and transmembrane ion transfer processes. In Acid–Base Regulation in Animals (ed. N. Heisler), pp. 3–47. Amsterdam: Elsevier Biomedical Press.
HEISLER, N. (1986b). Comparative aspects of acid–base regulation. In Acid–Base Regulation in Animals (ed. N. Heisler), pp. 397–450.
Amsterdam: Elsevier Biomedical Press.
HEISLER, N. ANDNEUMANN, P. (1980). The role of physico-chemical buffering and of bicarbonate transfer processes in intracellular pH regulation in response to changes of temperature in the larger spotted dogfish (Scyliorhinus stellaris). J. exp. Biol. 85, 99–110. HERBERT, C. V. ANDJACKSON, D. C. (1985). Temperature effects on
the responses to prolonged submergence in the turtle Chysemys
picta bellii. I. Blood acid–base and ionic changes during and
following anoxic submergence. Physiol. Zool. 58, 655–669.
HILLMAN, S. S., ZYGMUNT, A. AND BAUSTIAN, M. (1987). Transcapillary fluid forces during dehydration in two amphibians.
Physiol. Zool. 60, 339–345.
HOWELL, B. J., BAUMGARDNER, F. W., BONDI, K. AND RAHN, H.
(1970). Acid–base balance in cold blooded vertebrates as a function of body temperature. Am. J. Physiol. 218, 600–606.
JACKSON, D. C. (1986). Acid–base regulation of reptiles. In Acid–Base
Regulation in Animals (ed. N. Heisler), pp. 235–263. Amsterdam:
Elsevier Biomedical Press.
NESTLER, J. R. (1990). Relationships between respiratory quotient and
metabolic rate during entry to and arousal from daily torpor in deer mice (Peromyscus maniculatus). Physiol. Zool. 63, 504–515. PÖRTNER, H. O. (1990). Determination of intracellular buffer values
after metabolic inhibition by fluoride and nitrilotriacetic acid.
Respir. Physiol. 81, 275–288.
PÖRTNER, H. O., BOUTILIER, R. G., TANG, Y. ANDTOEWS, D. P. (1990).
Determination of intracellular pH and after metabolic inhibition by fluoride and nitrilotriacetic acid. Respir. Physiol. 81, 255–274. REEVES, R. B. (1972). An imidazole alphastat hypothesis for
vertebrate acid–base regulation: tissue carbon dioxide content and body temperature in bullfrogs. Respir. Physiol. 14, 219–236. REEVES, R. B. (1976). Temperature-induced changes in blood
acid–base status: pH and PCO∑in a binary buffer. J. appl. Physiol.
40, 752–761.
SEVERINGHAUS, J. W. (1965). Blood gas concentrations. In Handbook
of Physiology, Respiration, vol. II (ed. W. O. Fenn and H. Rahn),
pp. 1475–1487. Washington: American Physiological Society. SEXTON, O. J. ANDHUNT, S. R. (1980). Temperature relationships and
movements of snakes (Elaphe obsoleta, Coluber constrictor) in a cave hibernaculum. Herpetologica 36, 20–26.
SIGGAARD-ANDERSON, O. (1974). The Acid-Base Status of the Blood, 4th edn. Copenhagen: Munksgaard.
STINNER, J. N. (1982). Ventilation, gas exchange and blood gases in the snake, Pituophis melanoleucus. Respir. Physiol. 47, 279–298. STINNER, J. N. (1987). Cardiovascular and metabolic responses to temperature in Coluber constrictor. Am. J. Physiol. 253, R222–R227.
STINNER, J. N., GRGURIC, M. R. ANDBEATY, S. L. (1996). Ventilatory
and blood acid–base adjustments to a decrease in body temperature from 30 to 10 °C in black racer snakes Coluber constrictor. J. exp.
Biol. 199, 815–823.
STINNER, J. N., NEWLON, D. L. ANDHEISLER, N. (1994a). Extracellular
and intracellular CO2 concentration as a function of body
temperature in the toad Bufo marinus. J. exp. Biol. 195, 345–360. STINNER, J. N. ANDWARDLE, R. L. (1988). Effect of temperature upon carbon dioxide stores in the snake Coluber constrictor and the turtle
Chrysemys scripta. J. exp. Biol. 137, 529–548.
STINNER, J. N., ZARLINGA, N. ANDORCUTT, S. (1994b). Overwintering
behavior of adult bullfrogs, Rana catesbeiana, in Northeastern Ohio. Ohio J. Sci. 94, 8–13.
ULTSCH, G. R. AND JACKSON, D. C. (1996). pH and temperature in ectothermic vertebrates. Bull. Alabama Mus. nat. Hist. 18, 1–41. VAN DIJK, P. L. M., HARDEWIG, I. AND PÖRTNER, H. O. (1997).
Temperature-dependent shift of pHi in fish white muscle: