ESTIMATION, IMAGERY OR COMPUTATION: LOW
RESOLUTION ELECTROMAGNETIC TOMOGRAPHY
(LORETA) MEASURES BRAIN ACTIVITY DURING
PERFORMANCE OF BALANCE SCALE TASKS.
Nina Wetering
s0182311
MASTER’S THESIS PSCYHOLOGY
FACULTY OF BEHAVIOURAL SCIENCES
EXAMINATION COMMITTEE Dr. T.H. van Leeuwen
Prof. dr. W.R. van Joolingen
Estimation, imagery or computation: Low Resolution
Electromagnetic Tomography (LORETA) measures brain activity
during performance of balance scale tasks.
ABSTRACT
The balance scale task is an often studied topic. Whereas these studies are mainly focused on
the solving strategies deduced from behavior, present study examined whether solving
strategies, like estimation, imagery and computation, can be inferred from activity in brain
areas estimated by Low Resolution Electromagnetic Tomography (LORETA). Using
electroencephalography (EEG), brain activation was measured in thirteen physics students
and fourteen psychology students during predicting the movement of the balance scale of 120
simple balance scale tasks and 120 conflict balance scale tasks. The results show a difference
between physics students and psychology students in number of correct predictions in both
simple and conflict balance scale tasks. Physics students had a longer reaction time than
psychology students in conflict balance scale tasks. In performing simple balance scale tasks
physics students and psychology students both had a greater activity in the left angular gyrus
and the left inferior frontal cortex, that seem to be responsible for computation than in brain
areas, that are assumed to be responsible for estimation and mental imagery. In addition,
there was no difference between physics and psychology students in activity in brain areas
involved in imagery. In conflict balance scale tasks, physics students had greater bilateral
activation in the inferior and superior parietal lobe, including the intraparietal sulcus and the
extrastriate middle occipital gyrus and fusiform gyrus, that seem to be responsible for
estimation.
INTRODUCTION
This study constitutes exploring solving strategies during performance of balance scale
tasks, depending on education. These strategies could be inferred by means of brain activity in
brain areas which are implicated in estimation, mental imagery and computation. This study
focuses on two questions that emerge from past research on the balance scale task. It is a
well-known fact that there are several strategies to solve balance scale tasks, however could the use
whether there is a difference between physics students and psychology students in problem
solving in behavior and brain.
The Balance Scale Task
The balance scale task was originally introduced by Inhelder and Piaget (1958), but
recognized in the early 1980s as a way of eliciting different rule governed response patterns
for proportionality reasoning (Siegler, 1981). A balance task is a problem that shows balance
scales that challenges the solver to decide whether the balance scale will tip to the left, to the
right or that it keeps its balance. It is commonly called a mathematical task that shows the
level of this problem.
Siegler (1976) distinguished six types of balance scale items. The six types are divided
into three simple types and three so-called conflict-types. The simple item types are: (a)
Balance items, with equal numbers of weights at each side on equal distances from the
fulcrum; (b) Weight items, with unequal numbers of weights on each side on equal distances
from the fulcrum and (c) Distance items, with an equal number of weights at each side, but on
different distances from the fulcrum. The conflict-types have more weight on one side, but
more distance on the other side: (d) Conflict Weight items, where the balance scale goes
down to the side with the larger number of weights; (e) Conflict Distance items, where the
balance scale goes downs to the side where the distance to the fulcrum is greater and (f)
Conflict Balance items, where the effects of the two dimensions compensate: the scale
remains in balance.
The behavior of children and adults on this balance scale task has been studied by many
experimenters (Marini & Case, 1994; Roth, 1991; Siegler & Chen, 1998; Surber & Gzesh,
1984)and they were especially curious about the rules they developed. Siegler & Chen (1998)
distinguish four rules and these develop as children grow older. Four-and five-year olds base
their predictions on the weight on the left and right side of the fulcrum (Rule I). Eight- and
nine-year-olds base their predictions on the distance from the fulcrum if the weight on the left
and right side is equal. When the weight is not equal, they use rule I and rely on weight (Rule
II). Twelve- and thirteen-year old children always consider both distance and weight, but they
do not know how to approach conflicts where the weight on one side is at a greater distance
from the fulcrum and the other side had more weight (Rule III). These children rarely
multiply the distance from the fulcrum by its weight on each side to solve this task (Rule IV).
Experts vs. Novices
As can be seen in the examples mentioned above, problems and tasks can be solved in
different ways, but it could depend, for example, on the prior knowledge required to solve
them, the nature of the goal involved and their complexity (Robertson, 2001). This also
applies to balance scale tasks.
Balance scale tasks can be approached in different ways. The method may depend on
domain knowledge that one has and the expertise in this domain. Robertson (2001) argues that
the difference in approach of certain problems between experts and novices can be linked to
the fact that experts have more domain knowledge. The more knowledge a person has about a
domain, the more that person is equipped to deal with complex problems in that domain. Chi,
Glaser and Farr (1988) suggest that experts spend a great deal of time analyzing a problem
qualitatively, because they may have developed reasoning or problem-solving strategies and
heuristics to help them deal with difficult problems in their domain of knowledge (Robertson,
2001). It is reasonable to expect that novices have less domain knowledge of balance scale
tasks and will not be able to solve difficult problems in that domain, because they do not have
such developed strategies. Physics students are trained to use laws of physics and should be
able to solve balance scale tasks using a formula. Psychology students probably do not have
this knowledge and for these reason it is plausible that there is a difference between
psychology and physics students with respect to domain knowledge of balance scale tasks.
In this study estimation, mental imagery and computation will be described as possible
solving strategies of balance scales tasks. Those approaches will be explained and the brain
areas which seem to be involved will be discussed.
Estimation
Siegler and Booth (2005) suggest that estimation is a process of translating between
alternative quantitative representations, of which at least one is inexact. This means that
estimation can be seen as calculated approximation of a result which is usable even if the
input data may be incomplete or uncertain. Approximation usually occurs when an exact
numerical number or form is unknown or difficult to obtain. When a formula to solve the
balance scale task is not within reach for the person who is trying to solve the task, this might
be a reason to use estimation at balance scale tasks.
The brain areas that are involved in estimation cover multiple parts of the brain. Dehaene
et al. (1999) found that bilateral parietal regions around the intraparietal sulcus (IPS) were
arithmetic relies on quantity representations located in bilaterally visuo-spatial regions of the
parietal cortex. This is consistent with the results of the study of Kucian et al. (2008), who
found significant bilateral activation in the inferior and superior parietal lobe (Brodmann Area
(BA) 40; BA7), including the IPS during approximate calculation. Also Feigenson et al.
(2004) claim that the system for representing approximate numerical magnitudes is associated
with the bilateral horizontal segment of the IPS (BA40; BA7). Finally, significant visual
activation was found bilaterally in the extrastriate middle occipital gyrus and fusiform gyrus
(BA19) (Kucian et al., 2008).
The approximate approach is not accurate, because it is estimating within certain limits.
Mental imaging approach is also inaccurate for the reason that it is not verifiable and therefore
subjective.
Mental Imagery
Mental imagery can be described as processing visual information even when it is not
present (Anderson, 2005). Schwartz and Heiser (2006) define imagery as the process of
working with mental spatial representations. People construct and transform these
representations in their mind‟s eye, which resembles perceptual experience, but occurs in the
absence of the appropriate stimuli for the relevant perception (Finke, 1989). Generating a
useful mental representation is an important single factor for successful problem solving.
Shaver et al. (1975) claim that imagery plays a functional role in problem solving, because it
reduces the load on memory. For these reasons mental imagery might be implicated in solving
balance scale tasks.
Kosslyn (1994) claims that mechanisms used in visual perception also play a key role in
mental imagery. Brain-imaging studies by Kosslyn et al. (1993, 1999) seemed to indicate a
very high degree of similarity between visual perception and mental imagery. They measured
activity in the primary visual cortex (BA17; BA18) while subjects performed mental imagery
or analogous perceptual tasks. Slotnick et al. (2005) investigated activation in the brain during
visual mental imagery and they found topographically organized activity in striate (BA17)
and extrastriate cortex (BA18; BA19). This is also confirmed by the results of the study of
O‟Craven & Kanwisher (2000). They tested whether BA18 and BA19 activated during mental
imagery depending on the content of the image and their findings strengthen evidence that
Computation
The disadvantage of mental imagery is that no precise predictions can be made when
problems become complex and when calculations are necessary. To make a prediction of the
movement of the balance scale, a formula is needed, namely M = F x r, where M = Moment
(Nm), F = Force (N) and r = Distance (m). Using formulas to obtain an answer is part of
computational mathematics.
Computing, emphasizing algorithms, numerical methods, deductive reasoning and
symbolic methods play a central and essential role in computational mathematics. Deductive
reasoning assumes that the basic law from which people are arguing is applicable in all cases.
A basic law can be a mathematical or physical law. Goel et al. (1997) carried out a
neuroimaging PET-study where subjects performed deductive and inductive reasoning tasks.
They claim that deduction reasoning results in activation of the left inferior frontal gyrus
(BA45; BA47).
In addition to that, Ansari (2008) suggests that there is a strong link between the left
angular gyrus (BA39) and arithmetic problem solving and calculation procedures. He claims
that lesions in the left angular gyrus (BA39) often been found in association with deficits in
calculation, such as acalculia, left-right disorientation and writing or reading difficulties. This
is confirmed by Dehaene et al. (1999) who suggest that left-hemispheric brain damage might
cause a selective impairment of arithmetic and a preserved sense of quantity, including
proximity and larger-smaller relations between numbers. In their study to approximation and
exact calculation they found that the left inferior frontal cortex (BA44; BA45; BA47) and the
left angular gyrus (BA39) showed a great activation in exact calculation. This study confirms
the findings of both Goel et al. (1997) and Ansari (2008).
Electroencephalography and Low Resolution Electromagnetic Tomography
In this study brain activity will be measured by electroencephalography (EEG) and these
measurements will provide input for low resolution electromagnetic tomography (LORETA).
EEG is the recorded electrical activity from the scalp produced by the firing of neurons within
the brain. Pascual-Marqui et al. (1999) claim that EEG data offer the advantage of high time
resolution which enables the analysis of electrocortical activity with millisecond resolution.
The disadvantage of EEG is that it does not contain sufficient information on the
three-dimensional distribution of electric neuronal activity (Pascual-Marqui et al., 2002). According
to Pascual-Marqui et al. (2002) EEG activity as measured at the scalp can be explained by
explanation corresponds to reality. For that reason low resolution brain electromagnetic
tomography (LORETA) was developed (Pascual-Marqui et al., 1994; Pascual-Marqui, 1999).
LORETA is a functional imaging method based on the electrophysiological and
neuroanatomical constraints of existing instruments to measure brain activity and is capable
of correct localization of cortical sources. This latter feature is essential for this study.
Research Questions
It is interesting to find out if there is a difference between experts and novices in solving
simple and conflict balance scale tasks. In this study physics students can be considered as
experts, because they know the physical formula and can apply it. Psychology students can be
considered as novices, because they probably have no knowledge of physics laws. Important
in this study is that solving strategies may be inferred from activity in brain areas. Therefore
the key question of this study is, whether solving strategies of balance scale tasks can be
inferred from activity in brain areas estimated by LORETA on the basis of scalp recorded
EEG. To answer this question, behavior and brain activity in previously mentioned brain areas
will be measured during the experiment.
The first and second research questions concerns the behavior. The first research question
is: “Is there a significant difference between physics students and psychology students in
number of correct predictions and reaction time with respect to the simple balance scale
tasks?” The second research question is: “Is there a significant difference between physics
students and psychology students in number of correct predictions and reaction time with
respect to the conflict balance scale tasks?”
The third, fourth and fifth research questions concern the EEG-measures. The third
research question is: “Will physics students and psychology students both solve simple
balance scale tasks by imagery?” If so, then brain areas assumed to be responsible for mental
imagery (BA17; BA18; BA19) will have a significantly greater activity than brain areas
responsible for estimation (BA7; BA19; BA40) and computation (BA39; BA44; BA45;
BA47). In addition, there will be no significantly difference between physics students and
psychology students in activity in brain areas responsible for mental imagery.
The fourth research question is: “Will psychology students solve conflict balance scale
tasks by estimation?” If so, then there will be measured significantly more bilateral activation
in the inferior and superior parietal lobe, including the IPS (BA7 and BA40) and the
extrastriate middle occipital gyrus and fusiform gyrus (BA19) in psychology students than
scale tasks by computation?” If so, then there will be measured significantly more brain
activity in physics students in the left inferior frontal gyrus and cortex (BA44; BA45; BA47)
and the left angular gyrus (BA39) than psychology students.
METHODS
Subjects
The subjects in this study were thirteen university physics students and fourteen university
psychology students of the University of Twente. The physics students, with a mean age of
19,77 years (range 18 – 22 years), consisted of one female and twelve male participants. The
psychology students, with a mean age of 21,21 years (range 18 – 27 years), consisted of eight
female and six male participants. The psychology students did not do exams in physics at
secondary school. Each participant provided a written informed consent. The study was
approved by the University of Twente Ethics Committee.
Stimuli
The stimuli consisted of 240 balance-images and were made by SimQuest (Inquiry
Learning 6.3, University of Twente, The Netherlands). Two types of problems were created
for this study, namely the simple type and the conflict type. These types are inferred from the
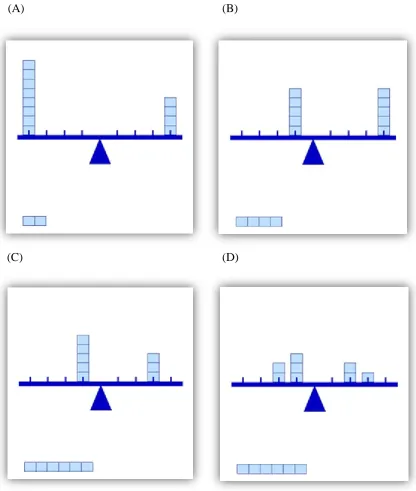
six balance scale types presented by Siegler (1976). Simple balance scale tasks in this study
consisted of:
1. A balance with unequal numbers of bricks at each side, equidistant from the fulcrum.
2. A balance with equal numbers of bricks at each side, but on different distances from
the fulcrum.
Those two types have in common that they share a fixed variable. Type 1 consistently
maintains the same distance at each side from the fulcrum and type 2 consistently maintains
an equal number of bricks at each side from the fulcrum. Conflict balance scale tasks in this
study consisted of:
1. A balance with unequal numbers of bricks at each side and on different distances from
the fulcrum.
2. A balance with multiple piles of bricks on different distances from the fulcrum and
Those two types have in common that they share varying variables and that makes this
balance scale task more complex.
(A) (B)
[image:9.595.96.513.111.603.2](C) (D)
Figure 1: Examples of problem types used in the experiment. The simple balance scale tasks
consisted of (A) Balances with unequal numbers of bricks at each side, equidistant from the
fulcrum and (B) Balances with equal numbers of bricks at each side, but on different
distances from the fulcrum. The conflict balance scale tasks consisted of (C) Balances with
unequal numbers of bricks at each side and on different distances from the fulcrum and (D)
Balances with multiple piles of bricks on different distances from the fulcrum and with
There were 120 stimuli of each type presented above and one third of all types of the
stimuli were in balance, one third of the stimuli would tip to the left side and one third of the
stimuli tip to the right side. All of the images contained the same amount of physical
elements; one balance scale and fourteen bricks. In order to create different images not all
bricks were placed on the balance. Figure 1 shows four examples of the used stimuli.
Experiment
This experiment was programmed in E-Prime (Psychology Software Tools Inc., Pittsburgh,
USA).
To achieve a baseline, participants were randomly shown 240 balance-images, without
having a given task. Each image was shown for 1500 milliseconds (ms) with an interstimulus
interval of 100 ms. After this baseline condition the same 240 balance-images were shown,
but participants were required to make a prediction about the movement of the balance scale;
whether the balance scale would keep its balance, it would tip to the left side or it would tip to
the right side. The „z‟-button should be pressed if the balance scale would tip to the left side,
the „/‟-button should be pressed if the balance scale would tip to the right side and the space
bar should be pressed if the balance scale would keep its balance. These buttons were given
stickers with „L‟ (Links; Left), „R‟ (Rechts; Right) and „E‟ (Evenwicht; Balance). By means
of pressing the „z‟-button, „/‟-button or the space bar, the fixation cross was displayed for 100
ms and the next image appeared. These images were also shown randomly.
Finally, a posttest was filled out by the subjects in order to measure the level of skills to
solve balance scale tasks as an estimation of the domain knowledge.
Procedure
The participants were instructed that the session would contain two parts, without
knowing the contents of these. After participants provided informed consent, an electrocap
was attached for the EEG recording.
After the first part of the experiment, the procedure of the second part of the experiment
was stated on the instruction screen. The participants were also verbally informed about the
procedure of this experiment and were instructed to perform as accurately and quickly as
possible. After the explanation, the participants had a practice session of four stimuli. Each
image remained on the screen, until the participant pressed a key for prediction. After
pressing a key, the participants received feedback. This feedback did not appear on the screen
After the experiment the participants filled out a posttest. Physics students received € 15,00
as a reward for their participation and psychology students received 2.0 course credits.
Behavioral Recording
Behavior was recorded with E-Prime (Psychology Software Tools Inc., Pittsburgh, USA).
This program measured reaction time and the number of correct and incorrect answers per
subject, per type and per stimulus.
After the experiment a posttest was filled out by the subjects in order to assess the
difference between physics students and psychology students in domain knowledge.
Electroencephalographic Recording
The EEG was DC-recorded at 500 Hz/channel with 0.01-100 Hz filter settings by
Brainrecorder (Brainproducts, GmbH, München, Germany). The EEG was recorded with
Ag/AgCl electrodes. These 64 electrodes were affixed at the cap in accordance with the
International 10-20 System of Electrode Placement (Oz, O1/2, Pz, P3/P4, P7/8, CPz, CP3/4,
TP7/8, Cz, C3/4, FT7/8, Fz, F3/4, F7/8, FP1/2 plus POz, PO3/4, PO7/8, P1/2, P5/6, CP1/2,
CP5/6, C1/2, C5/6, T7/8, FCz, FC1/2, FC3/4, FC5/6, F1/2, F5/6, AFZ, AF3/4, AF7/8, FPz).
The ground electrode was placed on the forehead and vertical and horizontal EOG were
recorded bipolarly from above/below the left eye and from the outer canthi of each eye.
Electrode impedance was kept below 10 kΩ.
Behavioral Analyses
The behavioral data was converted to SPSS Statistics 17.0 (SPSS Inc., Chicago, United
States of America). The means of correct predictions for simple and conflict balance scale
tasks were calculated and the means of physics students and psychology students were
compared. The number of correct predictions was marked in percentages. The mean reaction
time for simple and conflict balance scale tasks were also calculated and the means of physics
students and psychology students were compared. The reaction time was measured in
milliseconds. The percentage right answers of the posttest was also calculated.
EEG Analyses
The data was analyzed using Brain Vision Analyzer (Analysis software for EEG and
In this analysis the correct and incorrect predictions of the subjects were both included,
because this correctly reflects behavior. First of all the EEG-data was filtered (0.10 – 30 Hz,
24 dB/Oct, notch filter of 50 Hz) and an 1100 ms epoch was determined (-100 ms – 1000 ms).
A subsequent DCdetrend correction served the detrending to remove DC offsets and slow
drifts. Ocular correction was applied to correct eye movements and artifact rejection took
place. Individual difference waves were calculated for each participant and type and these
were calculated by subtracting the baseline from the experiment.
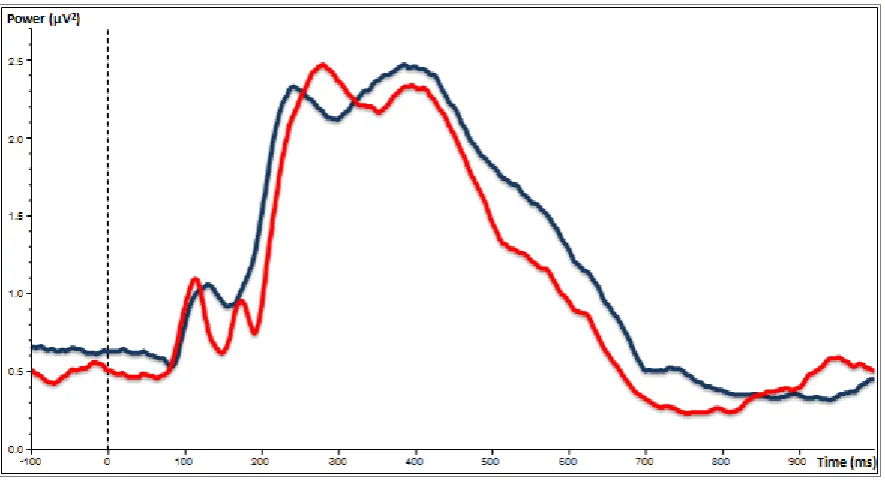
The global field power (GFP; Skrandies, 1995), a one-number measure of map strength
computed as spatial RMS, of the grand average was calculated. Figure 2 shows the global
field power of the super grand average of physics and psychology students. The peaks and
turning points in the curve of the global field power of the grand average defined the segment
borders, which resulted in eleven segments. Time windows were made of 10 milliseconds
around the peak latency time of these segments. The segments and the time windows are
shown in table 1.
Figure 2: The global field power of the super grand average of physics students and the
psychology students. The blue line represents the super grand average of the physics students
[image:12.595.76.519.382.623.2]Table 1: Eleven segments defined by the curve of the global field power and the time windows
that were made of 10 milliseconds around the peak latency time of the segments.
Segments Windows
0 – 70 ms 72 – 120 ms 122 – 178 ms 180 – 276 ms 278 – 452 ms 454 – 574 ms 576 – 654 ms 656 – 760 ms 762 – 814 ms 816 – 876 ms 878 – 1000 ms
36 – 46 ms 98 – 108 ms 142 – 152 ms 208 – 218 ms 344 – 354 ms 516 – 526 ms 614 – 624 ms 690 – 700 ms 770 – 770 ms 838 – 848 ms 918 – 928 ms
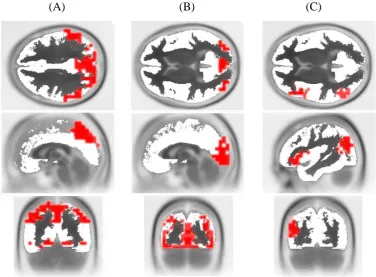
Low resolution electromagnetic brain topography (LORETA) was used for the EEG
source analysis. The averages of the time windows were the input for LORETA. Based on the
literature, Brodmann Areas formed regions of interest (ROIs), namely BA7, BA19 and BA40
were combined for estimation, BA17, BA18 and BA19 were combined for mental imagery
and BA39, BA44, BA45 and BA47 were combined for computation. For computation only
the left Brodmann Areas were used. Figure 3 shows the ROIs of estimation, mental imagery
and computation.
(A) (B) (C)
[image:13.595.109.486.434.711.2]Statistical Analysis
General Linear Models (GLM) with Repeated Measures was used to test the first and the
second research questions with a 2-leveled within-subject factor of Difficulty, namely simple
and conflict balance scale tasks. Study was the between-subjects variable with 2 levels,
namely physics and psychology.
GLM with Repeated Measures was performed to test the third research question. In the
3x2 design there was a within-subject factor of Brain with 3 levels, namely Estimation,
Imagery and Computation and a within-subject factor of Difficulty with 2 levels, namely
simple and conflict balance scale tasks. Study was the between-subjects variable with 2
levels; physics and psychology.
GLM with Repeated Measures was calculated to test the fourth and fifth research
questions. In this design there was a within-subject factor of Difficulty with 2 levels, namely
simple and conflict balance scale tasks. Study was the between-subjects variable with 2
levels; physics and psychology.
RESULTS
Behavioral Performance
Behavioral performance can be divided into accuracy of the task performance and
reaction time. The results of the accuracy of task performance and the reaction time are shown
in Table 2. The results of the accuracy of task performance are presented as percentage of
correct trials answered and the results of reaction time are presented as milliseconds of
[image:14.595.125.476.678.760.2]reaction time.
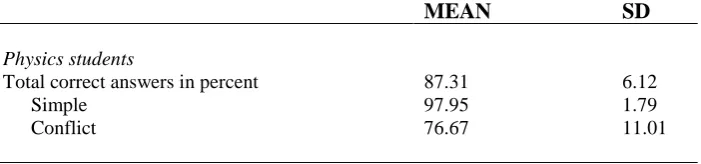
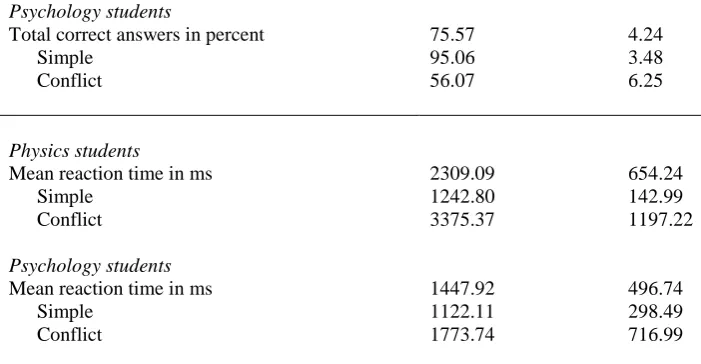
Table 2: The means and standard deviations of the subjects’ task performance and the means and standard deviations of the subjects’ reaction time. The total number of trials and the
number divided in two types of difficulty and the total reaction time and the reaction time
divided in two types of difficulty.
MEAN SD
Physics students
Total correct answers in percent 87.31 6.12
Simple 97.95 1.79
Psychology students
Total correct answers in percent 75.57 4.24
Simple 95.06 3.48
Conflict 56.07 6.25
Physics students
Mean reaction time in ms 2309.09 654.24
Simple 1242.80 142.99
Conflict 3375.37 1197.22
Psychology students
Mean reaction time in ms 1447.92 496.74
Simple 1122.11 298.49
Conflict 1773.74 716.99
For the data from all subjects, GLM Repeated Measures revealed a significant
Diff*Study-interaction effect (F(3,24)=33.222, P=.000) for accuracy and a significant
Diff*Study-interaction effect for reaction time (F(3,24)=21.492, P=.000). Further analysis
with a paired-sampled T-test located the significant differences. The T-values and the
significant differences between simple and conflict balance scale tasks for physics and
psychology students are presented in Table 3.
Table 3: T-values and significance of the differences between simple and conflict balance
scale tasks for physics students and psychology students.
T-value Sig.
Physics students
Accuracy – Simple vs. Conflict Reaction time – Simple vs. Conflict
7.688 -7.032
.000 .000
Psychology students
Accuracy – Simple vs. Conflict 26.453 .000
Reaction time – Simple vs. Conflict -5.206 .000
The results of GLM Univariate ANOVA showed a significant difference (F(1,25)=7.179,
P=.013) between physics students and psychology students in accuracy in simple balance
scale tasks. These results also showed a significant difference (F(1,25)=36.373, P=.000)
between physics students and psychology students in accuracy in conflict balance scale tasks.
In both cases physics students scored better in accuracy than psychology students.
There was no significant difference (F(1,25)=1.749, P=.198) between physics students
[image:15.595.122.473.83.265.2]significant difference (F(1,25)=18.100, P=.000) between physics students and psychology in
reaction time in conflict balance scale tasks. In this case psychology students reacted faster
than physics students.
After the experiment a posttest was filled out by the subjects in order to measure domain
knowledge in balance scale tasks. All subjects scored sufficient on this test, but there also was
a significant difference (F(1,25)=13.458, P=.0.001) between physics students and psychology
students in performing this task. Physics students scored 97.31% correct (SD = 3.20) and
psychology students scored 79.14 % correct (SD = 15.66%).
LORETA
For the variable Brain there were formed regions of interest (ROIs) of Brodmann Areas
implicated in estimation, imagery and computation. Computation contains two distinct brain
areas, namely the left angular gyrus (BA39) and the left inferior frontal cortex (BA44; BA45;
BA47). Those brain areas were compared and showed no significant difference. For this
reason the ROIs of computation contains the combination of the left angular gyrus and the left
inferior frontal cortex.
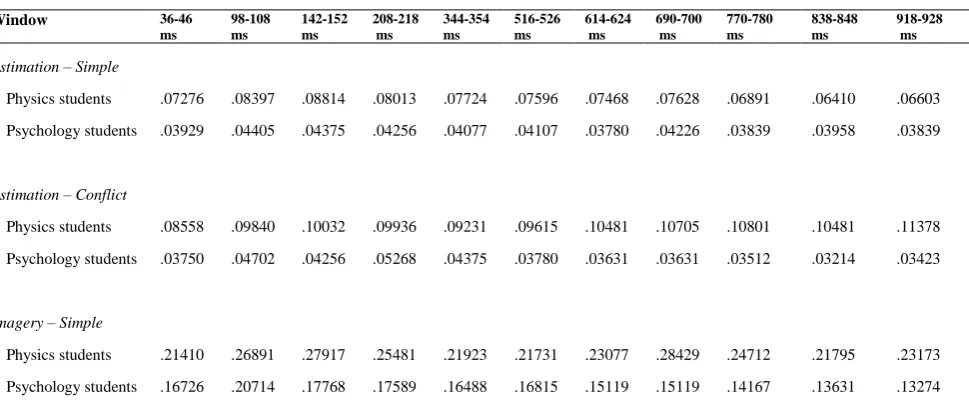
Table 4 shows the absolute activity (λ) of the formed regions of interest by LORETA in
the simple and conflict balance scale tasks in physics and psychology students in eleven time
windows. Table 5 shows the significant main effects of Brain and the study-effects in simple
[image:16.595.60.545.563.766.2]balance scale tasks.
Table 4: The absolute activity (λ) of the formed regions of interest by LORETA in the simple
and conflict balance scale tasks in physics and psychology students in eleven time windows
(in units x 10-3).
Window 36-46
ms 98-108 ms 142-152 ms 208-218 ms 344-354 ms 516-526 ms 614-624 ms 690-700 ms 770-780 ms 838-848 ms 918-928 ms
Estimation – Simple
Physics students .07276 .08397 .08814 .08013 .07724 .07596 .07468 .07628 .06891 .06410 .06603
Psychology students .03929 .04405 .04375 .04256 .04077 .04107 .03780 .04226 .03839 .03958 .03839
Estimation – Conflict
Physics students .08558 .09840 .10032 .09936 .09231 .09615 .10481 .10705 .10801 .10481 .11378
Psychology students .03750 .04702 .04256 .05268 .04375 .03780 .03631 .03631 .03512 .03214 .03423
Imagery – Simple
Physics students .21410 .26891 .27917 .25481 .21923 .21731 .23077 .28429 .24712 .21795 .23173
Imagery – Conflict
Physics students .22788 .37147 .29872 .26186 .20353 .22404 .23237 .26827 .24455 .24038 .25673
Psychology students .11964 .22798 .17976 .16994 .13393 .11488 .13065 .12232 .11845 .11280 .11696
Computation – Simple
Physics students .44135 .50385 .45096 .47885 .41827 .43558 .47788 .47692 .49904 .43173 .42404
Psychology students .26339 .27857 .27232 .26518 .27411 .26786 .28125 .30089 .29554 .28036 .29196
Computation - Conflict
Physics students .39327 .44327 .44423 .46923 .42212 .38269 .42212 .40000 .38558 .37885 .41250
[image:17.595.53.542.86.265.2] [image:17.595.110.487.359.536.2]Psychology students .27232 .29643 .33750 .28393 .27500 .27857 .30446 .24196 .25000 .23929 .28393
Table 5: The F-values (df = 2,24) of the significant main effects of the averages (Brain) and
the F-values (df = 1,25) of the significant main effects of the averages (Study) in eleven time
windows in simple balance scale tasks.
Window Brain Study
36-46 ms 98-108 ms 142-152 ms 208-218 ms 344-354 ms 516-526 ms 614-624 ms 690-700 ms 770-780 ms 838-848 ms 918-928 ms 31.219* 27.815* 20.995* 19.862* 33.142* 24.640* 19.394* 11.120** 10.158** 15.390* 19.080* 5.038*** 5.622*** 4.736*** 4.875*** 4.711***
* P = < .001 ** P = < .01 *** P = < .05
Physics students had a significantly greater brain activity than psychology students in the
second (98 ms – 108 ms), third (142 ms – 152 ms), fourth (208 ms – 218 ms), seventh (614
ms – 624 ms) and the eleventh (918 ms – 928 ms) time window.
Activity in brain areas implicated in imagery was compared with activity in brain areas
implicated in computation and estimation to locate the significant differences. In all time
windows, except the eighth time window (690 ms – 700 ms) the activity in brain areas
implicated for computation was greater than in brain areas implicated for imagery. In all time
windows the activity in brain areas implicated for imagery was greater than in the brain areas
Table 6: The F-values (df = 1,25) of the significant main effects of the averages (Imagery vs.
Computation and Imagery vs. Estimation) and the F-values (df = 1,25) of the significant main
effects of the averages (Study) in eleven time windows in simple balance scale tasks.
Window Imagery vs. Computation Imagery vs. Estimation
36-46 ms 98-108 ms 142-152 ms 208-218 ms 344-354 ms 516-526 ms 614-624 ms 690-700 ms 770-780 ms 838-848 ms 918-928 ms 16.722* 10.513** 6.437*** 7.622*** 14.909** 10.358** 9.053** 4.465*** 6.737*** 8.002** 26.170* 42.517* 30.044* 26.720* 37.477* 39.883* 40.231* 22.246* 27.409* 32.596* 33.716*
* P = < .001 ** P = < .01 *** P = < .05
For brain areas involved in imagery there were no significant study-effects found at
performing simple balance scale tasks, except the eleventh time window (918 ms – 928 ms).
For this window there was a significant study-effect (F(1,25)=5.039, P=.039) where physics
students had a greater activity in brain areas involved in imagery than psychology students.
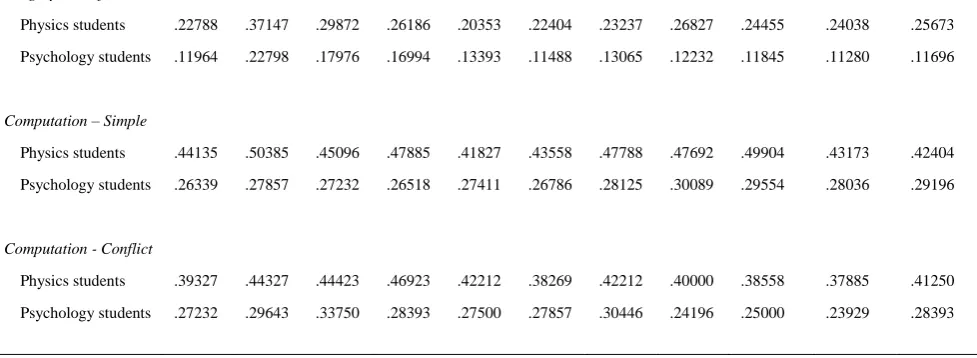
In order to the conflict balance scale tasks, table 7 shows the significant main effects of
the average (Diff), the interaction effects (Diff*Study) and the study-effects in eleven time
windows for estimation.
Table 7: The values (df = 1,25) of the significant main effects of the averages (Diff), the
F-values of the significant interaction effects (Diff*Study) and the F-F-values (df = 1,25) of the
significant main effects of the averages (Study) in eleven time windows for estimation.
Window Diff Diff*Study Study
[image:18.595.88.507.614.764.2]918-928 ms 8.743**
* P = < .001 ** P = < .01 *** P = < .05
Physics students had a significantly greater activity in brain areas implicated in
estimation than psychology students in all time windows.
Further analysis with GLM Univariate ANOVA located the significant differences in the
interaction effects (Diff*Study). Significant study-effects were noted for the seventh (614-624
ms), eighth (690-700 ms) and ninth (770-780 ms) time window for the simple balance scale
tasks, respectively (F(1,25)=10.719, P=.003), (F(1,25)=5.166, P=.032) and (F(1,25)=4.670,
P=.040). Significant study-effects were noted for the seventh time window (F(1,25)=13.464,
P=.001), eighth time window (F(1,25)=14.598, P=.001) and for the ninth time window
(F(1,25)=11.496, P=.002) for conflict balance scale tasks. Physics students had in all three
windows in both types of difficulty greater activity in brain areas implicated in estimation
than psychology students. In the seventh, eighth and ninth time window there were no
significant main effects of Difficulty for physics students or psychology students.
For computation there were no significant main effects of the averages of Difficulty,
interaction effects (Diff*Study) or study-effects in the eleven time windows.
DISCUSSION
This study examined whether solving strategies of simple and complex balance scale
tasks can be inferred from activity in brain areas estimated by LORETA recorded EEG.
Siegler (1976) distinguished six types of balance scale items. These six types are divided into
three simple types and three so-called conflict-types. In accordance to Siegler (1976), the
balance scale tasks in this study were also divided into two types of difficulty, namely simple
and conflict balance scale tasks.
The solving strategies for this study were derived from the rules which Siegler & Chen
(1998) established. Siegler & Chen (1998) distinguished four rules, developed by children, to
solve balance scale tasks. Rule I is used when an individual makes predictions based on
weight. When the weight on the left and right side is equal, an individual makes predictions
based on distance from the fulcrum. In rule III an individual always considers both distance
greater distance from the fulcrum and the other side has more weight. In rule IV an individual
multiplies distance from the fulcrum by its weight on each side.
Using these rules, potential strategies for solving balance scale tasks for this study were
identified, namely estimation, imagery and computation. Rule I and rule II could be an
example of imagery, rule III could be an example of estimation and rule IV of Siegler & Chen
(1998) has much in common with computation.
In order to answer the first and second research questions, it can be assumed that each
subject has developed rule I, rule II and rule III. For this reason there could be expected that
there is no difference between physics students and psychology students in number of correct
predictions in simple balance scale tasks. Though, in this study, physics students performed
better in accuracy than psychology students. Anexplanation might be that domain knowledge
of physics students is better automated than psychology students, what results in a better
performance in accuracy.
For the same reason, there could be expected that there is no difference between physics
students and psychology students in reaction time in simple balance scale tasks. The tests
showed the reaction time of physics and psychology students at this type of balance scale
tasks was really similar.
Robertson (2001) argues that differences in approach of problems between experts and
novices can be linked to domain knowledge. A posttest showed that physics students have
more domain knowledge of balance scale tasks than psychology students. Experts – in this
study physics students – spend a great deal of time analyzing a problem qualitatively and may
have developed strategies to help them deal with difficult problems in their domain of
knowledge (Chi, Glaser and Far, 1988). In this study it is plausible that physics students have
developed rule IV to solve balance scale tasks and can apply the physics formula M = F x r.
For this reason there could be expected that physics students performed better in accuracy in
conflict balance scale tasks than psychology students. Psychology students will probably not
have developed rule IV of Siegler & Chen (1998) and therefore they are not able to apply the
physics formula. The number of correct predictions of physics students was greater than the
number of correct predictions of psychology students in performing conflict balance scales, so
previously mentioned explanation is very plausible.
Because psychology students probably do not have developed rule IV to solve conflict
balance scale tasks, they will almost certainly use rule I, rule II or rule III. Rule I and rule II
can only be used when distance or number of bricks at both sides is fixed. Therefore,
conflict balance scale tasks when weight on one side is at a greater distance from the fulcrum
and the other side has more weight. Most likely psychology students will use estimation to
solve this balance scale type. After the experiment, many psychology students told that they
did not know how to solve the conflict balance scale task and they often estimated and
guessed the prediction.
On the other hand, physics students will solve conflict balance scale tasks using a
formula. After the experiment, physics students told that the conflict balance scale task was
not difficult, because they had practiced this in their first year of their physics study.
However, this takes more time in comparing with estimation. It is therefore plausible that the
reaction time of physics students is longer than psychology students and the results also have
shown this.
Interesting is whether behavior is consistent with brain activity in brain areas estimated
by LORETA recorded EEG (Pascual-Marqui et al., 1994).
Simple balance scale tasks do not require computation or estimation, since there is always
one fixed variable. It is plausible that simple balance scale tasks are solved using rule I and
rule II (Siegler & Chen, 1998). Shaver et al. (1975) claim that mental imagery reduces the
load on memory and therefore it plays a functional role in problem solving. Since
computation and estimation are probably excluded as solving strategy in this case, there could
be expected that simple balance scale tasks will be solved by imagery. In order to answer the
third research question this was tested and activity in brain areas implicated in imagery was
greater than activity in brain areas implicated in estimation. This applies to physics students
and psychology students and for all time windows. It is likely that estimation is not often
used, because simple balance scale tasks could be solved by rule I and rule II (Siegler &
Chen, 1998). Estimation or approximation would be used when an exact numerical number or
form is unknown, but that is not the case in simple balance scale tasks as there is always one
fixed variable and the varying variable need only be compared through perception.
However, activity in brain areas involved in imagery was lower than activity in brain
areas implicated in computation. An explanation might be that this task is solved by reasoning
and therefore brain areas assumed to be responsible for computation are used. Canessa et al.
(2005) showed in their study that the left angular gyrus (BA39) activates in deductive
reasoning. In this study the left angular gyrus was a part of the ROIs for computation. When
tasks, which activates the angular gyrus, the activity in brain areas implicated in computation
could thus be explained.
Also similarity between physics students and psychology students was tested in brain
areas involved in imagery. There were no study-effects between physics students and
psychology students in performing simple balance scale tasks, except the eleventh time
window (918 ms – 928 ms), where brain activity of physics students was greater than
psychology students.
Based on previously mentioned arguments psychology students will probably use
estimation as a way of solving conflict balance scale tasks and physics students will compute
them. In order to answer the fourth and fifth research questions, physics students showed in
the seventh (614-624 ms), eighth (690-700 ms) and ninth (770-780 ms) time window greater
activity than psychology students in brain areas implicated in estimation in simple and
conflict balance scale tasks. There were found no differences between physics students and
psychology students in brain areas involved in computation in conflict balance scale tasks. An
explanation could be related to the examined time interval. In this study, a time interval of
1000 ms is determined to measure brain activity, but this time interval could be too short to
measure computation. The mean reaction time of physics students was 3375.37 ms in conflict
balance scale tasks. Based on this reaction time it is likely that actual computation takes place
beyond the time interval of 1000 ms. After the experiment, physics students declared that it
was difficult for them to determine a strategy for predicting the balance scale tasks, because
the types of balance scale tasks were randomly shown. This will take time and therefore
computation probably takes place beyond the time interval of 1000 ms.
Another explanation could be the way knowledge is learned. Ansari (2008) claims that
less activation of the angular gyrus was found during problem solving of those trained using
the strategy algorithm than during the solving of problems learned by drill. Physics students
have mastered the physics formula M = F x r a long time, but this formula is not drilled. This
might be the reason that there is less activity in brain areas implicated in computation,
because the angular gyrus is a part of the combination of brain areas assumed to be
responsible for computation.
Recommendations for further study could be to lengthen the time interval. It would be
interesting to reanalyze the data and search for computational processes in a time interval of
In this study correct and incorrect predictions of the subjects were both included, because
this correctly reflected behavior. After the experiment, some physics students told that they
sometimes made mistakes, because they were still thinking about the previous balance scale
item. These incorrect predictions may affect the results and for this reason further
recommendations could be to filter incorrect answers in the behavior measurements and the
EEG-measurements.
Recommendations for further study could be to investigate differences in brain activity
between men and women. In this study there was made no distinction between male subjects
and female subjects and it would be interesting to divide physics students and psychology
students into two groups based on gender.
In this study physics students and psychology students both approach balance scale tasks
in their own way. It is therefore possible that they have used strategies, what are not examined
in this study. It would be interesting to investigate whether there is a difference in brain areas
implicated in estimation, imagery and computation, when subjects will previously be
instructed to use a particular strategy. The subjects will then divided into three groups and
each group should approach the balance scale task in a commended way, namely by
estimation, imagery and computation. It is possible that in such a situation greater differences
between brain areas can be found, because subjects will be limited in use of strategies.
CONCLUSION
The results reveal a number of differences at behavioral level. Physics students performed
better in simple balance scale tasks and conflict balance scale tasks. The better performing in
conflict balance scale tasks and the reactions of physics students after the experiment suggests
that physics students have developed rule IV of Siegler & Chen (1998) and that they compute
to solve conflict balance scale tasks. Physics students have a longer reaction time in conflict
balance scale tasks than psychology students. In accordance to Chi, Glaser and Farr (1988),
who suggest that experts spend a great deal of time analyzing a problem qualitatively, the
length of reaction time of physics students also implies that they probably use computation to
solve conflict balance scale tasks.
A greater activity is found in brain areas involved in imagery than in brain areas involved
in estimation, for both physics students and psychology students in simple balance scale tasks
students in brain areas involved in imagery in simple balance scale tasks, except the eleventh
time window (918 – 928 ms). This implicates a quite similarity between physics students and
psychology students. In addition, physics students and psychology students both had a greater
activity in brain areas involved computation than in brain areas involved in mental imagery.
In the seventh (614 ms – 624 ms), eighth (690 ms – 700 ms) and ninth (770 ms – 780 ms)
time window, physics students had a greater activity in brain areas implicated in estimation
than psychology students. This applies for simple and conflict balance scale tasks.
REFERENCES
Anderson, J.R. (2005). Cognitive psychology and its implications. New York: Worth
Publishers.
Ansari, D. (2008). Effects of development and enculturation on number representation in the
brain. Nature Reviews Neuroscience,9, 278–291.
Canessa, N., Gorini, A., Cappa, S.F., Piattelli-Palmarini, M., Danna, M., Fazio, F., & Perani,
D. (2005). The Effect of Social Content on Deductive Reasoning: An fMRI Study. Human
Brain Mapping, 26, 30-43.
Chi, M.T.H., Glaser, R., & Farr, M.J. (Eds.) (1988). The nature of expertise. Hillsdale, NJ:
Lawrence Erlbaum Associates Inc.
Dehaene, S., Spelke, E., Pinel, P., Stanescu, R., & Tsivkin, S. (1999). Sources of
mathematical thinking: Behavioral and brain-imaging evidence. Science, 284, 970–974.
Feigenson, L., Dehaene, S., & Spelke, E. (2004). Core systems of number. Trends in
Cognitive Sciences, 8, 307-314.
Finke, R.A. (1989). Principles of Mental Imagery. Cambridge, MA: MIT Press.
Goel, V., Gold, B., Kapur, S., & Houle, S. (1997). The seats of reason? An imaging study of
Inhelder, B., & Piaget, J., (1958). The growth of logical thinking from childhood to
adolescence. New York: Basic Books.
Kosslyn, S.M., Alpert, N.M., Thompson, W.I., Maljkovic, V., Weise, S.B., Chabric, C.F.,
Hamilton, S.E., Raunch, S.L., & Buonanno, F.S. (1993). Visual mental imagery activates
topographically organized visual cortex: PET investigation. Journal of Cognitive
Neuroscience, 5, 263-287.
Kosslyn, S.M. (1994). Image and brain: The resolution of the imagery debate. Cambridge,
MA: MIT Press.
Kosslyn, S.M., Pascual-Leone, A., Felician, O., Camposano, S., Kennan, J.P., Thompson,
W.L., Ganis, G., Sukel, K.E., & Alpert, N.M. (1999). The role of area 17 in visual imagery:
Convergent evidence from PET and rTMS. Science, 284, 167 – 170.
Kucian, K., von Aster, M., Loenneker, T., Dietrich, T., & Martin, E. (2008). Development of
neural networks for exact and approximate calculation: A fMRI Study. Developmental
Neuropsychology, 33: 4, 447–473.
Marini, Z., & Case, R. (1994). The development of abstract reasoning about the physical and
social world. Child Development, 65, 147–159.
O‟Craven, K.M., & Kanwisher, N. (2000). Mental imagery of faces and places activates
corresponding stimulus-specific brain regions. Journal of cognitive neuroscience, 12:6,
1013-1023.
Pascual-Marqui, R.D., Michel, C.M., & Lehmann, D. (1994). Low resolution electromagnetic
tomography: a new method for localizing electrical activity in the brain. International Journal
of Psychophysiology, 18, 49-65.
Pascual-Marqui, R.D. (1999). Review of methods for solving the EEG inverse problem.
Pascual-Marqui, R.D., Lehmann, D., Koenig, T., Kochi, K., Merlo, M.C.G., Hell, D., &
Koukkou, M. (1999). Low resolution brain electromagnetic tomography (LORETA)
functional imaging in acute, neuroleptic-naive, first-episode, productive schizophrenia.
Psychiatry Research Neuroimaging, 90, 169-179.
Pascual-Marqui, R.D., Esslen, M., Kochi, K., & Lehmann, D. (2002). Functional imaging
with low resolution brain electromagnetic tomography (LORETA): review, new comparisons,
and new validation. Japanese Journal of Clinical Neurophysiology, 30, 81-94.
Robertson, S.I. (2001). Problem solving. New York, Psychology Press Ltd.
Roth, W.M. (1991). The development of reasoning on the balance beam. Journal of Research
in Science Teaching, 28, 631–645.
Schwartz, D.L., & Heiser, J. (2006). Spatial representations and imagery in learning. In R.K.
Shaver, P., Pierson, L., & Lang, S. (1975). Converging evidence for the functional
significance of imagery in problem solving. Cognition Volume 3, Issue 4, 359-375.
Siegler, R.S. (1976). Three aspects of cognitive development. Cognitive Psychology, 8, 481–
520.
Siegler, R.S. (1981). Developmental sequences within and between concepts. Monographs of
the Society for Research in Child Development, 46, (Serial No. 189).
Siegler, R.S., & Booth, J.L. (2005). Development of numerical estimation: A review. J.I.D.
Campbell (Ed.), Handbook of mathematical cognition, 197-212. New York: Psychology
Press.
Siegler, R.S., & Chen, Z. (1998). Developmental differences in rule learning: A microgenetic
analysis. Cognitive Psychology, 36, 273–310.
Skrandies, W. (1995). Visual information processing: topography of brain electrical
Slotnick, S.D., Thompson, W.L., & Kosslyn, S.M. (2005). Visual mental imagery induces
retinotopically organized activation of early visual areas. Cerebral Cortex, 15, 1570-1583.
Surber, C.F., & Gzesh, S.M. (1984). Reversible operations in the balance scale task. Journal
SAMENVATTING
Er is veel onderzoek gedaan naar strategieën die gebruikt worden voor het oplossen van
balanstaken. Deze strategieën werden voornamelijk afgeleid van het gedrag, maar in deze
studie is er gekeken of strategieën, als schatten, verbeelden en berekenen, kunnen worden
bepaald door middel van activiteit in hersengebieden die zijn samengesteld door Low
Resolution Electromagnetic Tomography (LORETA) en gemeten door elektro-encefalografie
(EEG). In deze studie hebben 13 natuurkundestudenten en 14 psychologiestudenten de stand
van de balans voorspeld van 120 simpele balanstaken en 120 complexe balanstaken. De
resultaten laten zien dat natuurkundestudenten meer correcte voorspellingen geven dan
psychologiestudenten bij zowel de simpele als complexe balanstaken. Daarnaast hadden
natuurkundestudenten bij het maken van complexe balanstaken een langere reactietijd dan
psychologiestudenten. Tijdens het voorspellen van simpele balanstaken hadden natuurkunde-
en psychologiestudenten meer activiteit in de angular gyrus en de inferior frontal gyrus,
waarvan in deze studie wordt aangenomen actief te zijn bij het maken van berekeningen, dan
in hersengebieden die betrokken zijn bij mentale verbeelding en het maken van schattingen.
Ook was er geen verschil te vinden tussen natuurkunde- en psychologiestudenten in activiteit
in hersengebieden die betrokken zijn bij mentale verbeelding. Natuurkundestudenten hadden
tijdens het voorspellen van complexe balanstaken meer hersenactiviteit in de inferior en
superior parietal kwab, inclusief de intraparietal sulcus en de extrastriate middle occipital
gyrus en fusiform gyrus, waarvan in deze studie wordt aangenomen dat deze gebieden worden