Information from forced exercise tests conducted on fish in swim tunnel respirometers has led to division of the overall performance envelope into three main categories. Low-intensity activity is classified as sustained swimming, which can be maintained for extended periods (at least 200·min) without interruption or failure (Beamish, 1978). The highest velocity that can be maintained for at least 200·min is defined as maximum sustained speed. Locomotory activity in excess of maximum sustained speed is classified as prolonged swimming, which eventually ends in fatigue after 20·s to 200·min, depending on exercise intensity and duration. High-intensity, short-lived (<20·s) activity is classified as burst or sprint swimming (Beamish, 1978).
Fish employ a variety of locomotory gaits that are differentially recruited in an effort to maximize muscle power generation and efficiency over a wide range of swimming
speeds. Muscle efficiency is optimal when the contraction rate (V) divided by the maximum rate of contraction (Vmax) is in the range of approximately 0.17–0.36 (Rome et al., 1990). Sustained swimming speeds are supported primarily by red, slow-twitch, lateral muscle fibres and a steady, undulatory locomotory gait (Coughlin and Rome, 1996; Altringham and Ellerby, 1999). However, as power demands increase within the sustained performance envelope, contraction rates in the red muscle eventually reach levels that put V/Vmaxbeyond the upper efficiency threshold. Fish react to this by recruiting white muscle fibres, which have a much higher maximum rate of contraction (Rome et al., 1990), and an unsteady, burst-and-coast, locomotory gait (Jayne and Lauder, 1996). As the transition from steady to unsteady swimming coincides with the switch from sustained to prolonged swimming, gait transition speed has been proposed as an alternative method for doi:10.1242/jeb.00927
We examined swimming behaviour, gait recruitment and post-exercise muscle glycogen, muscle lactate, plasma lactate and oxygen consumption in smallmouth bass (Micropterus dolomieu; 24–38·cm fork length) that voluntarily ascended a 25·m raceway against water velocities ranging from 40 to 120·cm·s–1. Physiological parameters were referenced to additional measurements made following exhaustive exercise in a static tank and aerobic exercise in a swim tunnel. Maximum speeds maintained exclusively using a steady gait in the raceway ranged from 53.6 to 97.3·cm·s–1and scaled positively with fish length. Minimum swimming speeds maintained exclusively through recruitment of an unsteady gait were also positively correlated to fish length and ranged from 81.4 to 122.9·cm·s–1. Fish switched between steady and unsteady swimming at intermediate speeds. Smallmouth bass always maintained a positive ground speed in the raceway; however, those that primarily swam using a steady gait to overcome low to moderate water velocities (20–50·cm·s–1) maintained mean ground speeds of
~20·cm·s–1. By contrast, mean ground speeds of fish that primarily recruited an unsteady locomotory gait increased significantly with water velocity, which resulted in an inverse relationship between exercise intensity and duration. We interpret this behaviour as evidence that unsteady swimming was being fuelled by the limited supply of anaerobic substrates in the white muscle. This hypothesis is supported by the fact that unsteady swimming fish showed significantly lower muscle glycogen levels, higher lactate concentrations (muscle and plasma) and higher post-exercise oxygen consumption rates compared with fish that used a steady gait. The reduction in passage time achieved by fish using an unsteady gait allowed them to ascend the raceway with relatively minor post-exercise metabolic imbalances, relative to individuals chased to exhaustion.
Key words: swimming gait, exercise physiology, aerobic, anaerobic,
Micropterus dolomieu.
Summary
Introduction
Locomotory behaviour and post-exercise physiology in relation to swimming
speed, gait transition and metabolism in free-swimming smallmouth bass
(Micropterus dolomieu)
Stephan J. Peake
1,* and Anthony P. Farrell
21Department of Biology, University of New Brunswick, Fredericton, NB, E3C 6E1, Canada and 2Department of
Biology, Simon Fraser University, Burnaby, BC, V5A 1S6, Canada
*Author for correspondence (e-mail: speake@unb.ca)
estimating maximum sustained speed (Drucker, 1996), although this possibility has largely been ignored (Plaut, 2001). Fish moving at sustained swimming speeds generate energy primarily through aerobic oxidation of lipids (Weber and Haman, 1996; Kieffer et al., 1998), proteins (Moon and Johnston, 1980; Weber and Haman, 1996) and carbohydrates (Moyes and West, 1995; Richards et al., 2002). Prolonged swimming is supported by aerobic and anaerobic metabolic processes, while burst activity is fuelled exclusively by the latter. Energy for anaerobic activity is derived from three endogenous fuels stored in the white muscle: phosphocreatine, ATP and glycogen. Glycogen is stored by resting fish in amounts that vary considerably among species (Day and Butler, 1996; Wilkie et al., 1996; Milligan et al., 2000), and the degree to which levels fall after exposure to anaerobic exercise varies with the nature, intensity and duration of the activity. For every mole of glycogen used to support anaerobic metabolism, two moles of lactate are produced. Lactate generated in the muscle is either retained (where it may be converted back to glycogen in situ) or released into the blood (Milligan, 1996). Once in the blood, it can be resequestered by the white muscle (Milligan and Girard, 1993) or oxidized in the red muscle (Richards et al., 2002), heart (Milligan and Farrell, 1991), liver and/or gills (Bilinski and Jonas, 1972). In any case, many of the remaining physiological disturbances associated with anaerobic activity are cleared during a period of elevated post-exercise oxygen consumption (EPOC).
Much of the information summarized above has been generated by studying individuals (1) forced to perform in swim tunnel respirometers, (2) chased or angled to exhaustion or (3) removed from commercial fishing nets. These approaches have invariably involved the imposition of exercise
regimes on the research subjects and, as such, there has been little opportunity for individuals to employ behavioural strategies to maximize locomotory efficiency and minimize energy expenditure. As a result, very little information exists on the way in which fish swim in nature or on the physiological impacts and consequences of the strategies that individuals employ when faced with various locomotory challenges. As such, we chose to study locomotory behaviour of smallmouth bass (Micropterus dolomieu) during a voluntary ascent through a 25·m raceway. As it is prohibitively difficult to directly measure physiological and metabolic processes during exercise in unconfined fish, we focussed on easily observable locomotory gaits employed by individuals in the raceway and used already established (and previously discussed) relationships between gait selection, energy use and muscle recruitment patterns to link metabolism to swimming performance. Our specific objectives were to (1) describe the relationship between gait recruitment and swimming speed and (2) determine if (and how) free-swimming smallmouth bass trade off exercise intensity and duration during short-term bouts of steady and unsteady swimming. Our final objective was to measure post-exercise physiological parameters (including oxygen consumption) to (1) confirm any links between gait recruitment, swimming speed and metabolism established from the behavioural experiments and (2) evaluate the effectiveness (at a physiological level) of any behavioural strategies observed during raceway ascents.
Materials and methods
Experimental animals
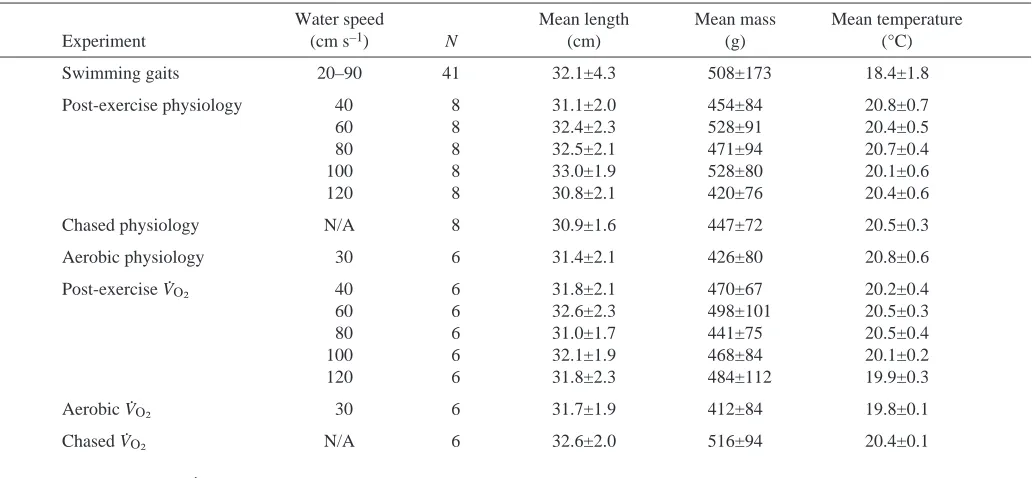
[image:2.612.46.562.490.729.2]Smallmouth bass (Micropterus dolomieu Lacepede) were Table 1. Numbers of fish, mean fork lengths, mean masses, mean water temperatures for smallmouth bass used in the gait
transition and physiological experiments
Water speed Mean length Mean mass Mean temperature
Experiment (cm·s–1) N (cm) (g) (°C)
Swimming gaits 20–90 41 32.1±4.3 508±173 18.4±1.8
Post-exercise physiology 40 8 31.1±2.0 454±84 20.8±0.7
60 8 32.4±2.3 528±91 20.4±0.5
80 8 32.5±2.1 471±94 20.7±0.4
100 8 33.0±1.9 528±80 20.1±0.6
120 8 30.8±2.1 420±76 20.4±0.6
Chased physiology N/A 8 30.9±1.6 447±72 20.5±0.3
Aerobic physiology 30 6 31.4±2.1 426±80 20.8±0.6
Post-exercise VO∑ 40 6 31.8±2.1 470±67 20.2±0.4
60 6 32.6±2.3 498±101 20.5±0.3
80 6 31.0±1.7 441±75 20.5±0.4
100 6 32.1±1.9 468±84 20.1±0.2
120 6 31.8±2.3 484±112 19.9±0.3
Aerobic VO∑ 30 6 31.7±1.9 412±84 19.8±0.1
Chased VO∑ N/A 6 32.6±2.0 516±94 20.4±0.1
collected from the Winnipeg River (using angling gear and trap nets) and transported, in an aerated livewell, a short distance (<1·km) to a research site in Pinawa, Manitoba, Canada. On occasion, additional fish were collected from various lakes within 100·km of Pinawa and transported in a 250·litre aerated tank placed in the back of a pickup truck. Length and mass for all fish used in various experiments are given in Table·1. Fish were housed at the research site in a 2000·litre aquarium constantly supplied with water from the Winnipeg River at a rate of approximately 0.5·l·s–1. Smallmouth bass were not fed while in captivity and were always allowed at least 24·h of recovery time before being used in an experiment.
Experimental raceway
All experiments were performed in an experimental raceway located at the downstream side of a small diversion dam in Pinawa, Manitoba (Fig.·1A). Water was siphoned into the apparatus from the upstream side by gravity (head differential was approximately 4·m) through six polyvinylchloride pipes (20·cm diameter) fitted with butterfly valves at each end. The volume of water entering the raceway through each pipe (and therefore water velocity within the system) was controlled
using the downstream valves. Water from the siphons entered the upstream tank of the raceway and moved through a system of baffles designed to minimize turbulence and straighten the flow. Water then moved through the upstream tank and into the raceway, which was approximately 25.0·m long, 0.6·m wide and 0.8·m deep. Plywood covers were used to provide overhead shade. A 2.5·m longitudinal section of the raceway (near its upstream terminus) was lined with clear Plexiglas (19·mm thick), which allowed observations of fish as they swam by. This observation area was enclosed by a small building to provide protection and shade. The raceway terminated at the downstream tank, which was approximately 6.0·m long, 3.5·m wide and 1.5·m deep. Water moving through the downstream tank exited the system through a sluice gate built into the back wall (Fig.·1A). The height of the sluice gate could be adjusted to fine-tune water depth and velocity.
To facilitate entry of fish into the raceway, the downstream tank was outfitted with guide walls that extended from the raceway entrance to the sides of the tank at an angle of approximately 30° (Fig.·1A). In addition, a ramp was placed in the downstream tank that extended from the floor to the raceway entrance, creating an incline of ~15°. The floor of the
Fish entry/exit
Upstream valve Downstream
valve
Magnetic stirrers Dissolved oxygen probe Velocity meter
Swim chamber
Downstream tank wall
B
50 cm 0
Light-gate detectors
Gait observation
area Siphons
Baffles Capture well
(see Fig. 2) Sluice gate
Submerged
holding wells Ramp and
guide walls
Downstream tank
Raceway Upstream
tank Gate
TO P VIEW SIDE VIEW
Dam
A
5 m 0
raceway was approximately 30·cm higher than that of the tank, so that the system could be emptied without inadvertently stranding the test subjects.
During experiments, water velocity was set using a recently calibrated Swoffer Model 2100 propeller-driven flow meter (Forestry Suppliers, Inc., Jackson, MS, Canada). Preliminary trials indicated that smallmouth bass generally swam near the bottom of the raceway. As such, the flow meter was always placed approximately 8·cm from the bottom to reflect the water speed directly experienced by the fish. Movements of individuals were monitored using a custom designed and built array of 15 light-gate sensors placed at 1.78·m intervals along the longitudinal length of the raceway (Fig.·1A). Red light from a light-emitting diode (LED) travelled through a small Plexiglas window recessed into the raceway wall, through the water, through another Plexiglas window on the opposite wall of the raceway and onto a small (3·mm2) sensor. Fish moving past a light-gate sensor would block light from reaching the sensor. When this occurred, a custom designed and built processor/datalogger recorded the sensor (1 to 15) that had been blocked and the time at which the blockage occurred (to the nearest 0.01·s). The amount of time required for a fish to move from one sensor to the next was used to calculate ground speed for that interval. Thus, a complete ascent would yield 14 individual ground speeds. This system was found to be extremely responsive and accurate. Resolution varied inversely with ground speed; however, the latter could always be resolved to within at least 0.5·cm·s–1 within any given interval. The average of the 14 individual ground speeds for each ascent was added to the imposed water velocity to yield mean swimming speed for that ascent.
Swimming gaits and behaviour of fish in the raceway
The relationship between locomotory gait and swimming speed was assessed for smallmouth bass by placing individuals in the downstream tank and exposing them to various water velocities ranging from 20 to 90·cm·s–1 (Table·1) for several hours. Although most fish voluntarily ascended the raceway during the exposure period, those that did not were removed and released or kept for use in other experiments. Smallmouth bass that ascended the raceway were filmed using a VHS video recorder (JVC, Model GR-SXM330U; FutureShop, Winnipeg, MB, Canada) as they swam through the Plexiglas-lined area built into the raceway. Videotapes were analysed to provide simultaneous gait use and swimming speed data. Vertical grid lines drawn 10·cm apart on the Plexiglas allowed swimming speed to be assessed by dividing grid distance by the number of video frames the fish required to move from one gridline to the next, divided by the frame rate of the camera (30·Hz). Again, resolution decreased with increasing ground speed; however, the latter could generally be resolved to within 5·cm·s–1 or less between any given grid interval. Swimming speed (ground speed plus water velocity) was determined for at least two different grid intervals and the mean was recorded. For smallmouth bass using an unsteady swimming gait, grid intervals coinciding with fish that had just started their passive
glide were used in speed determinations. Mean swimming speed in the raceway (as determined by the light-gate sensors) was compared with swimming speed through the observation window (as determined from the two light-gate sensors at the beginning and end of this window, as well as from the videotape analysis) to verify that swimming speed, and hence behaviour, in the viewing section was representative of that in the entire raceway (see Results).
Swimming gaits were classified as either steady or unsteady using criteria similar to those described by Rome et al. (1990). Smallmouth bass were considered to be swimming steadily if they demonstrated rhythmic, undulatory locomotion that involved no bursts of activity or abrupt acceleration or deceleration. Any activity that was characterized by short periods of vigorous tail beating, rapid acceleration and/or passive gliding was classified as unsteady. Gait parameters of particular interest were (1) the highest speed maintained exclusively through steady swimming and (2) the lowest speed maintained exclusively by unsteady locomotion.
Post-exercise physiology of fish in the raceway
capture well and killed by a sharp blow to the head. A section (approximately 0.5·cm×1.0·cm×1.0·cm) of white muscle was excised below and just anterior to the dorsal fin. Once removed, the sample was immediately freeze-clamped using aluminium tongs cooled on dry ice, wrapped in pre-labelled aluminium foil and stored on dry ice. A 2·ml blood sample was then removed by caudal puncture using a 3·ml heparinized vacutainer. After the blood was centrifuged, the plasma was divided into pre-labelled 500·µl Eppendorf tubes and frozen on dry ice. Samples were kept on dry ice until they could be moved to a freezer, where they were kept at –70°C.
Physiology of aerobically exercised and exhausted fish
Post-exercise physiology of aerobically exercised smallmouth bass was measured by placing individuals (N=8; see Table·1 for details) in a 47·litre swim tunnel respirometer fashioned from a 1.5·m-long section of Plexiglas pipe with an inside diameter of 20·cm. The upstream end of the pipe was fastened to the side of the downstream tank of the raceway (Fig.·1B). Water flowed by gravity (head differential was approximately 60·cm) from the downstream tank through a butterfly valve, past the upstream retention screen of the swim chamber, through the swim chamber (approximately 90·cm in
length), past the downstream retention screen, a propeller-driven velocity meter and a dissolved oxygen/temperature probe (WTW, Model 340i; Clean Earth Scientific, Montreal, QC, Canada), through another butterfly valve and into the Pinawa Channel (Fig.·1B). Two magnetic stir bars (8·cm long) were fastened to the floor of the respirometer and inclined toward the swim chamber at an angle of ~15°. One bar was placed immediately under the dissolved oxygen probe while the other was located near the upstream retention screen. Magnetic stirrers were placed against the bottom, outside wall of the respirometer directly under the stir bars. This allowed the water to be circulated when the system was closed, and it kept a steady current flowing across the membrane of the oxygen probe. The upstream valve of the respirometer controlled the volume of water that entered the device, while the downstream valve was used to adjust water velocity. Fish were introduced and removed though an opening on the top of the respirometer, which could be left open or sealed with a Plexiglas lid fitted with a rubber O-ring (Fig.·1B). The entire apparatus, except for the opening through which fish were introduced and removed, was covered with black plastic to ensure the fish did not become startled or distracted by outside activity.
Once in the respirometer, water velocity was set at 30·cm·s–1. Under these conditions, fish swam at an equal and opposite velocity using a steady locomotory gait. Individuals were left in the respirometer for at least 8·h to (1) ensure that only aerobic energy was being used to support the activity, (2) allow time for recovery from any anaerobic disturbances associated with handling and (3) reduce the possibility that anaerobic metabolism would occur as a result of confinement stress (Milligan et al., 2000). Following this, and immediately prior to sampling, the valves on the respirometer were closed, a concentrated clove oil/ethanol solution was added to the water, and the magnetic stirrers were activated. The final concentration of the anaesthetic solution was ~300·mg·l–1. Once anaesthetized, smallmouth bass were removed from the respirometer and killed, and muscle and blood samples were taken, processed and stored exactly as described for the raceway experiments.
The physiological condition of exhausted fish was examined by chasing individuals (N=8; see Table·1 for details) in a static tank until they became unresponsive to further stimulation (this took 2–3·min), after which fish were placed in another tank containing a 300·mg·l–1 clove oil/water anaesthetic solution. Once anaesthetized, smallmouth bass were removed, killed and sampled exactly as described previously.
The analytical techniques and instruments used to measure lactate and glycogen in tissues followed those fully described in Farrell et al. (2000).
Oxygen consumption experiments
Elevated post-exercise oxygen consumption is evidence of anaerobic activity in intact fish (Beamish, 1978). To further link metabolism and swimming speed in smallmouth bass, in the absence of confounding effects that may have occurred in Raceway
Gate Upstream tank
Capture well Cover
Capture well
Raceway Gate
B
A
association with tissue sampling, post-exercise oxygen consumption of smallmouth bass was measured following a voluntary ascent through the upstream raceway against water moving at 40, 60, 80, 100 or 120·cm·s–1(N=6 at each speed; see Table·1 for details). These experiments were conducted exactly as described previously for terminal sampling experiments; however, less anaesthetic was used (final concentration was ~60·mg·l–1) once fish were trapped in the capture well. As soon as equilibrium was lost, fish were removed from the well, placed in a transfer bucket containing fresh water and placed (within about 60·s) in the swim tunnel respirometer described previously. In the majority of cases, fish regained equilibrium while still in the transfer bucket. Water velocity in the respirometer was set at 10·cm·s–1, and fish were left to recover from anaesthesia for 3·min (all fish were swimming within 30·s of being placed in the respirometer). After this, the downstream valve was closed, which caused water to overflow through the opening used to introduce and remove the fish (the cover was not sealed). This ensured that all air bubbles in the system were removed. The overflow was stopped by sealing the opening, and closing the upstream valve. At this time, the magnetic stirrers were activated and the oxygen probe was prompted to begin measuring and storing dissolved oxygen and water temperature readings. Dissolved oxygen was monitored for 30·min (preliminary experiments had indicated that post-exercise oxygen consumption rates typically returned to resting levels within 30·min), after which the magnetic stirrers and oxygen probe were turned off and fresh water was re-introduced into the system.
Post-exercise oxygen consumption rates for fish exposed to aerobic exercise were examined by placing individuals (N=6; see Table·1 for details) in the respirometer and acclimating them to a water velocity of 30·cm·s–1 for at least 8·h, after which the respirometer valves were closed and a clove oil/ethanol anaesthetic solution was added (final concentration was approximately 60·mg·l–1). Fish were anaesthetized so that the protocol would be the same as that employed in experiments designed to measure post-exercise oxygen consumption rates of fish that ascended the raceway. The magnetic stirrers were used to mix the anaesthetic into the water, and fish were monitored until they first began to lose equilibrium. Smallmouth bass were then removed from the respirometer and placed in the transfer tank (which contained fresh water) where they were left for 60·s (the amount of time required to move fish tested in the raceway experiments). While fish were in this tank, the magnetic stirrers were stopped, and the respirometer was emptied, flushed with fresh water and re-filled. Individuals were then placed back inside and allowed to recover for 3·min after which oxygen consumption measurements were made as described previously.
Post-exhaustion oxygen consumption was measured by chasing individuals (N=6; see Table·1 for details) in a static tank, lightly anaesthetizing them in a 60·mg·l–1 clove oil solution, moving them to the transfer bucket for 60·s, placing them in the respirometer for 3·min and measuring oxygen consumption as described previously.
The respirometer was cleaned regularly and blank runs confirmed that exogenous oxygen demand was negligible. Water and air temperatures were similar during the course of this study. This, in concert with the relatively short period during which oxygen consumption was measured (30·min), ensured that water temperature did not change appreciably from ambient while the respirometer was closed. Following oxygen consumption measurements, fish were removed from the respirometer and released or used in other experiments after at least 24·h of recovery.
Data analysis and statistical procedures
Gait selection at all swimming speeds (calculated from the videotapes) was compiled for smallmouth bass of varying size and grouped according to fork length (to the nearest cm). Within each group, the highest swimming speed maintained exclusively through steady swimming, and the lowest speed maintained exclusively though unsteady swimming, were identified, pooled and correlated to fork length using regression analysis.
During physiological experiments, mean swimming speeds attained by smallmouth bass in the raceway (calculated using the light-gate data) were categorized as steady, transitional or unsteady based on results of the gait experiments. Within these groups, and those for aerobically exercised and exhausted fish, physiological data were compared using analysis of variance. Tukey tests were used for all post-hoc pairwise comparisons. Statistical significance was indicated whenever P-values were less than 0.05.
Results
Swimming gaits and behaviour of fish in the raceway
Fork length of smallmouth bass in the swimming gait experiments ranged from 24 to 38·cm (Table·1). Fish viewed through the observation window demonstrated either steady, unsteady or a mixture of steady and unsteady gaits, depending on the swimming speed they maintained, which in turn depended on the magnitude of the water velocity in the system. Steady swimming was supported by slow and rhythmic undulations of the body and caudal fin, the latter being fully fanned for maximum cross-sectional area. Unsteady locomotion was characterized by accelerative sprints followed by passive glides that resulted in rapid decelerations. Sprints were supported by two or three large-amplitude caudal tail beats. Passive glides were characterized by retraction of the dorsal and ventral aspects of the caudal fin (presumably to reduce its area), retraction of other fins against the body wall, and maintenance of a straight and rigid body. Glide distance ranged from ~20 to 30·cm, and the next sprint was initiated just before zero ground speed was reached.
while the lowest unsteady speed marked the lower boundary of the unsteady zone. Fish moving past the observation window tended to avoid swimming at speeds that fell between the highest steady and lowest unsteady swimming speed, an area that will be termed the transitional zone. Exceptions to this rule occasionally occurred when fish used a mixture of steady and unsteady gaits when faced with intermediate water velocities (approximately 50–60·cm·s–1). Mean swimming
speeds calculated during these events often included a relatively low value (when fish were swimming steadily) and a relatively high value (when fish were swimming unsteadily), which resulted in an intermediate mean speed that fell within the transitional zone (Fig.·3A).
The highest mean swimming speeds that smallmouth bass moving past the observation window could maintain using a steady locomotory gait ranged from 53.6 to 97.3·cm·s–1 and
Transitional zone
Fork length (cm)
20 22 24 26 28 30 32 34 36 38 40 42 40
60 80 100 120 140 160
Lowest unsteady speed Highest steady speed
B
Unsteady zone
Steady zone
A
Steady zone Transitional zone
Unsteady zone
Water velocity (cm s–1)
Water velocity (cm s–1)
20 30 40 50 60 70 80
Mean sw
im
m
in
g
s
p
eed f
ro
m
video (
cm
s
–1)
40 60 80 100 120 140
Steady gait Mixed gaits Unsteady gait
D
a,b a,b c a b b
d d A,B
A,B
A A,B
B B
C C
20 30 40 50 60 70 80 90
0 10 20 30 40 50 60 70 80 90
M
ean pass
age
tim
e (s)
25 50 75 100 125 150 175 200 Steady zone
Transitional zone Unsteady zone
a a a
b b
c c c
a,b
C
Steady Transitional Unsteady
Mean
g
roun
d s
p
eed
(c
m
s
–1)
0 10 20 30 40 50 60
Video analysis
Light sensors (observation window) Light sensors (entire raceway)
Fig.·3. Data from locomotory gait and behaviour experiments. (A) The relationship between mean swimming speed (determined from videotapes) and water velocity for 30·cm smallmouth bass in the raceway, and the locomotory gaits used by individuals to attain various speeds. Similar patterns existed for other size groups (24–38·cm). (B) The relationship between fork length and maximum steady (solid line,
y=3.9+2.3x, r2=0.65) and minimum unsteady (broken line, y=46.2+1.8x, r2=0.55) gait thresholds for smallmouth bass in the raceway. (C) Mean
ground speeds calculated from videotapes, the light-gate interval that spanned the observation window and the light-gate data from the entire raceway for smallmouth bass that were observed using steady, mixed or unsteady locomotion. Significant differences within gaits are indicated by differing lowercase letters. (D) Mean ground speeds (vertical bars) and passage times (black circles) for smallmouth bass relative to water velocities in the raceway. Dark, intermediate and light sections within each vertical bar indicate the relative proportions (0–100%) of fish that swam at mean speeds that fell within the steady, transitional and unsteady zones. Significant differences in mean ground speed and passage
increased significantly with fork length (F=24.2, d.f.=14,
P=0.0003; Fig.·3B). The lowest speeds that could be maintained using an unsteady gait ranged from 81.4 to 122.9·cm·s–1 and were positively correlated to fork length (F=15.7, d.f.=14, P=0.0016; Fig.·3B).
Analysis of videotapes established that smallmouth bass that used a steady locomotory gait as they moved past the observation window maintained a mean ground speed of ~20·cm·s–1(Fig.·3C). Fish that were observed to use a mixture of gaits moved significantly faster. Those individuals that exclusively used an unsteady gait swam at ~40·cm·s–1relative to the ground, which was significantly faster than the other groups (Fig.·3C). The light-gate sensor array in the raceway was active during all ascents that were videotaped, which allowed mean ground speeds calculated using the different approaches to be compared. Mean ground speeds for individuals that were observed using a steady, mixed or unsteady gait, calculated from the light-gate interval that spanned the observation window, were not significantly different from those generated through analysis of the videotapes (Fig.·3C). This indicates that light-gate and videotape data can be used interchangeably to calculate swimming speed and that relationship between fish length, gait use and speed (Fig.·3B) is constant regardless of how the latter is calculated. In addition, mean ground speeds for individuals that were observed using a steady, mixed or unsteady gait, calculated from the light-gate interval that spanned the entire raceway, were not significantly different from those generated from the videotapes or from the light-gate interval that encompassed the observation window (Fig.·3C). This indicates that fish were not altering their ground speed at the observation window relative to the rest of the raceway, and the relationship
between swimming speed, fish length and gait use established from the videotapes (Fig.·3B) can be used to predict unobserved gait use in the raceway.
All smallmouth bass that were exposed to water velocities of 30·cm·s–1or less swam at mean speeds that fell within the steady locomotory zone (Fig.·3D). Mean ground speeds of these individuals were approximately 20–25·cm·s–1, and mean passage times were ~2·min (Fig.·3D). Most smallmouth bass faced with water moving at 40·cm·s–1 also swam at speeds within the steady zone; however, a small percentage exceeded the upper boundary for steady swimming, suggesting that these ascents included some unsteady activity. Steady swimming also dominated during ascents against water moving at 50·cm·s–1; however, proportionally more fish exceeded the upper boundary for steady swimming, and some swam at speeds that fell within the unsteady zone (Fig.·3D). Smallmouth bass faced with water moving at 60 and 70·cm·s–1 swam at speeds within the steady, transitional and unsteady zones; however, most ascent speeds fell within the latter. At 80·cm·s–1, fish swam at speeds in the transitional and unsteady zones, and the latter continued to predominate. Finally, all smallmouth bass swam at speeds supported exclusively by an unsteady gait when water velocities were set at 90·cm·s–1 (Fig.·3D).
Mean ground speeds that were primarily made up of ascents supported exclusively by unsteady swimming were significantly higher than those dominated by ascents involving only steady swimming (Fig.·3D). This resulted in a steady, significant decline in mean passage time.
Post-exercise physiology experiments
[image:8.612.43.561.513.708.2]Mean fork length of all smallmouth bass used in the
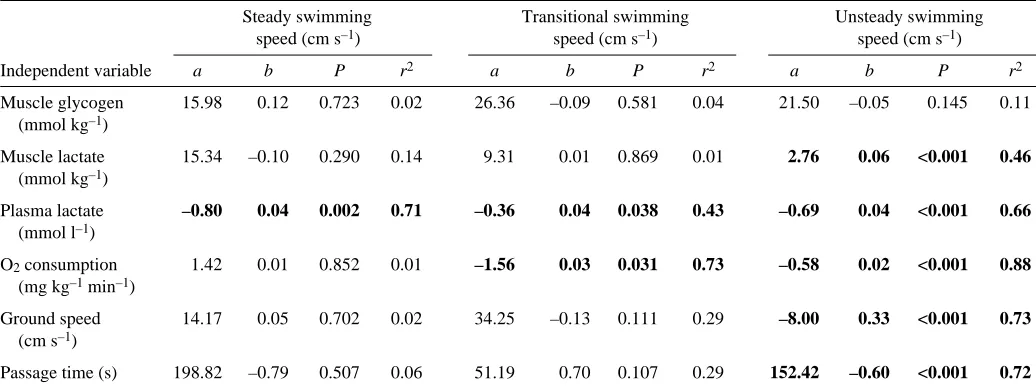
Table 2. Intercepts (a), slopes (b) and statistics related to linear (i.e. y=a+bx) correlations between swimming speed (x) and ground speed, passage time and post-exercise muscle glycogen, muscle lactate, plasma lactate and oxygen consumption (y) for
fish that swam in the steady, transitional and unsteady zones
Steady swimming Transitional swimming Unsteady swimming speed (cm·s–1) speed (cm·s–1) speed (cm·s–1)
Independent variable a b P r2 a b P r2 a b P r2
Muscle glycogen 15.98 0.12 0.723 0.02 26.36 –0.09 0.581 0.04 21.50 –0.05 0.145 0.11 (mmol·kg–1)
Muscle lactate 15.34 –0.10 0.290 0.14 9.31 0.01 0.869 0.01 2.76 0.06 <0.001 0.46 (mmol·kg–1)
Plasma lactate –0.80 0.04 0.002 0.71 –0.36 0.04 0.038 0.43 –0.69 0.04 <0.001 0.66 (mmol·l–1)
O2consumption 1.42 0.01 0.852 0.01 –1.56 0.03 0.031 0.73 –0.58 0.02 <0.001 0.88 (mg·kg–1min–1)
Ground speed 14.17 0.05 0.702 0.02 34.25 –0.13 0.111 0.29 –8.00 0.33 <0.001 0.73 (cm·s–1)
Passage time (s) 198.82 –0.79 0.507 0.06 51.19 0.70 0.107 0.29 152.42 –0.60 <0.001 0.72
physiology experiments was 32.0·cm (Table·1). Substitution of this value into the upper boundary of steady swimming regression (Fig.·3B) revealed that the steady zone for these fish extended to 77.5·cm·s–1, which indicates that fish that maintained mean speeds lower than 77.5·cm·s–1 did so exclusively using a steady swimming gait. Similarly, substitution into the lower boundary of unsteady swimming regression (Fig.·3B) indicates that the unsteady zone for these fish began at a swimming speed of 103.8·cm·s–1 and that higher speeds were supported exclusively by an unsteady locomotory gait. Thus, the transitional zone extended from 77.5 to 103.8·cm·s–1 (by subtraction) and was supported through recruitment of a mixture of steady and unsteady swimming.
A total of 10 smallmouth bass in the physiology experiments swam at mean speeds within the steady zone (range: 52.0–77.5·cm·s–1). During individual ascents, mean ground speed, passage time and swimming speed for individuals in this group were not significantly correlated (Table·2). An additional 10 fish swam at mean speeds that fell within the transitional zone (range: 79.7–103.0·cm·s–1). Again, ground speed, passage time and swimming speed for these fish were not significantly correlated. The remaining 20 individuals swam at unsteady speeds (range: 106.6–170.2·cm·s–1). In this case, however, mean ground speed and passage time significantly increased and decreased, respectively, with mean swimming speed (Table·2).
Mean ground speeds chosen by fish in the physiology experiments, grouped according to the locomotory zone in which they swam, were similar to those demonstrated by fish in the gait experiments. The mean ground speed of individuals
that swam in the transitional zone was significantly higher than that of fish that swam with a steady gait (Fig.·4). In addition, mean ground speed of individuals that swam at speeds in the unsteady zone was significantly higher than that of fish that swam steadily or used a mixture of gaits. Similarly, mean passage time among the groups declined significantly with each shift in locomotory gait (Fig.·4).
Among the 10 smallmouth bass that swam at speeds within the steady zone, post-exercise plasma lactate increased significantly with mean swimming speed (Table·2). By contrast, post-exercise muscle glycogen, muscle lactate and oxygen consumption were not significantly correlated to mean swimming speed during steady activity. For smallmouth bass that swam at speeds within the transitional zone, post-exercise plasma lactate and oxygen consumption increased significantly with mean swimming speed, while no such correlations were found for muscle glycogen or lactate (Table·2). For individuals that swam at speeds within the unsteady zone, post-exercise muscle lactate, plasma lactate and oxygen consumption increased significantly with mean swimming speed. Muscle glycogen and swimming speed within this group were not significantly correlated (Table·2).
Mean post-exercise muscle glycogen levels decreased consistently among the groups of smallmouth bass that swam at steady, transitional and unsteady speeds in the raceway; however; statistical significance was only found between the steady and unsteady groups (Fig.·5A). Mean muscle glycogen in smallmouth bass exercised aerobically in the respirometer was significantly lower than the mean level for fish that swam in the raceway using a steady gait but was not significantly different from raceway fish that swam using mixed or unsteady gaits. Finally, mean muscle glycogen in smallmouth bass that were chased to exhaustion was significantly lower than mean levels in all other groups (Fig.·5A).
Smallmouth bass that swam in the steady or transitional zone showed mean muscle lactate concentrations that were not significantly different, either from each other, or from the mean level in aerobically exercised individuals (Fig.·5B). By contrast, smallmouth bass that used an unsteady gait in the raceway demonstrated a significantly elevated mean muscle lactate concentration relative to the steady and transitional groups but not the aerobically exercised fish. Chasing smallmouth bass to exhaustion resulted in a mean muscle lactate concentration that was more than twice that of any other group (Fig.·5B).
Mean plasma lactate concentration in fish that used a steady gait in the raceway was significantly lower than that in all other groups except for fish that were exposed to aerobic swimming in the respirometer (Fig.·5C). Mean plasma lactate concentration in fish that used a mixture of gaits in the raceway was significantly higher than in steady swimming fish and lower than that in all other groups except aerobically exercised fish. Mean plasma lactate in smallmouth bass that swam at speeds that fell within the unsteady zone was significantly higher than that in all other groups, except for individuals that were chased to exhaustion. Mean plasma lactate concentration Fig.·4. Mean ground speeds (vertical bars) and passage times (black
circles) for smallmouth bass in the physiology experiments that swam at mean speeds that fell within the steady, transitional or unsteady zone. Significant differences in mean ground speed and passage time are indicated by differing lowercase and uppercase
letters, respectively. Positive and negative error bars indicate S.E.M.
and S.D., respectively.
Locomotory zone
Steady Transitional Unsteady
M
ea
n
g
ro
u
n
d
s
p
ee
d
(
cm
s
–1
)
0 10 20 30 40 50 60 70
M
ea
n
p
ass
ag
e t
ime
(s
)
25 50 75 100 125 150 175 200 Ground speed Passage time
a
b
c A
B
in chased fish was significantly higher than in all other groups (Fig.·5C).
Mean oxygen consumption rates during a 30-min period post-exercise ranged from 1.0 to 3.9·mg·O2·kg–1·min–1 in aerobically exercised and exhausted groups, respectively (Fig.·5D). The lower mean oxygen consumption rate was comparable to the lowest minute-to-minute value found in this study; however, the highest recorded minute-to-minute rate was 6.5·mg·O2·kg–1·min–1, indicating that oxygen consumption was never maintained at the active rate throughout the 30-min recovery period, even after exhaustive exercise. Mean oxygen consumption rate did not differ significantly among aerobically exercised fish and individuals that ascended the raceway using steady or mixed gaits (Fig.·5D). However, smallmouth bass chased to exhaustion and those that used exclusive unsteady swimming in the raceway showed significantly higher mean EPOC rates than the other groups, and the former was significantly higher than the latter.
Discussion
Steady swimming in fish is supported by red muscle fibres, which are powered primarily by energy supplied through oxidative metabolic pathways (Johnson et al., 1994; Coughlin and Rome, 1996; Jayne and Lauder, 1996; Altringham and Ellerby, 1999). Based on this information alone, it can be argued that all swimming speeds in the present study that fell within the steady zone were powered by energy derived strictly from aerobic metabolism. Furthermore, it is apparent that the highest speeds demonstrated within the steady zone (59.1–91.3·cm·s–1) represent maximum aerobic (i.e. sustained) speed for this species. This contention is supported by the findings of Bunt et al. (1999), who reported that critical swimming speed (an estimate of maximum sustained swimming capacity) of smallmouth bass similar in length to those in the present study ranged from 63 to 85·cm·s–1. As such, we suggest that the swimming velocity at which a fish transitions away from an exclusive steady swimming gait is a reasonable indicator of maximum sustained speed, as
A
Steady Trans Unsteady Aerobic Exhausted
Steady Trans Unsteady Aerobic Exhausted Steady Trans Unsteady Aerobic Exhausted
Steady Trans Unsteady Aerobic Exhausted
M
u
sc
le
gl
y
co
g
en
(mm
o
l kg
–1
)
P
la
sm
a l
ac
tate
(mm
o
l l
–1
)
O
x
y
g
en
co
ns
u
m
p
tio
n
(mg kg
–1
m
in
–1)
M
u
sc
le
l
ac
tate
(mm
o
l kg
–1)
0 5 10 15 20 25 30 35
a
a,b
b b
c
0 2 4 6 8 10 12 14 16
d
c
a
b a,b
C
a,b
a a
b
c
0 5 10 15 20 25 30 35 40
0 1 2 3 4 5
a
b
a a
c
B
D
Fig.·5. Mean post-exercise muscle glycogen (A), muscle lactate (B), plasma lactate (C) and oxygen consumption (D) values for smallmouth bass that swam at mean speeds in the steady, transitional or unsteady zones, and for groups exercised aerobically in the respirometer or chased
to exhaustion. Significant differences are indicated by differing lowercase letters. Positive and negative error bars indicate S.E.M. and S.D.,
originally proposed by Drucker (1996), and is probably easier to measure than critical swimming speed.
This study is among the first to demonstrate that a strong link exists between exercise physiology and behaviour in fish and that individuals may use different behavioural strategies when faced with various locomotory challenges. For example, during ascents that predominately involved steady swimming, fish actively altered their swimming speed to maintain a ground speed that resulted in a passage time of approximately 120–150·s (Fig.·3D). Furthermore, when smallmouth bass were faced with increasing water velocities in the raceway, they made little effort to reduce instantaneous energy requirements by allowing ground speed (and therefore swimming speed) to decline, nor did they attempt to reduce passage time by increasing ground speed even though they would have been unaware of how long the activity would need to be maintained. As endurance during aerobic activity is not limited by fuel supply (at least on a scale of hours to days; Beamish, 1978), we suggest that the failure of smallmouth bass to trade exercise intensity for duration (or vice versa) when moving at speeds within the steady zone indicates that this activity was primarily aerobic in nature.
The transition from steady to unsteady swimming marks the onset of contractile activity in the white, anaerobically fuelled, axial muscle (Johnson et al., 1994; Wilson and Eggington, 1994). Although there is evidence that swimming speeds in excess of maximum sustained can be maintained for long periods (Hudson, 1973), it has not yet been clearly established whether or not the axial muscle has a limited aerobic capacity or whether the tissue can maintain a steady state by clearing anaerobic metabolites as they are produced. In any case, video analysis of fine-scale movements suggest that smallmouth bass were unable (or unwilling) to move at transitional speeds through exclusive use of an unsteady gait. It may be that the relatively low tail beat frequencies required to maintain these swimming speeds would have resulted in values of V/Vmax that were too low for efficient power generation in the white muscle (Rome et al., 1990). This, however, does not mean that fish were unable to move at intermediate speeds on a larger scale. Indeed, 10 of the 40 individuals tested in the physiology experiments demonstrated mean swimming speeds that fell within the transitional zone (Fig.·4). It is clear that these swimming speeds were attained through the use of a mixture of steady and unsteady swimming, with more of the latter being recruited to support activity of higher intensity.
As an unsteady locomotory gait was being used to partially support ascents at transitional speeds, it is reasonable to conclude that fish were recruiting white muscle, and probably anaerobic metabolism, during this activity. Although it is tempting to ascribe the consistent increase in ground speed associated with transitional zone ascents (Figs·3C,D,·4) to a behavioural strategy aimed at reducing passage time, it is more likely that this phenomenon was mechanistic in nature. Minimum unsteady swimming speeds were invariably higher than maximum steady values (Fig.·3B). Thus, it is likely that
the incorporation of unsteady swimming into a particular ascent necessarily increased mean swimming speed and therefore mean ground speed. This would suggest that fuel depletion and/or metabolite accumulation were probably not an immediate concern for fish moving at swimming speeds within the transitional zone and that any disturbances resulting from anaerobic metabolism were small in overall magnitude.
Smallmouth bass in the present study also demonstrated a size-dependent range of minimum unsteady swimming velocities (89.4–114.6·cm·s–1; Fig.·3B). Complete transition to this locomotory gait occurred when water speeds reached 90·cm·s–1 (Fig.·3D), probably because any steady swimming against water moving at this rate would have resulted in a negative ground speed. Ground speeds demonstrated by fish swimming in the unsteady zone were remarkably high (Figs·3C,D,·4), a phenomenon that cannot be adequately explained from a purely mechanistic perspective. The resulting drop in passage time suggests that smallmouth bass, for the first time, were actively trading exercise intensity for duration, probably in an attempt to conserve limited anaerobic fuel stores and/or mitigate physiological disturbances associated with anaerobic metabolism. While this behaviour suggests that unsteady swimming was fuelled primarily by anaerobic processes, the magnitude of the ground speeds (occasionally as high as 70·cm·s–1) was somewhat surprising given that power requirements for locomotion increase exponentially with exercise intensity (Webb, 1998). It is clear that smallmouth bass, when faced with high water velocities (>100·cm·s–1) in the raceway, were willing to pay a heavy energetic cost, and presumably incur a considerable oxygen debt, in an attempt to minimize exercise duration. It is also interesting to note that swimming speeds that require exclusive recruitment of an unsteady gait are thought to be very short-lived and only maintainable for 10–20·s (Beamish, 1978). However, smallmouth bass in the present study used an unsteady gait to attain remarkable swimming speeds (often in excess of 180·cm·s–1) and were able to maintain those speeds for at least 50–70·s (Fig.·4), and possibly more had the raceway been longer. Clearly, additional research on the relationship between exercise intensity and endurance at swimming speeds in the unsteady zone is warranted.
activities that can obfuscate physiological responses in terminally sampled fish (Wang et al., 1994).
Our contention that steady swimming in the present study was aerobic in nature is also supported by the lack of a relationship between mean swimming speed and muscle glycogen levels, and between mean swimming speed and muscle lactate concentrations, for individual fish that ascended the raceway at speeds that fell within the steady zone (Table·2). However, we were surprised that mean muscle glycogen in steady swimming individuals was significantly higher than that of fish aerobically exercised in the respirometer (Fig.·5A). This anomaly may have been related to different stress levels among these treatment groups. Fish tested in the raceway were acclimated in submerged holding wells that were opaque and completely dark, while those acclimated in the respirometer were exposed to small amounts of ambient (but not direct) sunlight. Carmichael et al. (1984) reported that largemouth bass (Micropterus salmoides) did not become stressed (i.e. hyperglycaemic) when net-confined in the dark, while those tested under lighted conditions showed elevated plasma glucose levels consistent with stress. In addition, it has recently been demonstrated that glycogen re-synthesis and lactate clearance following anaerobic activity can be altered or delayed in fish that are stressed (Milligan et al., 2000). Thus, it may be that smallmouth bass in the present study metabolized glycogen during the struggling associated with capture and placement in the respirometer and that chronic stress from confinement in the light interfered with processes related to glycogen repletion.
We were also surprised to find that the relationship between muscle glycogen depletion and lactate accumulation was closer to 1:1 rather than the expected 1:2. However, others have reported similar findings. For example, Scarabello et al. (1991) found a 1:1 ratio of glycogen depletion to lactate accumulation in rainbow trout (Oncorhynchus mykiss). The authors hypothesized that fish were using glycogen as an aerobic fuel in addition to an anaerobic one. More recently, Richards et al. (2002) reported a near 1:1 relationship in rainbow trout and suggested that lactate generated in the white muscle might have been used as an oxidative fuel source in the working red muscle. If this was occurring in the present study, it would also help to explain the positive relationship found between mean steady swimming speed and plasma lactate levels (Table·2), a correlation that contradicts most of the other behavioural and physiological data indicating that steady swimming was aerobic in nature. Lactate generated during handling may have been released by the muscle, in amounts relative to exercise intensity, to serve as an aerobic fuel for the red muscle and/or cardiovascular system (Bilinski and Jonas, 1972; Milligan and Farrell, 1991), and not produced as a result of the swimming activity itself.
Based on gait transition and ground speed dynamics alone, we could only speculate that anaerobically derived energy was being used by smallmouth bass to fuel the unsteady portions of ascents associated with speeds that fell within the transitional zone. Physiological evidence to support this
speculation is limited, as no significant differences were found among mean values for muscle glycogen, muscle lactate or oxygen consumption, as measured in fish that used steady vs mixed locomotory gaits (Fig.·5A,B,D). On the other hand, mean plasma lactate levels were significantly greater in fish that swam at transitional vs steady speeds (Fig.·5C). In addition, there are general trends in the data that are suggestive of glycolytic activity. For example, mean plasma lactate (Fig.·5C) and mean oxygen consumption rate (Fig.·5D) tended to increase, and mean muscle glycogen concentrations tended to decrease (Fig.·5A), as fish began to incorporate an unsteady gait into their raceway ascents. In addition, plasma lactate values for fish that swam at speeds in the transitional zone continued to be positively correlated to swimming speed, and post-ascent oxygen consumption in the same individuals began to increase significantly with exercise intensity (Table·2). Thus, it appears that the unsteady portions of these ascents were supported by small amounts of anaerobically derived energy. However, a longer raceway would be needed to determine whether or not fuel depletion and/or metabolite accumulation would have eventually limited performance.
All physiological indices measured in this study support our earlier contention that unsteady swimming in the raceway was supported by energy derived from glycolytic metabolic pathways. Relative to steady swimming fish, individuals that moved at speeds in the unsteady zone showed significantly lower mean muscle glycogen, and higher mean muscle lactate, plasma lactate and post-ascent oxygen consumption rate (Fig.·5). In addition, muscle lactate, plasma lactate and oxygen consumption all scaled positively with mean swimming speed for individual fish that used an unsteady gait in the raceway (Table·2). The question that remains, however, relates to the relative effectiveness of the strategy employed by smallmouth bass faced with high water velocities in the raceway, by which exercise duration was dramatically reduced by increasing ground speed. Our answer to this question is that the strategy appears to have been remarkably effective. Mean metabolite concentrations in fish that swam at high, unsteady speeds to cover the 25·m distance in approximately 60·s were only marginally different from those of individuals that moved at more moderate swimming speeds for roughly twice as long (Fig.·5). It is also worth noting that the post-exercise physiological dynamics of fish that moved at speeds in the unsteady zone were, in most cases, closer to those demonstrated by individuals that were exercised aerobically in the respirometer than to those of fish chased to exhaustion (Fig.·5).
a mixture of gaits probably had an (albeit minor) anaerobic component. Smallmouth bass actively adjusted their swimming speed to maintain mean ground speeds of approximately 20·cm·s–1 during steady swimming and 40·cm·s–1during unsteady locomotion. We suggest that part of this increase was mechanistic and related to the need for fish to swim at speeds that optimized efficiency in the white muscle; however, it is also clear that individuals were actively trading exercise intensity for duration, a behavioural strategy that was likely aimed at conserving anaerobic fuel supplies and reducing post-exercise oxygen debt. Given this, an obvious implication of this study is that performance and physiological data collected from fish tested in small laboratory swim tunnel respirometers may not be applicable to free-swimming individuals, given that the devices (1) do not allow fish to attain a positive ground speed and (2) may interfere with normal gait transition dynamics. This issue, however, awaits a detailed and quantitative comparison of the locomotory physiology and behaviour of confined and free-swimming fish.
This project was made possible through a grant to S.J.P. from the Manitoba Hydro R&D Committee. Thanks to Roy Bukowsky, Dennis Windsor, Phillip Wang, Marno Klein, Cory Ruhlen, Dennis Smith and Jeff Long for administrative and technical assistance. Initial funding was matched by an N.S.E.R.C. Collaborative Research and Development Grant to Dr B. A. McKeown, with additional contributions coming from an N.S.E.R.C. Discovery Grant (to A.P.F.), Manitoba Conservation, Manitoba Department of Highways, the Town of Pinawa and the Deep River Science Academy. The following scholarships were provided (to S.J.P.): an N.S.E.R.C. Post-Graduate Scholarship, two Simon Fraser University Post-Graduate Fellowships, an Abbott/Frettwell Scholarship and an Anne Vallee Scholarship. Access to analytical equipment was kindly provided by Dr W. Parkhouse.
References
Altringham, J. D. and Ellerby, D. J. (1999). Fish swimming: patterns in
muscle function. J. Exp. Biol. 202, 3397-3403.
Beamish, F. W. H. (1978). Swimming capacity. In Fish Physiology, vol. 7 (ed.
W. S. Hoar and D. J. Randall), pp. 101-187. New York: Academic Press.
Bilinski, E. and Jonas, R. E. E. (1972). Oxidation of lactate to carbon dioxide
by rainbow trout Salmo gairdneri tissues. J. Fish. Res. Bd. Can. 29, 1467-1471.
Bunt, C. M., Katopodis, C. and McKinley, R. S. (1999). Attraction and
passage efficiency of white suckers and smallmouth bass by two Denil fishways. N. Am. J. Fish. Man. 19, 793-803.
Carmichael, G. J., Tomasso, J. R., Simco, B. A. and Davis, K. B. (1984).
Confinement and water quality-induced stress in largemouth bass. Trans. Am. Fish. Soc. 113, 767-777.
Coughlin, D. J. and Rome, L. C. (1996). The roles of pink and red muscle
in powering steady swimming in scup, Stenotomus chrysops. Am. Zool. 36, 666-677.
Day, N. and Butler, P. J. (1996). Environmental acidity and white muscle
recruitment during swimming in the brown trout Salmo trutta. J. Exp. Biol.
199, 1947-1959.
Drucker, E. G. (1996). The use of gait transition speed in comparative studies
of fish locomotion. Am. Zool. 36, 555-566.
Farrell, A. P., Gallaugher, P., Clarke, C., Delury, N., Kreiberg, H., Parkhouse, W. and Routledge, R. (2000). Physiological status of coho
salmon Oncorhynchus kisutch captured in commercial nonretention fisheries. Can. J. Fish. Aquat. Sci. 57, 1668-1678.
Hudson, R. C. L. (1973). On the function of the white muscle in teleosts at
intermediate swimming speeds. J. Exp. Biol. 58, 509-522.
Jayne, B. C. and Lauder, G. V. (1996). New data on axial locomotion in
fishes: how speed affects diversity of kinematics and motor patterns. Am. Zool. 36, 642-655.
Johnson, T. P., Syme, D. A., Jayne, B. C., Lauder, G. V. and Bennett, A. F. (1994). Modeling red muscle power output during steady and unsteady
swimming in largemouth bass. Am. J. Physiol. 267, R481-R488.
Kieffer, J. D., Alsop, D. and Wood, C. M. (1998). A respirometric analysis
of fuel use during aerobic swimming at different temperatures in rainbow trout Oncorhynchus mykiss. J. Exp. Biol. 201, 3123-3133.
Milligan, C. L. (1996). Metabolic recovery from exhaustive exercise in
rainbow trout. Comp. Biochem. Physiol. A 113, 51-60.
Milligan, C. L. and Farrell, A. P. (1991). Lactate utilization by an in situ
perfused trout heart: effects of workload and blockers of lactate transport. J. Exp. Biol. 155, 357-373.
Milligan, C. L. and Girard, S. S. (1993). Lactate metabolism in rainbow
trout. J. Exp. Biol. 180, 175-193.
Milligan, C. L., Hooke, G. B. and Johnson, C. (2000). Sustained swimming
at low velocity following a bout of exhaustive exercise enhances metabolic recovery in rainbow trout. J. Exp. Biol. 203, 921-926.
Moon, T. W. and Johnston, I. A. (1980). Starvation and the activities of
glycolytic and gluconeogenic enzymes in skeletal muscles and liver of plaice Pleuronectes platessa. J. Comp. Physiol. B 136, 31-38.
Moyes, C. D. and West, T. G. (1995). Exercise metabolism of fish. In
Biochemistry and Molecular Biology of Fishes, vol. 4 (ed. P. W. Hochachka and T. P. Mommsen), pp. 367-392. Amsterdam: Elsevier Science.
Plaut, I. (2001). Critical swimming speed: its ecological relevance. Comp.
Biochem. Physiol. A 131, 41-50.
Richards, J. G., Mercado, A. J., Clayton, C. A., Heigenhauser, G. J. F. and Wood, C. M. (2002). Substrate utilization during graded aerobic
exercise in rainbow trout. J. Exp. Biol. 205, 2067-2077.
Rome, L. C., Funke, R. P. and Alexander, R. M. (1990). The influence of
temperature on muscle velocity and sustained performance in swimming carp. J. Exp. Biol. 154, 163-178.
Scarabello, M., Wood, C. M. and Heigenhauser, G. J. F. (1991). Glycogen
depletion in juvenile rainbow trout as an experimental test of the oxygen debt hypothesis. Can. J. Zool. 69, 2562-2568.
Wang, Y., Wilkie, M. P., Heigenhauser, G. J. F. and Wood, C. M.
(1994). The analysis of metabolites in rainbow trout white muscle: a comparison of different sampling and processing methods. J. Fish Biol.
45, 855-873.
Webb, P. W. (1998). Swimming. In Physiology of Fishes (ed. D. H. Evans).
Boca Raton, FL: CRC Press.
Weber, J.-M. and Haman, F. (1996). Pathways for metabolic fuels and
oxygen in high performance fish. Comp. Biochem. Physiol. A 113, 33-38.
Wilkie, M. P., Davidson, K., Brobbel, M. A., Kieffer, J. D., Booth, R. K., Bielak, A. T. and Tufts, B. L. (1996). Physiology and survival of wild
Atlantic salmon following angling in warm summer waters. Trans. Am. Fish. Soc. 125, 572-580.
Wilson, R. W. and Eggington, S. (1994). Assessment of maximum