Proceedings of the 2nd Workshop on Computational Approaches to Subjectivity and Sentiment Analysis, ACL-HLT 2011, pages 87–95,
Improving a Method for Quantifying Readers’ Impressions of News Articles
with a Regression Equation
Tadahiko Kumamoto Chiba Institute of Technology 2-17-1, Tsudanuma, Narashino,
Chiba 275-0016, Japan [email protected]
Yukiko Kawai Kyoto Sangyo University
Motoyama, Kamigamo, Kita-Ku, Kyoto 603-8555,
Japan
Katsumi Tanaka Kyoto University Yoshida-Honmachi, Sakyo-Ku, Kyoto 606-8501,
Japan
Abstract
In this paper, we focus on the impressions that people gain from reading articles in Japanese newspapers, and we propose a method for extracting and quantifying these impressions in real numbers. The target impressions are limited to those represented by three bipo-lar scales, “Happy – Sad,” “Glad – Angry,” and “Peaceful – Strained,” and the strength of each impression is computed as a real num-ber between 1 and 7. First, we implement a method for computing impression values of articles using an impression lexicon. This lexicon represents a correlation between the words appearing in articles and the influence of these words on the readers’ impressions, and is created from a newspaper database us-ing a word co-occurrence based method. We considered that some gaps would occur be-tween values computed by such an unsuper-vised method and those judged by the readers, and we conducted experiments with 900 sub-jects to identify what gaps actually occurred. Consequently, we propose a new approach that uses regression equations to correct im-pression values computed by the method. Our investigation shows that accuracy is improved by a range of 23.2% to 42.7% by using regres-sion equations.
1 Introduction
In recent years, many researchers have been at-tempting to model the role of emotion in interac-tions between people or between people and com-puters, and to establish how to make computers rec-ognize and express emotions (Picard, 1997;
Mas-saro, 1998; Bartneck, 2001). However, there have not been many studies that have extracted the im-pressions that people form after seeing or listening to text and multimedia content. For multimedia con-tent such as music and images, several impression-based retrieval methods have been proposed for lo-cating paintings and pieces of music that convey im-pressions similar to those registered by users (Sato et al., 2000; Kumamoto, 2005; Takayama et al., 2005). By comparison, there are only a few studies that have extracted the readers’ impressions gained from text such as news articles, novels, and poems (Kiyoki et al., 1994; Kumamoto and Tanaka, 2005; Lin et al., 2008).
In this paper, we focus on the impressions that people gain from reading articles in Japanese news-papers, and we propose a method for extracting and quantifying these impressions in real numbers. The target impressions are limited to those represented by three bipolar scales, “Happy – Sad,” “Glad – An-gry,” and “Peaceful – Strained,” and the strength of each impression is computed as a real number between 1 and 7 denoting a position on the corre-sponding scale. Then, interpretation of the position is grounded based on a seven-point scale. For exam-ple, on the scale “Happy – Sad,” the score 1 equals “Happy,” the middle score 4 denotes “Neither happy nor sad,” and the score 7 equals “Sad.” If the impres-sion value of an article is 2.5, then the average reader will experience an intermediate impression between “Comparatively happy (2)” and “A little happy (3)” from reading the article.
First, we assumed that words causing a certain im-pression from articles co-occur often with
sion words that express that impression, and do not co-occur very often with impression words that ex-press the opposite imex-pression. Proceeding with this assumption, we implemented a method for analyz-ing co-occurrence relationships between words in every article extracted from a newspaper database. We then created an impression lexicon. This lexicon represents a correlation between the words appear-ing in articles and the influence of these words on the readers’ impressions. We then implemented a method that computes impression values of articles using the lexicon. We considered that some gaps occur between values computed by such an unsu-pervised method and those judged by the readers, and we conducted experiments with 900 subjects to identify what gaps actually occurred. In these exper-iments, each subject read ten news articles and esti-mated her/his impressions of each article using the three bipolar scales. Thereafter, for each scale, we drew a scatter diagram to identify the potential cor-respondence relationships between the values com-puted by the method and those judged by the sub-jects. As a result, we found that the correspondence relationships could be approximately represented by cubic and quintic regression equations. We, there-fore, propose a new approach that uses regression equations to correct impression values computed by the method.
The rest of this paper is organized as follows. In Section 2, we present related work. In Section 3, we present the design of the three bipolar scales, a method for the automated construction of an sion lexicon, and a method for computing impres-sion values of articles using this lexicon. In Section 4, we analyze the correspondence relationships be-tween values computed using the lexicon and those judged by the readers, and based on the results of this analysis, we propose a method of using regres-sion equations to correct impresregres-sion values com-puted using the lexicon. In Section 5, we investi-gate how far accuracy can be improved by using the regression equations. Finally, in Section 6, we con-clude the paper.
2 Related Work
There are many studies that identify information givers’ emotions from some sort of information that
they have transmitted (Cowie et al., 2001; Forbes-Riley and Litman, 2004; Kleinsmith and Bianchi-Berthouze, 2007). On the other hand, there are only a few studies that have extracted the impressions which information receivers gain from the text that they have received (Kiyoki et al., 1994; Kumamoto and Tanaka, 2005; Lin et al., 2008).
Kiyoki et al. (1994) have proposed a mathemat-ical model of meanings, and this model allows a semantic relation to be established between words according to a given context. Their method uses a mathematical model and creates a semantic space for selecting the impression words that appropriately express impressions of text according to a given con-text. In other words, this method does not quantify impressions of text, but just selects one or more im-pression words expressing the imim-pressions. Thus, their aim differs from ours.
Lin et al. (2008) have proposed a method for clas-sifying news articles into emotion categories from the reader’s perspective. They have adopted a ma-chine learning approach to build a classifier for the method. That is, they obtained Chinese news ar-ticles from a specific news site on the web which allows a user to cast a vote for one of eight emo-tions, “happy,” “sad,” “angry,” “surprising,” “bor-ing,” “heartwarm“bor-ing,” “awesome,” and “useful.” They collected 37,416 news articles along with their voting statistics, and developed a support vector machine-based classifier using 25,975 of them as training data. However, their method just classifies articles into emotion classes and does not quantify the reader’s emotions. Thus, their aim also differs from ours.
calcu-lated based on a co-occurrence relationship between
iandw. Next, the semantic orientation (SO) of the phraseiis obtained by calculating the difference be-tween PMI(i, “excellent”) and PMI(i, “poor”). Fi-nally, SO of the text is determined by averaging the SO of all the phrases. In contrast, Kumamoto et al.’s method quantifies impressions in real num-bers, and it can deal with impressions represented by two bipolar scales, “Sad – Glad” and “Angry – Pleased.” For that purpose, reference words are se-lected for each scale. Since all the reference words are Japanese, Kumamoto et al,’s method extracts readers’ impressions from Japanese articles only. Also, conditional probabilities are used instead of PMI. Since these methods fit our assumption that words causing a certain impression of articles co-occur often with the impression words that express that impression, and do not co-occur very often with impression words that express the opposite impres-sion, we decided to implement a new method based on Kumamoto et al.’s method.
3 Computing impression values of news articles using an impression lexicon
3.1 Determining target impressions
Kumamoto (2010) has designed six bipolar scales suitable for representing impressions of news arti-cles: “Happy – Sad,” “Glad – Angry,” “Interesting – Uninteresting,” “Optimistic – Pessimistic,” “Peace-ful – Strained,” and “Surprising – Common.” First, he conducted nine experiments, in each of which 100 subjects read ten news articles and estimated their impressions on a scale from 1 to 5 for each of 42 impression words. These 42 impression words were manually selected from a Japanese thesaurus (Ohno and Hamanishi, 1986) as words that can ex-press imex-pressions of news articles. Next, factor anal-ysis was applied to the data obtained in the experi-ments, and consequently the 42 words were divided into four groups: negative words, positive words, two words that were “uninteresting” and “common,” and two words that were “surprising” and “unex-pected.” In the meantime, after cluster analysis of the data, the 42 words were divided into ten groups. Based on the results of both analyses, the author cre-ated the six bipolar scales presented above. How-ever, he showed that impressions on the
“Surpris-ing – Common” scale differed greatly among indi-viduals in terms of their perspective. In addition, he insisted that processing according to the back-ground knowledge, interest, and character of indi-viduals was required to deal with the impressions represented by the two scales “Interesting – Unin-teresting” and “Optimistic – Pessimistic.” There-fore, we decided not to use these three scales at the present stage, and adopted the remaining three scales, “Happy – Sad,” “Glad – Angry,” and “Peace-ful – Strained.”
3.2 Constructing an impression lexicon
An impression lexicon plays an important role in computing impressions of news articles. In this pa-per, we describe the implementation of a method for automatically constructing an impression lexicon based on Kumamoto et al.’s method as described ear-lier.
First, while two contrasting reference words are used for each scale in their method, two contrasting sets, each consisting of multiple reference words, are used in this paper.
Next, let the set of reference words which ex-presses an impression at the left of a scale beSL,
and let the set of reference words which expresses an impression at the right of the scale beSR.
Arti-cles including one or more reference words inSLor
SRare all extracted from a newspaper database, and
the number of reference words belonging to each set is counted in each article. For this we used the 2002 to 2006 editions of the Yomiuri Newspaper Text Database as the newspaper database. Then, let the articles in each of which the number of refer-ence words belonging toSLis larger than the
num-ber of reference words belonging toSRbeAL, and
let the number of articles inALbeNL. Let the
arti-cles in each of which the number of reference words belonging toSLis smaller than the number of
ref-erence words belonging to SR be AR, and let the
number of articles inARbeNR. Next, all words are
extracted from each ofAL andARexcept for
par-ticles, adnominal words1, and demonstratives, and the document frequency of each word is measured. Then, let the document frequency inALof a wordw
1
Table 1: Specifications of our impression lexicon.
Scales # of entries WL WR
Happy – Sad 387,428 4.90 3.80 Glad – Angry 350,388 4.76 3.82 Peaceful – Strained 324,590 3.91 4.67
beNL(w), and let the document frequency inARof
a wordwbeNR(w). The revised conditional
prob-abilities of a wordware defined as follows.
PL(w) =
NL(w)
NL
, PR(w) =
NR(w)
NR
These formula are slightly different from the condi-tional probabilities used in their method, and only articles that satisfy the assumptions described above are used in order to calculatePL(w)andPR(w).
Finally, the impression valuev(w)of a wordwis calculated using thesePL(w)andPR(w)as follows.
v(w) = PL(w)∗WL
PL(w)∗WL+PR(w)∗WR
WL= log10NL, WR= log10NR
That is, a weighted interior division ratio v(w) of
PL(w) andPR(w)is calculated using these
formu-las, and stored as an impression value of w in the scale “SL–SR” in an impression lexicon. Note that
WLandWRdenote weights, and the largerNLand
NRare, the heavierWLandWRare.
The numbers of entries in the impression lexicon constructed as above are shown in Table 1 together with the values of WL and WR obtained. Further,
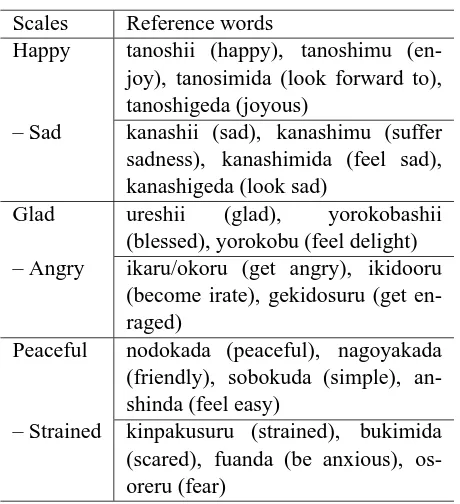
the two contrasting sets of reference words2, which were used in creating the impression lexicon, are enumerated in Table 2 for each scale. These words were determined after a few of trial and error and are based on two criteria, namely (i) it is a verb or adjective that expresses either of two contrasting im-pressions represented by a scale, and (ii) as far as possible, it does not suggest other types of impres-sions.
2
[image:4.612.313.543.97.349.2]These words were translated into English by the authors.
Table 2: Reference words prepared for each scale.
Scales Reference words
Happy tanoshii (happy), tanoshimu (en-joy), tanosimida (look forward to), tanoshigeda (joyous)
– Sad kanashii (sad), kanashimu (suffer sadness), kanashimida (feel sad), kanashigeda (look sad)
Glad ureshii (glad), yorokobashii (blessed), yorokobu (feel delight) – Angry ikaru/okoru (get angry), ikidooru
(become irate), gekidosuru (get en-raged)
Peaceful nodokada (peaceful), nagoyakada (friendly), sobokuda (simple), an-shinda (feel easy)
– Strained kinpakusuru (strained), bukimida (scared), fuanda (be anxious), os-oreru (fear)
3.3 Computing impression values of articles
For each scale, the impression value of an article is calculated as follows. First, the article is seg-mented into words using “Juman” (Kurohashi et al., 1994)3, one of the most powerful Japanese morpho-logical analysis systems, and an impression value for each word is obtained by consulting the impres-sion lexicon constructed as described in 3.2. Sev-enteen rules that we designed are then applied to the Juman output. For example, there is a rule that a phrase of a negative form like “sakujo-shi-nai (do not erase)” should not be divided into a verb “shi (do),” a suffix “nai (not),” and an action noun “sakujo (erasion)” but should be treated as a single verb “sakujo-shi-nai (do-not-erase).” There is also a rule that an assertive phrase such as “hoomuran-da (is a home run)” should not be divided into a cop-ula “da (is)” and a noun “hoomuran (a home run)” but should form a single copula “hoomuran-da (is-a-home-run).” Further, there is a rule that a phrase with a prefix, such as “sai-charenji (re-challenge)” should not be divided into a prefix “sai (re)” and an
3
action noun “charenji (challenge)” but should form a single action noun “sai-charenji (re-challenge).” All the rules are applied to the Juman output in creating an impression lexicon and computing the impression values of news articles. Finally, an average of the impression values obtained for all the words except for particles, adnominal words, and demonstratives is calculated and presented as an impression value of the article.
4 Correcting computed impression values
4.1 Analyzing a correspondence relationship between computed and manually rated values
We considered that some gaps would occur be-tween impression values computed by an unsuper-vised method such as the one we used and those of the readers. We, therefore, conducted experiments in which a total of 900 people participated as sub-jects, and identified what gaps actually occurred.
First, we conducted experiments with 900 sub-jects, and obtained data that described correspon-dence relationships between news articles and im-pressions to be extracted from the articles. That is, the 900 subjects were randomly divided into nine equal groups, each group consisting of 50 males and 50 females, and 90 articles which were selected from the 2002 edition of the Mainichi Newspaper Text Database4 were randomly divided into nine equal parts. Then, each subject was asked to read the ten articles presented in a random order and rate each of them using three seven-point bipolar scales pre-sented in a random order. The scales we used were “Happy – Sad,” “Glad – Angry,” and “Peaceful – Strained,” and the subjects were asked to assess, on a scale of 1 to 7, the intensity of each impression, represented by each scale, from reading a target ar-ticle. For example, on the scale “Happy – Sad,” the score 1 equaled “Happy,” the middle score 4 denoted “Neither happy nor sad,” and the score 7 equaled “Sad.” After the experiments, for each scale, we cal-culated an average of the 100 values rated for every article. We regarded this average as the impression value to be extracted from the article. Note that, in these experiments, we presented only the first
para-4This database is different from the Yomiuri newspaper
database we used in creating an impression lexicon.
graphs of the original news articles to the subjects. This procedure was derived from the fact that people can understand the outline of a news article by just reading the first paragraph of the article, as well as the fact that impressions of an article may change in every paragraph. Development of a method for fol-lowing the change of impressions in an article will be a future project.
Next, impression values for the first paragraphs of the 90 articles were computed by the method we implemented in 3.3, where the first paragraphs were identical to those presented to the subjects in the ex-periments. Note that, according to the definition of our equations, these impression values are close to 1 when impressions on the left of a scale are felt strongly, and are close to 0 when impressions on the right of a scale are felt strongly. We therefore used the following formula and converted the computed value into a value between 1.0 and 7.0.
Converted= (1−Computed)∗6 + 1
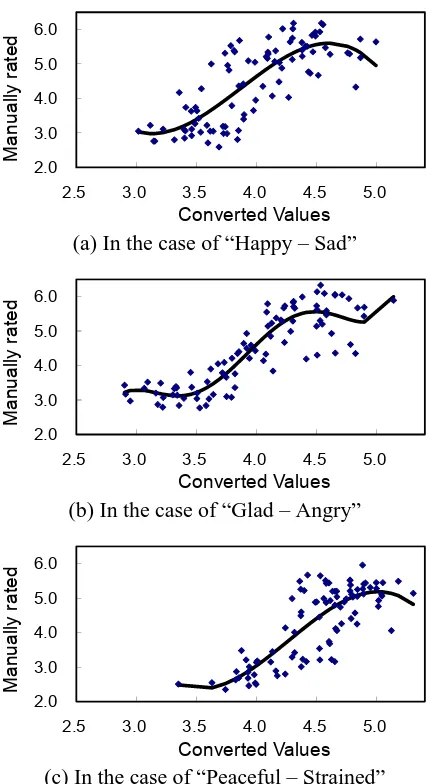
Next, for each scale, we drew a scatter diagram to identify the potential correspondence relationship between these converted values and the averages ob-tained in the experiments, as illustrated in Figure 1. We can see from any of the scatter diagrams that the impression values manually rated by the subjects are positively correlated with those automatically com-puted by the method we implemented. In fact, their coefficients of correlation are 0.76, 0.84, and 0.78 from the case at the top of the figure, which are all high. This not only means that, as an overall trend, the underlying assumption of this paper is satisfied, but also indicates that the correspondence relation-ships can be represented by regression equations.
4.2 Correcting computed impression values with regression equations
2.0 3.0 4.0 5.0 6.0
2.5 3.0 3.5 4.0 4.5 5.0
Converted Values
M
a
n
u
a
lly
r
a
te
d
(a) In the case of “Happy – Sad”
2.0 3.0 4.0 5.0 6.0
2.5 3.0 3.5 4.0 4.5 5.0
Converted Values
M
a
n
u
a
lly
r
a
te
d
(b) In the case of “Glad – Angry”
2.0 3.0 4.0 5.0 6.0
2.5 3.0 3.5 4.0 4.5 5.0
Converted Values
M
a
n
u
a
lly
r
a
te
d
(c) In the case of “Peaceful – Strained”
Figure 1: Scatter diagrams and regression equations.
a trial basis. As a result, the regression equation, which had the highest coefficient of determination, was determined as an optimal function denoting the correspondence relationship between the converted values and the averages in each scale. This means that, for each scale, the impression value of an ar-ticle was more accurately obtained by correcting a value computed by the method we implemented us-ing the correspondus-ing regression equation.
The regression equations obtained here were “−1.636x3+ 18.972x2−70.686x+ 88.515” for the “Happy – Sad,” “2.385x5−46.872x4+363.660x3−
1391.589x2+ 2627.063x−1955.306” for the “Glad
[image:6.612.78.295.67.459.2]– Angry,” and “−1.714x3+ 21.942x2−90.792x+ 124.822” for the “Peaceful –Strained,” and they are
Table 3: Change of the Euclidean distance by using re-gression equations.
Scales DBefore DAfter Rate1
Happy – Sad 0.94 0.67 29.0% Glad – Angry 0.83 0.47 42.7% Peaceful 0.82 0.63 23.2%
– Strained
already illustrated on the corresponding scatter dia-grams in Figure 1. Their coefficients of determina-tion were 0.63, 0.81, 0.64, respectively, which were higher than 0.5 in all scales. This means that the results of regression analysis were good. In addi-tion, we can see from Figure 1 that each regression equation fits the shape of the corresponding scatter diagram.
5 Performance Evaluation
First, we estimated the accuracy of the proposed method for learned data. For that, we used the data obtained in the experiments described in 4.1, and in-vestigated how far gaps between the computed val-ues and the averages of the manually rated valval-ues were reduced by using the regression equations. The results are shown in Table 3. In this table,DBefore
de-notes the Euclidean distance between the computed values without correction and the averages for the 90 articles, and DAfter denotes the Euclidean distance
between the values corrected with the correspond-ing regression equation and the averages for the 90 articles. Then Rate1 was calculated as an improve-ment rate by the following formula:
Rate1= DBefore−DAfter
DBefore ×
[image:6.612.327.524.113.183.2]100
Table 3 shows fairly high improvement rates in all the scales, and hence we find that accuracy is im-proved by using the regression equations. In partic-ular,DAfterfor the scale “Glad – Angry” is less than
Table 4: Comparison with a baseline method.
Scales DBaseline DProposed Rate2
Happy – Sad 0.99 0.67 32.3% Glad – Angry 0.82 0.47 42.7%
Peaceful 1.00 0.63 37.0%
– Strained
distance between the values computed by the base-line method and the averages for the 90 articles, and
DProposed is equivalent to DAfter in Table 3. Then
Rate2 is calculated as an improvement rate by the following formula:
Rate2= DBaseline−DProposed
DBaseline ×
100
Table 4 also shows that fairly high improvement rates were obtained in all the scales. Note that the baseline method was implemented in the following way. First, a pair of reference words was prepared for each scale. Actually, the pair “tanoshii (happy)” and “kanashii (sad)” was used for the scale “Happy – Sad”; the pair “ureshii (glad)” and “ikaru/okoru (get angry)” for the scale “Glad – Angry”; and “nodokada (peaceful)” and “kinpakusuru (strained)” for the scale “Peaceful – Strained.” Next, an impres-sion lexicon for the baseline method was constructed from the news articles which were used to construct our impression lexicon.
The results shown in Tables 3 and 4 prove that the proposed method has a high level of accuracy for the articles used in obtaining the regression equations.
[image:7.612.76.293.101.171.2]As the next step, we estimated the accuracy of the proposed method for unlearned data. For that, we performed five-fold cross-validation using the data obtained in 4.1. First, the data were randomly di-vided into five equal parts, each part consisting of data for 18 articles. Next, a learned data set was cre-ated arbitrarily from four of the five parts, or data for 72 articles, and an unlearned data set was cre-ated from the remaining part, or data for 18 arti-cles. Regression analysis was then applied to the learned data set. As a result, an optimal regres-sion equation that expressed a correspondence rela-tionship between the computed values and the av-erages of the manually rated values in the learned
Table 5: Estimation of overall accuracy based on five-fold cross-validation.
Scales DMean DMax DMin
Happy – Sad 0.69 0.78 0.57 Glad – Angry 0.49 0.58 0.42 Peaceful – Strained 0.64 0.81 0.50
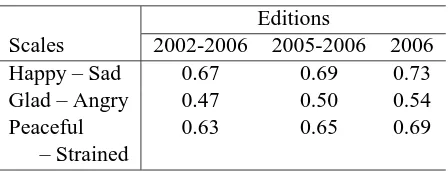
Table 6: Influence of size of target newspaper database to Euclidean distance.
Editions
Scales 2002-2006 2005-2006 2006 Happy – Sad 0.67 0.69 0.73 Glad – Angry 0.47 0.50 0.54
Peaceful 0.63 0.65 0.69
– Strained
data set was obtained for each scale. Next, we cal-culated the Euclidean distance between the averages for 18 articles in the unlearned data set and the val-ues which were computed from the 18 articles them-selves and corrected with the corresponding optimal regression equation. The results are shown in Ta-ble 5. In this taTa-ble, DMean, DMax, and DMin
de-note the mean, maximum, and minimum values of the five Euclidean distances calculated from a total of five unlearned data sets, respectively. Comparing
DProposed in Table 4 andDMean in Table 5, we find
[image:7.612.316.540.226.312.2]becomes smaller. Conversely, this suggests that the accuracy of the proposed method can be improved as the size of newspaper database increases. We would like to verify this suggestion in the near future.
6 Conclusion
This paper has proposed a method for quantitatively identifying the impressions that people gain from reading Japanese news articles. The key element of the proposed method lies in a new approach that uses regression equations to correct impression val-ues computed from news articles by an unsuper-vised method. Our investigation has shown that ac-curacy for learned data is improved by a range of 23.2% to 42.7% by using regression equations, and that accuracy for unlearned data is almost equiva-lent to the accuracy for learned data. Note that, in this paper, the target impressions are limited to those represented by three bipolar scales, “Happy – Sad,” “Glad – Angry,” and “Peaceful – Strained,” and the strength of each impression is computed as a real number between 1 and 7 denoting a position on the corresponding scale.
Our main future work is described below. Since the proposed method uses a word co-occurrence based method to construct an impression lexicon, it may not be effective for other types of scale. We therefore need to examine and consider what kinds of scales are suitable for the proposed method. Per-sonal adaptation is important in methods dealing with impressions created by such artworks as music and paintings. In order to develop a method for more accurately quantifying readers’ impressions of news articles, we will also tackle this personal adaptation problem. Further, we plan to integrate the proposed method into a search engine, a recommendation sys-tem, and an electronic book reader, and to verify the effectiveness of readers’ impressions of news arti-cles in creating a ranking index for information re-trieval and recommendation, or in determining the type of emotional speech used in reading an e-paper.
Acknowledgments
A part of this work was sponsored by National In-stitute of Information and Communications Tech-nology (NICT), Japan, and was achieved under the project named “Evaluating Credibility of Web
Infor-mation.”
References
Christoph Bartneck. 2001. How convincing is Mr. Data’s smile: Affective expressions of machines. User
Mod-eling and User-Adapted Interaction, 11:279–295.
R. Cowie, E. Douglas-Cowie, N. Tsapatsoulis, G. Votsis, S. Kollias, W. Fellenz, and J. G. Taylor. 2001. Emo-tion recogniEmo-tion in human-computer interacEmo-tion. IEEE
Signal Processing Magazine, 18:32–80.
Kate Forbes-Riley and Diane J. Litman. 2004. Predict-ing emotion in spoken dialogue from multiple knowl-edge sources. In Proc. of Human Language
Technol-ogy Conf. of the NAACL, pages 201–208.
Tamio Kan. 2000. Multivariate Statistical Analysis.
Gendai-Sugakusha, Kyoto, Japan.
Yasushi Kiyoki, Takashi Kitagawa, and Takanari Hayama. 1994. A metadatabase system for seman-tic image search by a mathemaseman-tical model of meaning.
SIGMOD Rec., 23:34–41.
Andrea Kleinsmith and Nadia Bianchi-Berthouze. 2007. Recognizing affective dimensions from body posture. In Proc. of the Int. Conf. on Affective Computing and
Intelligent Interaction, volume LNCS 4738, pages 48–
58, September.
Tadahiko Kumamoto and Katsumi Tanaka. 2005. Pro-posal of impression mining from news articles. In
Proc. of Int. Conf. on Knowledge-Based Intelligent Information and Engineering Systems, volume LNAI
3681, pages 901–910. Springer.
Tadahiko Kumamoto. 2005. Design and evaluation of a music retrieval scheme that adapts to the user’s im-pressions. In Proc. of Int. Conf. on User Modeling, volume LNAI 3538, pages 287–296. Springer. Tadahiko Kumamoto. 2010. Design of impression scales
for assessing impressions of news articles. In Proc. of
DASFAA Workshop on Social Networks and Social Media Mining on the Web, volume LNCS 6193, pages
285–295.
Sadao Kurohashi, Toshihisa Nakamura, Yuji Matsumoto, and Makoto Nagao. 1994. Improvements of Japanese morphological analyzer JUMAN. In Proc. of the
Int. Workshop on Sharable Natural Language Re-sources, pages 22–28, Nara, Japan.
Kevin Hsin-Yih Lin, Changhua Yang, and Hsin-Hsi Chen. 2008. Emotion classification of online news articles from the reader’s perspective. In Proc. of the
IEEE/WIC/ACM Int. Conf. on Web Intelligence and In-telligent Agent Technology, pages 220–226,
Washing-ton, DC, USA. IEEE Computer Society.
Dominic W. Massaro. 1998. Perceiving Talking Faces:
From Speech Perception to a Behavioral Principle.
Susumu Ohno and Masando Hamanishi, editors. 1986.
Ruigo-Kokugo-Jiten. Kadokawa Shoten Publishing Co.,Ltd., Tokyo, Japan.
Rosalind W. Picard. 1997. Affective Computing. MIT Press.
Akira Sato, Jun Ogawa, and Hajime Kitakami. 2000. An impression-based retrieval system of music collection. In Proc. of the Int. Conf. on Knowledge-Based
Intelli-gent Information Engineering Systems & Allied Tech-nologies, volume 2, pages 856–859, Brighton, UK.
Tsuyoshi Takayama, Hirotaka Sasaki, and Shigeyuki Kuroda. 2005. Personalization by relevance ranking feedback in impression-based retrieval for multimedia database. Journal of Systematics, Cybernetics and
In-formatics, 3(2):85–89.
Peter D. Turney. 2002. Thumbs up or thumbs down? semantic orientation applied to unsupervised classifi-cation of reviews. In Proc. of the Annual Meeting of
the Association for Computational Linguistics, pages