The Role of Mitochondrial Uncoupling
Protein 3 in T Cell Function
A thesis submitted to Trinity College Dublin for the degree of
Doctor of Philosophy
By
Emma O’Connor, B.A., M.Sc.
January 2019
Supervisors:
Prof. Richard K. Porter and Prof. Patrick T. Walsh
School of Biochemistry and Immunology,
Trinity Biomedical Sciences Institute,
Trinity College Dublin,
i
Declaration
I declare that this thesis has not been submitted as an exercise for a degree at this or any
other university and it is entirely my own work. I agree to deposit this thesis in the
University’s open access institutional repository or allow the library to do so on my behalf,
subject to Irish Copyright Legislation and Trinity College Library conditions of use and
acknowledgement.
_______________________________
ii
Summary
Uncoupling proteins (UCPs) are members of the mitochondrial anion carrier superfamily
that can mediate the transfer of protons into the mitochondrial matrix from the
intermembrane space. Our laboratory has reported evidence of UCP1 and UCP3 expression
in thymocytes and spleen mitochondria, while Krauss et al. (2002) reported expression of
UCP2 in thymocytes. Thymocytes develop into mature T cells before exiting the thymus
and travelling to the periphery where they wait to carry out an immune response.
Expression of all three UCPs in thymocytes suggests their importance in thymic function,
as well as a potential role in T cell selection, maturation, metabolism and/or function.
Using quantitative RT-PCR, we have demonstrated that Ucp1, Ucp2 and Ucp3 are
expressed in peripheral naive CD4+ T cells at the mRNA level before being markedly
downregulated following cell activation under different polarizing conditions, the only
exception being the expression of Ucp2 in regulatory T cells (Treg cells) which is not
significantly altered following T cell activation until 120 h post-stimulation when it is
significantly increased. Overall, the downregulation of Ucps in response to T cell
activation is suggestive of a role for them in naive T cell maintenance. As our laboratory
has previously provided evidence of an altered T cell profile in both thymus and spleen of
Ucp3-/- mice, we investigated the role of UCP3 in CD4+ T cell metabolism and function
using the Seahorse XF Cell Mito Stress Test, flow cytometry and ELISAs. Following Ucp3
ablation, non-polarized, activated T cells (TH0 cells) produced significantly more IL-2,
which was reflected by an increase in CD25 and CD69 expression as well as an increase in
cell proliferation. However, this was also followed by a decrease in cell viability and IFN-γ
production 72 h post-stimulation. IL-2 promotes T cell activation, growth and survival but
it is also known to prime T cells for activation-induced cell death (AICD). In this regard, it
is thought that the increased IL-2 levels observed in Ucp3-/- TH0 cells are promoting early
T cell activation but also subsequently inducing AICD.Interestingly, although Ucp3-/- TH0
cells underwent early activation, Ucp3 ablation did not have a major impact on T cell
metabolism. IL-2 can influence the generation of TH17 cells, a subset of T cells that are
highly pro-inflammatory, and Treg cells; high levels of IL-2 promote Treg cell generation
while inhibiting the generation of TH17 cells.In line with this, the altered IL-2 expression
observed between Ucp3+/+ and Ucp3-/- T
H0 cells appears to have a crucial impact on the
generation of TH17 and Treg cells in vitro. An increased frequency of FoxP3+ Treg cells was
iii generated in vitro displayed lower cell survival/viability and decreased IL-17A production
compared to their Ucp3+/+ counterparts. These results were also mirrored in vivo. Ucp3
-/-mice immunized with keyhole limpet hemocyanin and cholera toxin displayed a higher
frequency of FoxP3+CD25+ Treg cells and significantly less production of IL-17A during
antigen recall response compared to Ucp3+/+ mice. We postulate that UCP3 is acting to
restrict the activation of naive T cells. UCP3 may be acting as a rheostat to dampen signals
following T cell receptor and CD28 co-receptor ligation, thereby preventing early
activation and AICD. The fact that Ucp3 ablation alters the TH17:Treg cell balance in vivo
as well as in vitro implicates UCP3 as a potential target for the treatment of TH17
iv
Acknowledgements
How do I even begin to thank my supervisors? Richie, thank you so much for your
patience, your guidance, your enthusiasm, your sense of humour and for letting me travel
with this Ph.D. almost every year since the start! You were a super supervisor! Also, thank
you so much for giving me the opportunity to do a Ph.D. in the first place. I don’t think I would have ever considered doing one, had you not asked me to apply and I’m very glad
you did. Pat, thank you so much for sharing your infinite knowledge with me over the last
four years. You made me feel like my Ph.D. was always on track and going okay every
time I met you (even if it really wasn’t but I appreciated and needed that!). There was
many a time I was thinking of giving up but I always changed my mind after meeting you
again and felt reassured. You made me hang on and keep going more than you’ll ever know. Thank you both so much. It goes without saying that I wouldn’t have finished this
Ph.D. or made half as good an attempt at it, were it not for the two of you. Most students
only get to have one supervisor, I was so lucky to have two, and two amazing ones at that!
Mary, Marilena and Caitriona, thank you for being such a lovely lab group for me to be
part of. Mary, I’ve done my entire Ph.D. with you in the group and can honestly say I have
never met a more intelligent, hard-working and gas woman in all my life! I’ve so much
admiration for you. Marilena, I don’t think you ever realised how much I enjoyed your
sense of humour. You always made me laugh and God knows we need that trying to get
through a Ph.D.! In my future job(s), if there isn’t someone like you around that quotes ‘Friends’ every day and shouts about the ‘left phalange’ when a catastrophe happens, I’ll
be very disappointed! Caitriona, newest member of the group! Once you started with us, it
was like you had always been in our lab group. You took to everything so fast and learned
techniques in record time! You’re an unbelievable worker. Thank you so much for all your help. You’ve become such an instrumental member of the team and I’ve no doubt that you
will excel at whatever you do in the future.
I owe a very big thank you to Gemma, Yasmina and Eirini for all your help, particularly
with the Rag1-/- experiments. Gemma especially, sorry for all my annoying e-mails over the last few years. I’m sure you’ll be delighted I won’t be pestering you anymore! The
three of you were always so friendly and welcoming to me whenever I popped out to the
National Children’s Research Centre and it was a pleasure to work with the three of you,
v I cannot forget to thank past members of my lab groups: Clare, Martina and Fintan but
particularly Shane, Ania and Rachel who were invaluable in getting me set up and teaching
me the ropes of T cell culture.
To past and present members of the 6th floor reading room: Sinead, Rachel, Jill, Gillian,
Ewelina, Ciara, Rebecca, Stefania, Claire, Magda, Maurizio, Tania, Vinnie, Sarah P.,
Mashael, Nick, Brian, Joan, Paddy, Siobhan, Sandra, Sarah C., Jade, Jenny, Kasia, Paula
and Dominic (I hope I’m not forgetting anyone!), thank you all so much for the laughs and
for making the reading room such a friendly space. I have made some amazing friends over
the last four years.
I would like to express my sincere gratitude to all of the guys, past and present, in the
Comparative Medicine Unit for your unwavering support: Laavanya, Mark C., Phillip,
Aoife, Rustam, Sylvie, José, Caroline and Anne. An extra big thank you extends to Mark
T. and Ciarán. The two of you helped me out so much, particularly when I first started.
You were both excellent teachers showing me the ropes and I can’t thank you enough for
your patience and guidance.
I am very grateful to Barry and Gavin for your help with flow and confocal. I’m sure I was
the most annoying and pestering person you’ve both ever been unfortunate enough to deal
with but you were both so professional and patient and I appreciated your help so much.
A sincere thank you to Natalia, Ed, Kingston and Caroline for your help and guidance with
the in vivo work. It would never have happened without you!
Liam and Noel, what would I have done without you? What would the SCHOOL do
without you? The two of you are such gents and were like superheroes, appearing within
minutes of something breaking down!
Ailish, Jane and Orla, thank you for all of your help with registration, grants, orders, etc.
Thank you to everyone who has been involved in the School Office during my time here:
vi Thank you to Liam McCarthy and all the staff in the Teaching Lab, particularly Brian for
printing out my posters!
To all of my friends from home, school, college and everywhere else: I became a hermit
because of this Ph.D. You all did without me for far too long but never stopped being the
best loyal friends a girl could have and were always there for me when I left my Ph.D. cave
and needed a distraction. I am so excited to start LIVING again and to have a great time
with all of you (Lisa and Aoife, hurry home from your travels)!
Myles/Moyles/Milly/Bebe, thank you for being my rock. You put up with my rants, my
tears and my hermit-ness through all of this. Thank you for being by my side the entire
time, for getting me through it and keeping me sane. You’re alright, you know that? Think I’ll keep you.
Mam, Dad, Aileen, Christine (git) and Seán, thank you for making it possible for me to do
a Ph.D. Thank you for keeping me fed and watered. Thank you for dropping me. Thank
you for collecting me. Thank you for walking Murph for me. Thank you for putting up
with me. Thank you for cheering me up. Thank you for encouraging me. Thank you for
viii
Table of Contents
Declaration………...i
Summary……….………...ii
Acknowledgements………...iv
List of Figures……….xiii
List of Tables………....xx
Abbreviations and Acronyms...………...xxi
1 Chapter 1: Introduction……….…....1
1.1Metabolism………...2
1.1.1 Mitochondria………..3
1.1.2 Glycolysis………...5
1.1.3 FA Oxidation………..7
1.1.4 Glutaminolysis……….………...9
1.1.5 The TCA Cycle……….………...10
1.1.6 OxPhos……….12
1.2Reactive O2 Species………....14
1.3Mitochondrial Proton Leak………....15
1.3.1 Brown Adipose Tissue and Non-Shivering Thermogenesis……....15
1.3.2 UCP1………....19
1.3.2.1UCP1 Regulation – Expression………...22
1.3.2.2UCP1 Regulation – Activation……….23
1.3.2.3UCP1 Regulation – Inhibition………..25
1.4Discovery of UCP1 Homologues………...27
1.4.1 Expression of UCP2 and UCP3………....30
1.5The Immune System……….…..31
1.5.1 Cells of the Immune System………....31
1.5.2 The Innate Immune System………..32
1.5.3 The Adaptive Immune System……….34
1.5.3.1T Cell Development in the Thymus……….36
1.5.3.2The Spleen………....38
1.5.4 Peripheral T Cells………...…..39
1.5.4.1CD8+ T Cells………....39
ix
1.5.4.2.1 TH1 and TH2 Cells………..42
1.5.4.2.2 TH17 Cells………..42
1.5.4.2.3 Regulatory T Cells……….……….43
1.5.5 Immune Cell Metabolism……….45
1.5.5.1CD4+ T Cell Metabolism………..46
1.6The Role of UCPs in the Immune System……….…50
1.7Project Objective and Aims………....53
1.8Project Hypothesis………..53
2 Chapter 2: Materials and Methods……….…....54
2.1Materials………...55
2.1.1 List of Materials Used and Suppliers………...55
2.1.2 Reagent Recipes………...60
2.2Methods………..63
2.2.1 Animals……….…...63
2.2.2 Genotyping………...64
2.2.2.1Isolation of Genomic DNA………..64
2.2.2.2NanoDrop® Quantification of Nucleic Acids………..64
2.2.2.3PCR for Genotyping of WT and Ucp KO Mice………..….65
2.2.2.4Agarose Gel Electrophoresis………....67
2.2.3 Cell Isolation and Culture………...68
2.2.3.1Isolation of Thymocytes………...68
2.2.3.2Isolation of Lymph Node Cells………....69
2.2.3.3Isolation of Spleen Cells………...69
2.2.3.4Isolation of CD4+ T Cells………...69
2.2.3.5Cell Counting………...70
2.2.3.6Cell Seeding and CD4+ T Cell Polarization and Culture….71 2.2.4 Quantitative RT-PCR………...72
2.2.4.1Brown Adipocyte Isolation………..72
2.2.4.2Isolation of RNA………..73
2.2.4.3Reverse Transcription……….…..74
2.2.4.4PCR………..75
2.2.5 Sodium Dodecyl Sulphate-Polyacrylamide Gel Electrophoresis….76 2.2.5.1SKM Cell Protein Lysate Preparation………..76
x 2.2.5.3Protein Quantification Using the Bicinchoninic Acid
Assay………....78
2.2.5.4SDS-PAGE Sample Preparation………..79
2.2.5.5SDS-PAGE………...80
2.2.5.6Immunodetection………..80
2.2.6 Flow Cytometry………....82
2.2.6.1Sample Preparation………...82
2.2.6.1.1 Sample Restimulation………...82
2.2.6.1.2 Sample Staining for Viability Detection…...83
2.2.6.1.3 Cell Surface Marker Labelling………...83
2.2.6.1.4 Sample Staining for Early Apoptosis, Apoptosis and Necrosis Detection………...84
2.2.6.1.5 Mitochondrial Labelling for Flow Cytometry....84
2.2.6.1.6 Sample Fixation and Permeabilization………...84
2.2.6.1.7 Intracellular Cytokine Labelling………….…...85
2.2.6.1.8 FoxP3, Ki-67 and UCP3 Labelling…………....85
2.2.6.2Sample Preparation for the Proliferation Assay…………...86
2.2.6.3Flow Cytometry Sample Processing………....87
2.2.7 ELISA………...90
2.2.8 Citrate Synthase Specific Activity Assay………...91
2.2.8.1Cell Lysate Preparation………....91
2.2.8.2Citrate Synthase Assay……….92
2.2.9 Seahorse XF Cell Mito Stress Test………...93
2.2.9.1Preparation of XF24 Sensor Cartridge……….93
2.2.9.2Preparation of XF24 Cell Culture Microplate………..93
2.2.9.3Preparation of Media for Seahorse XF Cell Mito Stress Test………...94
2.2.9.4Seeding Density Optimization……….…….94
2.2.9.5Compound Preparation and Concentration Optimization……….95
2.2.9.6Measurement of OCR and ECAR during the Seahorse XF Cell Mito Stress Test………..………..97
2.2.9.7Calculation of Metabolic Parameters from Seahorse Data……….……….99
xi
2.2.11 In Vivo Immunization of Ucp3+/+ and Ucp3-/- Mice……….99
2.2.12 Statistical Analysis……….100
3 Chapter 3: Ucp Expression in CD4+ T Cells and the Role of UCP3 in CD4+ T Cell Function………...101
3.1Introduction………...102
3.2Results………...104
3.2.1 Ucp1, Ucp2 and Ucp3 Transcription is Downregulated in Activated CD4+ T Cells………..104
3.2.2 UCP3 Protein Is Not Detected In Ucp3-/- Mice………..119
3.2.3 Ucp3 Ablation Affects TH0 Cells………...122
3.2.4 Ucp3 Ablation Does Not Affect CD4+CD8- Thymocytes, Naive CD4+ T Cells or Treg and Memory T Cell Frequency………...162
3.2.5 Ucp3 Ablation Does Not Affect TH1 Cells………....173
3.2.6 Ucp3 Ablation Reciprocally Affects TH17 and Treg Cells………..176
3.3Discussion………....193
3.4Conclusion………....200
4 Chapter 4: The Role of UCP3 in CD4+ T Cell Metabolism………....201
4.1Introduction………..202
4.2Results………..205
4.2.1 Ucp3 Ablation Does Not Affect the Mitochondrial Abundance of CD4+ T Cells………..205
4.2.2 Optimization Results for the Seahorse XF Cell Mito Stress Test………...210
4.2.2.1Cell Seeding Density Optimization………....214
4.2.2.2Seahorse XF Cell Mito Stress Test Compound Concentration Optimization………...…...216
4.2.3 Seahorse XF Cell Mito Stress Test Results………....221
4.2.3.1UCP3 Does Not Play a Role in TH0 Cell Metabolism…...221
4.2.3.2UCP3 Does Not Play a Role in Naive CD4+ T Cell Metabolism……….230
xii 4.2.4 Ucp3 Ablation Does Not Affect Naive CD4+ T Cell Mitochondrial
Membrane Potential or ROS Production………....253
4.3Discussion………256
4.4Conclusion………....267
5 Chapter 5: Ucp3 Ablation Alters CD4+ T Cell Function In Vivo………..268
5.1Introduction………..269
5.2Results………..270
5.2.1 Ucp3-/- CD4+ T Cells Undergo Increased Homeostatic Proliferation In Vivo………....270
5.2.2 Ucp3 Ablation Alters Treg Cell Frequency and CD4+ T Cell Antigen Recall Responses In Vivo………...272
5.3Discussion………289
5.4Conclusion………....292
6 Chapter 6: Discussion………293
6.1Conclusion………....306
7 Chapter 7: Future Work………....307
8 Chapter 8: Courses, Conferences and Publications………....313
8.1Courses……….…....314
8.2Conferences………..314
8.3Publications………..315
Appendices……….317
Appendix A: Supplier Names and Addresses………....318
Appendix B: Agarose Gels from Genotyping Experiments………...321
xiii
List of Figures
1.1 The hydrolysis of ATP, forming ADP and Pi………...2
1.2 Simplified structure of the mitochondrion……….4
1.3 Reactions of the glycolytic pathway……….………….6
1.4 Sequence of reactions of FAO……….……...8
1.5 The glutaminolysis pathway……….………..9
1.6 Reactions of the TCA cycle……….………...11
1.7 The process of OxPhos……….13
1.8 Generation of the proton electrochemical gradient by the ETC and its dissipation by UCP1………..……..18
1.9 UCP1 is highly conserved among species……….………...20
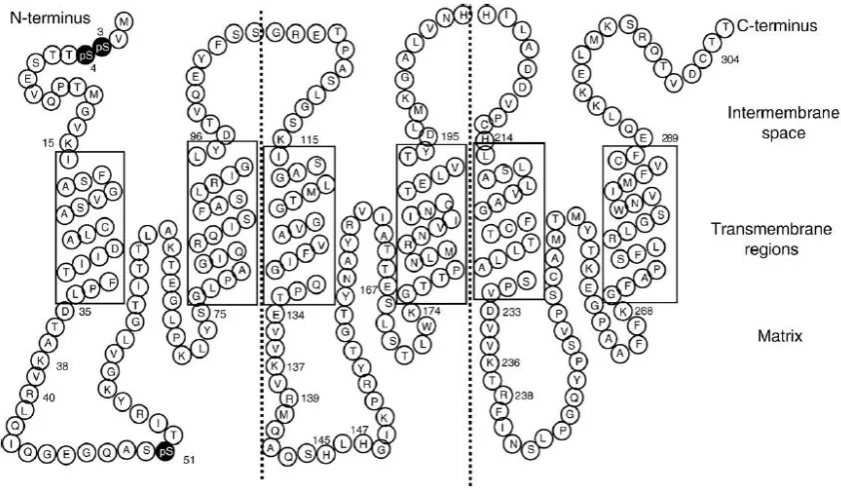
1.10 Tripartite structural model of UCP1 in the MIM……….21
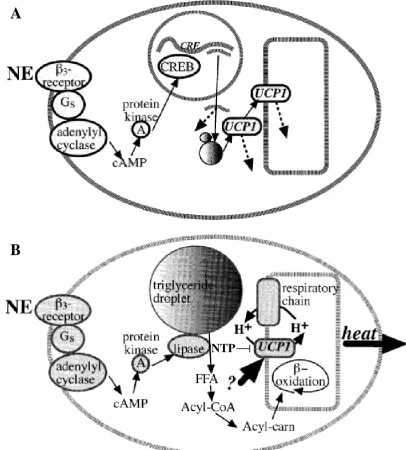
1.11 Hormonally-induced expression and regulation of UCP1……….…..26
1.12 Multiple amino acid sequence alignment of UCP1, UCP2, UCP3L and UCP3S………...………....29
1.13 Functional diversity of antigen-specific T cells………...41
1.14 T cell differentiation following activation by an APC……….44
1.15 The metabolic switch of naive and proliferating T cells………..48
1.16 Metabolic signatures of T cell subsets……….……49
2.1 Grid used to perform cell counts with a haemocytometer………....71
2.2 Gating strategy used during flow cytometry………....89
2.3 Wells of the XF24 cell culture microplate used for background correction……....95
2.4 Injection port layout of the XF24 sensor cartridge………...97
3.1 Ucp1 gene expression is downregulated in TH0 cells………106
3.2 Ucp1 gene expression is downregulated in TH1 cells………107
3.3 Ucp1 gene expression is downregulated in TH17 cells………..108
3.4 Ucp1 gene expression is downregulated in Treg cells……….109
3.5 Ucp2 gene expression is downregulated in TH0 cells………110
3.6 Ucp2 gene expression is downregulated in TH1 cells………111
3.7 Ucp2 gene expression is downregulated in TH17 cells………..112
xiv
3.9 Ucp3 gene expression is downregulated in TH0 cells………114
3.10 Ucp3 gene expression is downregulated in TH1 cells………115
3.11 Ucp3 gene expression is downregulated in TH17 cells………..116
3.12 Ucp3 gene expression is downregulated in Treg cells……….117
3.13 Comparison of Ucp gene expression in naive CD4+ T cells………..118
3.14 UCP3 protein detection in SKM and naive CD4+ T cells………..121
3.15 IL-2 production is increased in Ucp3-/- TH0 cells in the presence of increasing concentrations of anti-CD3………125
3.16 IL-2 production is increased in Ucp3-/- TH0 cells in the presence of increasing concentrations of anti-CD28………..126
3.17 IL-2 production is increased in Ucp3-/- TH0 cells in the presence of increasing concentrations of anti-CD3 and 2 µg.mL-1 of anti-CD28………..127
3.18 IL-2 production is increased in Ucp3-/- TH0 cells in the presence of increasing concentrations of anti-CD28 and 1 µg.mL-1 of anti-CD3………..128
3.19 Ucp3-/- TH0 cells display increased expression of CD25………...129
3.20 Ucp3-/- T H0 cells display increased expression of CD69………...130
3.21 Ucp3-/- TH0 cells display greater proliferation.………..131
3.22 Ki-67 expression of Ucp3+/+ and Ucp3-/- T H0 cells is comparable 24 h post-stimulation………..132
3.23 Ki-67 expression of Ucp3+/+ and Ucp3-/- TH0 cells is comparable 48 h post-stimulation ……….133
3.24 Ki-67 expression of Ucp3+/+ and Ucp3-/- TH0 cells is comparable 72 h post-stimulation………..134
3.25 Ucp3+/+ and Ucp3-/- TH0 cell size is comparable 24 h post-stimulation ………....139
3.26 Ucp3+/+ and Ucp3-/- TH0 cell size is comparable 48 h post-stimulation ………....140
3.27 Ucp3-/- TH0 cells display decreased cell size 72 h post-stimulation………...141
3.28 Ucp3-/- TH0 cells are more viable 24 h post-stimulation ……….…………..142
3.29 Viability of Ucp3+/+ and Ucp3-/- TH0 cells is comparable 48 h post-stimulation ..143
3.30 Ucp3-/- TH0 cells are less viable 72 h post-stimulation ……….144
3.31 IFN-γ secretion by Ucp3+/+ and Ucp3-/- TH0 cells 24 and 48 h post-stimulation...145
3.32 Ucp3-/- TH0 cells secrete less IFN-γ 72 h post-stimulation..………..146
3.33 Frequencies of viable, early apoptotic and apoptotic/necrotic Ucp3+/+ and Ucp3 -/-TH0 cells are comparable 24 h post-stimulation……….147
xv 3.35 Ucp3-/- T
H0 cells display lower viability and increased cell death 72 h
post-stimulation………..149
3.36 Ucp3-/- TH0 cells display greater cell death 72 h post-stimulation with 0.25 μg.mL-1
of anti-CD3 in the presence of cell death inhibitors………...150
3.37 Ucp3-/- TH0 cells display greater cell death 72 h post-stimulation with 0.5 μg.mL-1
of anti-CD3 in the presence of cell death inhibitors………...151
3.38 Ucp3-/- TH0 cells display greater cell death 72 h post-stimulation with 0.75 μg.mL-1
of anti-CD3 in the presence of cell death inhibitors………...152
3.39 Ucp3+/+ and Ucp3-/- TH0 cell death is comparable 72 h post-stimulation with 1
μg.mL-1 of anti-CD3 in the presence of cell death inhibitors……….153
3.40 CD95L expression of Ucp3+/+ and Ucp3-/- TH0 cells is comparable 24 h
post-stimulation………..154
3.41 CD95L expression of Ucp3+/+ and Ucp3-/- TH0 cells is comparable 48 h
post-stimulation………..155
3.42 Ucp3-/- TH0 cells display decreased CD95L expression 72 h post-stimulation…..156
3.43 Ucp3-/- T
H0 cells display decreased CD95L expression 72 h post-stimulation with
0.25 μg.mL-1 of anti-CD3 in the presence of cell death inhibitors……….157
3.44 Ucp3-/- T
H0 cells display decreased CD95L expression 72 h post-stimulation with
0.5 μg.mL-1 of anti-CD3 in the presence of cell death inhibitors………...158
3.45 CD95L expression of Ucp3+/+ and Ucp3-/- TH0 cells is comparable 72 h
post-stimulation with 0.75 μg.mL-1 of anti-CD3 in the presence of cell death
inhibitors……….159
3.46 CD95L expression of Ucp3+/+ and Ucp3-/- TH0 cells is comparable 72 h
post-stimulation with 1 μg.mL-1 of anti-CD3 in the presence of cell death inhibitors...160
3.47 Ucp3 gene expression is downregulated in TH0 cells within 4 h of activation...161
3.48 Viability and size of Ucp3+/+ and Ucp3-/- CD4+CD8- thymocytes are
comparable……….164
3.49 Ki-67 and FoxP3 expression of Ucp3+/+ and Ucp3-/- CD4+CD8- thymocytes is
comparable……….165
3.50 IFN-γ and IL-17A production by Ucp3+/+ and Ucp3-/- CD4+CD8- thymocytes is negligible………....166
3.51 Viability and size of Ucp3+/+ and Ucp3-/- naive CD4+ T cells from lymph nodes are comparable……….167
3.52 Ki-67 and FoxP3 expression of Ucp3+/+ and Ucp3-/- naive CD4+ T cells from lymph
xvi 3.53 IFN-γ and IL-17A production by Ucp3+/+ and Ucp3-/- naive CD4+ T cells from
lymph nodes is negligible………...169
3.54 Viability and size of Ucp3+/+ and Ucp3-/- splenic naive CD4+ T cells are comparable……….170
3.55 Surface marker expression of Ucp3+/+ and Ucp3-/- splenic naive CD4+ T cells and frequency of memory and Treg cells in Ucp3+/+ and Ucp3-/- mice are comparable..………...171
3.56 Ki-67 expression of, and IFN-γ and IL-17A production by, Ucp3+/+ and Ucp3 -/-splenic naive CD4+ T cells are comparable………....172
3.57 Viability and size of Ucp3+/+ and Ucp3-/- TH1 cells are comparable………..174
3.58 IFN-γ production by Ucp3+/+ and Ucp3-/- TH1 cells is comparable………....175
3.59 Ucp3-/- TH17 cells display decreased cell size………....179
3.60 Ucp3-/- TH17 cells secrete less IL-17A………...180
3.61 Ucp3-/- Treg cells display comparable viability and cell size………..181
3.62 Generation of FoxP3+ Treg cells and LAP and LAG3 expression of Ucp3+/+ and Ucp3-/- FoxP3+ T reg cells……….182
3.63 Ucp3-/- T cells under Treg polarizing conditions secrete less IL-10………....183
3.64 Viability of Ucp3+/+ and Ucp3-/- T H17 cells is comparable following IL-2 neutralisation………..184
3.65 Size of Ucp3+/+ and Ucp3-/- TH17 cells is comparable following IL-2 neutralisation………..185
3.66 IL-17A production by Ucp3+/+ and Ucp3-/- TH17 cells is comparable following IL-2 neutralisation………..186
3.67 Viability of Ucp3+/+ and Ucp3-/- Treg cells is comparable following IL-2 neutralisation………..187
3.68 Size of Ucp3+/+ and Ucp3-/- Treg cells is comparable following IL-2 neutralisation………..188
3.69 Generation of Ucp3+/+ and Ucp3-/- FoxP3+ Treg cells is comparable following IL-2 neutralisation………..189
3.70 LAP expression of Ucp3+/+ and Ucp3-/- FoxP3+ Treg cells is comparable following IL-2 neutralisation………..190
3.71 LAG3 expression of Ucp3+/+ and Ucp3-/- FoxP3+ Treg cells is comparable following IL-2 neutralisation………..191
xvii 4.1 Mitochondrial abundance of Ucp3+/+ and Ucp3-/- T
H0 cells is comparable……...206
4.2 Mitochondrial abundance of Ucp3+/+ and Ucp3-/- naive CD4+ T cells is
comparable...207
4.3 Mitochondrial abundance of Ucp3+/+ and Ucp3-/- TH17 cells is comparable…….208
4.4 Mitochondrial abundance of Ucp3+/+ and Ucp3-/- Treg cells is comparable……....209
4.5 Seahorse XF Cell Mito Stress Test profile and measurement of mitochondrial
parameters………..212
4.6 Seeding density optimization of Ucp3+/+ TH0 cells using the Seahorse XF24
Analyzer……….215
4.7 OCR of TH0 cells 24 h post-stimulation during the oligomycin concentration
optimization experiment……….218
4.8 OCR of TH0 cells 24 h post-stimulation during the FCCP concentration
optimization experiment……….219
4.9 OCR of TH0 cells 24 h post-stimulation during the rotenone concentration
optimization experiment……….220
4.10 OCR of Ucp3+/+ and Ucp3-/- T
H0 cells is comparable………....224
4.11 ECAR of Ucp3+/+ and Ucp3-/- TH0 cells is comparable………..225
4.12 Basal OCR/ECAR ratio of Ucp3+/+ and Ucp3-/- T
H0 cells is comparable………..226
4.13 Basal mitochondrial OCR and mitochondrial OCR attributable to proton leak and
maximal respiration of Ucp3+/+ and Ucp3-/- TH0 cells are comparable…………..227
4.14 Mitochondrial OCR linked to ATP production and coupling efficiency of Ucp3+/+
and Ucp3-/- TH0 cells are comparable……….228
4.15 Spare respiratory capacity of Ucp3+/+ and Ucp3-/- TH0 cells is comparable……..229
4.16 OCR of Ucp3+/+ and Ucp3-/- naive CD4+ T cells is comparable………....232
4.17 ECAR of Ucp3+/+ and Ucp3-/- naive CD4+ T cells is comparable………..233
4.18 Basal OCR/ECAR ratio of Ucp3+/+ and Ucp3-/- naive CD4+ T cells is comparable……….234
4.19 Basal mitochondrial OCR and mitochondrial OCR attributable to proton leak and
maximal respiration of Ucp3+/+ and Ucp3-/- naive CD4+ T cells are comparable..235
4.20 Mitochondrial OCR linked to ATP production and coupling efficiency of Ucp3+/+
and Ucp3-/- naive CD4+ T cells………...236
4.21 Spare respiratory capacity of Ucp3+/+ and Ucp3-/- naive CD4+ T cells is comparable……….237
4.22 OCR of Ucp3+/+ and Ucp3-/- T
H17 cells is comparable………...240
xviii 4.24 Ucp3-/- T
H17 cells display an increased basal OCR/ECAR ratio………...242
4.25 Basal mitochondrial OCR and mitochondrial OCR attributable to proton leak and maximal respiration of Ucp3+/+ and Ucp3-/- TH17 cells are comparable………....243
4.26 Mitochondrial OCR linked to ATP production and coupling efficiency of Ucp3+/+ and Ucp3-/- TH17 cells………....244
4.27 Spare respiratory capacity of Ucp3+/+ and Ucp3-/- TH17 cells………....245
4.28 OCR of Ucp3+/+ and Ucp3-/- Treg cells is comparable……….247
4.29 ECAR of Ucp3+/+ and Ucp3-/- Treg cells is comparable………..248
4.30 Basal OCR/ECAR ratio of Ucp3+/+ and Ucp3-/- Treg cells is comparable………...249
4.31 Basal mitochondrial OCR and mitochondrial OCR attributable to proton leak and maximal respiration of Ucp3+/+ and Ucp3-/- Treg cells are comparable…………..250
4.32 Mitochondrial OCR linked to ATP production and coupling efficiency of Ucp3+/+ and Ucp3-/- Treg cells are comparable………...251
4.33 Spare respiratory capacity of Ucp3+/+ and Ucp3-/- Treg cells………..252
4.34 Mitochondrial membrane potential of, and ROS production by, Ucp3+/+ and Ucp3 -/-naive CD4+ T cells are comparable………....255
5.1 Ucp3-/- CD4+ T cells display greater proliferation 7 days post-adoptive transfer to Rag1-/- host mice……….271
5.2 Viability of splenic CD4+ T cells from Ucp3+/+ and Ucp3-/- immunized mice is comparable……….276
5.3 Size of splenic CD4+ T cells from Ucp3+/+ and Ucp3-/- immunized mice is comparable……….277
5.4 Frequency of splenic CD25+FoxP3+ Treg cells is higher in Ucp3-/- immunized mice………....278
5.5 LAP expression of splenic FoxP3+ Treg cells from Ucp3+/+ and Ucp3-/- immunized mice is comparable……….279
5.6 LAG3 expression of splenic FoxP3+ Treg cells from Ucp3+/+ and Ucp3-/- immunized mice is comparable……….280
5.7 IFN-γ secretion by splenocytes from Ucp3+/+ and Ucp3-/- immunized mice is comparable……….281
5.8 Splenocytes from Ucp3-/- mice immunized with KLH and CT secrete less IL-17A...282
xix 5.10 CD4+ T cells isolated from lymph nodes of Ucp3-/- immunized mice display greater
viability………..……….284
5.11 Frequency of CD25+FoxP3+ Treg cells in lymph nodes of Ucp3+/+ and Ucp3-/- immunized mice is comparable………..285
5.12 LAP expression of FoxP3+ Treg cells from lymph nodes of Ucp3+/+ and Ucp3 -/-immunized mice is comparable………..286
5.13 LAG3 expression of FoxP3+ Treg cells from lymph nodes of Ucp3+/+ and Ucp3 -/-immunized mice is comparable………..287
5.14 IFN-γ, IL-17A and IL-10 secretion by lymph node cells from Ucp3+/+ and Ucp3 -/-immunized mice is comparable………..288
A1 Ucp1 genotyping agarose gel……….321
A2 Ucp2 genotyping agarose gel………...321
xx
List of Tables
2.1 Primers used for genotyping experiments………....66
2.2 Components of the PCR reaction mixture……….…...66
2.3 Thermal cycler program for Ucp genotyping………...67
2.4 Voltages used and expected PCR product sizes during agarose gel
electrophoresis………..………....68
2.5 Concentration of anti-CD3 and anti-CD28 used to activate CD4+ T cells………...71
2.6 Cytokines and/or antibodies and their working concentrations required to induce T
cell polarization………...……….72
2.7 Components of the reverse transcription reaction mixture……….….74
2.8 Thermal cycler program for reverse transcription………....75
2.9 Components of the PCR reaction mixture following reverse transcription……….76
2.10 Thermal cycler program for PCR……….76
2.11 Components of resolving and stacking gels for SDS-PAGE………...78
2.12 Dilutions of BSA performed to generate a standard curve for the BCA assay…....79
2.13 Sample preparation for SDS-PAGE……….80
2.14 Antibodies used for immunoblotting………....81
2.15 Concentrations of compounds used for sample restimulation………..82
2.16 Concentration of antibody:fluorophore conjugates used for cell surface marker
labelling………....83
2.17 Concentration of antibody:fluorophore conjugates used for intracellular cytokine
labelling………...…….85
2.18 Concentration of anti-FoxP3, anti-Ki-67 and anti-mouse UCP3 used for flow
cytometry………..86
2.19 Gating strategy during flow cytometry sample processing………..88
2.20 Concentration of capture and detection antibodies and recombinant protein
standards used during ELISAs……….91
2.21 Citrate synthase assay reaction mixture………...93
2.22 Compounds used during the Seahorse XF Cell Mito Stress Test……….…....96
2.23 Seahorse XF Cell Mito Stress Test protocol………....98
xxi
Abbreviations and Acronyms
2,4-DNP 2,4-dinitrophenol
7-AAD 7-aminoactinomycin D
°C degrees Celsius
ϵ extinction coefficient
α alpha
β beta
γ gamma
Δ delta
ΔA change in absorbance per minute
ε epsilon
κ kappa
µg microgram
μL microlitre
µm micrometre
µM micromolar
A absorbance at a particular wavelength
ADP adenosine diphosphate
AICD activation-induced cell death
AML1 acute myeloid leukaemia 1 protein
AMP adenosine monophosphate
AMPK 5’ adenosine monophosphate-activated protein kinase
ANOVA analysis of variance
AP-1 activator protein-1
APC antigen-presenting cell
APC allophycocyanin
APS ammonium persulphate
ATP adenosine triphosphate
BAT brown adipose tissue
BCA bicinchoninic acid
Bcl-2 B cell lymphoma-2
Bcl-XL B cell lymphoma-extra large
BCL11B B cell lymphoma 11 B
xxii
BMCP1 brain-specific mitochondrial carrier protein 1
bp base pair
BSA bovine serum albumin
C concentration of nucleic acid
c-FLIP cellular (FADD-like IL-1 beta converting enzyme)-inhibitory
protein
c-Myc cellular myelocytomatosis oncogene
Ca2+ calcium cation
cAMP cyclic adenosine monophosphate
CBP (cyclic adenosine monophosphate-response element-binding
protein)-binding protein
CD3 cluster of differentiation co-receptor 3
CD4 cluster of differentiation co-receptor 4
CD8 cluster of differentiation co-receptor 8
CD25 cluster of differentiation co-receptor 25
CD28 cluster of differentiation co-receptor 28
CD40 cluster of differentiation co-receptor 40
CD40L cluster of differentiation co-receptor 40 ligand
CD44 cluster of differentiation co-receptor 44
CD62L cluster of differentiation co-receptor 62 ligand
CD69 cluster of differentiation co-receptor 69
CD80 cluster of differentiation co-receptor 80
CD86 cluster of differentiation co-receptor 86
CD95 cluster of differentiation co-receptor 95
CD95L cluster of differentiation co-receptor 95 ligand
CD178 cluster of differentiation co-receptor 178
CD223 cluster of differentiation co-receptor 223
cDNA complimentary deoxyribonucleic acid
cm centimetre
CMU Comparative Medicine Unit
CNS central nervous system
CO2 carbon dioxide
CoA coenzyme A
CoASH coenzyme A with a sulfhydryl functional group
xxiii
CPT2 carnitine palmitoyltransferase 2
CREB cyclic adenosine monophosphate-response element-binding protein
cRPMI complete Roswell Park Memorial Institute 1640 medium
CT cholera toxin
CTL cytotoxic T lymphocyte
Cys cysteine
DAMP damage-associated molecular pattern
DC dendritic cell
DCF 2’,7’-dichlorofluorescein
DCFDA 2’,7’-dichlorofluorescein diacetate
dH2O distilled water
DMSO dimethyl sulfoxide
DNA deoxyribonucleic acid
dNTP deoxynucleotide triphosphate
DPBS Dulbecco’s Phosphate Buffered Saline
DTNB 5,5’-dithiobis(2-nitrobenzoic acid)
DTT DL-dithiothreitol
EAE experimental autoimmune encephalomyelitis
ECAR extracellular acidification rate
EDTA ethylenediaminetetraacetic acid
EGR1 early growth response 1
EGR2 early growth response 2
EGR3 early growth response 3
ELISA enzyme-linked immunosorbent assay
ETC electron transport chain
EtOH ethanol
FA fatty acid
FAD flavin adenine dinucleotide
FADD Fas-associated death domain
FADH2 reduced flavin adenine dinucleotide
FAO fatty acid beta-oxidation
FasL Fas ligand
FBS foetal bovine serum
FCCP carbonyl cyanide-p-trifluoromethoxyphenylhydrazone
xxiv
FITC fluorescein isothiocyanate
FLICE (Fas-associated death domain)-like IL-1 beta converting enzyme
FoxP2 forkhead box P2
FoxP3 forkhead box P3
FSC forward scatter
FSC-A forward scatter-area
FSC-W forward scatter-width
g g-force
g grams
GATA-3 GATA-binding protein 3
GDP guanosine diphosphate
GLUT glucose transporter
GLUT1 glucose transporter 1
GM-CSF granulocyte-macrophage colony-stimulating factor
GMP guanosine monophosphate
Gs protein stimulatory guanosine triphosphate-binding protein
GTP guanosine triphosphate
h hour
H+ proton
H2O water
H2O2 hydrogen peroxide
HIF1α hypoxia-inducible factor 1 alpha
His histidine
HNE 4-hydroxy-trans-2-nonenal
HPRA Health Products Regulatory Authority
Hprt Hypoxanthine phosphoribosyl transferase
HRP horseradish peroxidase
HSL hormone-sensitive triacylglycerol lipase
IBD inflammatory bowel disease
IFN-γ interferon-gamma
Ig immunoglobulin
IL-1 interleukin-1
IL-1β interleukin-1 beta
IL-2 interleukin-2
xxv
IL-2Rα interleukin-2 receptor alpha subunit
IL-4 interleukin-4
IL-5 interleukin-5
IL-6 interleukin-6
IL-6R interleukin-6 receptor
IL-6Rα interleukin-6 receptor alpha subunit
IL-6Rβ interleukin-6 receptor beta subunit
IL-10 interleukin-10
IL-12 interleukin-12
IL-12Rβ2 interleukin-12 receptor beta 2 subunit
IL-13 interleukin-13
Il-17 interleukin-17
IL-17A interleukin-17A
IL-17F interleukin-17F
IL-21 interleukin-21
IL-22 interleukin-22
IL-23 interleukin-23
IL-35 interleukin-35
IMS intermembrane space
iTreg inducible regulatory T cell
Jak Janus kinase
JAX® Jackson Laboratory
kDa kiloDalton
kg kilogram
KLH keyhole limpet hemocyanin
KO knockout
l path length of spectrophotometer cuvette
LAG3 lymphocyte activation gene 3
LAP latency-associated peptide
LAST Laboratory Animal Science and Training
LPS lipopolysaccharide
M molar
mA milliamp
MALT mucosa-associated lymphoid tissue
xxvi
MFI median fluorescence intensity
mg milligram
Mg2+ magnesium cation
MHC major histocompatibility complex
MIM mitochondrial inner membrane
min minute
mL millilitre
mM millimolar
MM mitochondrial matrix
Mn2+ manganese cation
MOM mitochondrial outer membrane
Mr molecular weight
mRNA messenger ribonucleic acid
MS multiple sclerosis
mTOR mammalian target of rapamycin
N Normal
NaCl sodium chloride
NAD+ nicotinamide adenine dinucleotide
NADH reduced nicotinamide adenine dinucleotide
NADPH nicotinamide adenine dinucleotide phosphate
NE norepinephrine
Nec-1 necrostatin-1
NEFA non-esterified fatty acid
NF-κB nuclear factor kappa light chain-enhancer of activated B cells
NFAT nuclear factor of activated T cells
NFATc1 nuclear factor of activated T cells, cytoplasmic 1
NFATc2 nuclear factor of activated T cells, cytoplasmic 2
ng nanogram
NK cell natural killer cell
NLR nucleotide-binding oligomerisation domain-like receptor
nm nanometre
nmol nanomole
NO nitric oxide
NOD nucleotide-binding oligomerisation domain
xxvii
NRF2 nuclear factor-erythroid 2-related factor 2
NST non-shivering thermogenesis
nTreg naturally occurring regulatory T cell
O2 oxygen
O2- superoxide anion
OCR oxygen consumption rate
OCT1 octamer-binding protein 1
OCT2 octamer-binding protein 2
OH- hydroxyl radical
OxPhos oxidative phosphorylation
PAMP pathogen-associated molecular pattern
PCR polymerase chain reaction
PD-1 programmed cell death protein 1
PDHe1α pyruvate dehydrogenase e1 alpha subunit
PE R-phycoerythrin
PE-Cy5 R-phycoerythrin-Cyanine 5
PE-Cy7 R-phycoerythrin-Cyanine 7
PerCP eFluor™ 710 Peridinin chlorophyll protein eFluor™ 710
PerCP-Cy™5.5 Peridinin chlorophyll protein-Cyanine 5.5
pg picogram
PGC1α peroxisome proliferation activating receptor gamma coactivator 1
alpha
Pi phosphate
PKA protein kinase A
PKC protein kinase C
PMA phorbal 12-myristate 13-acetate
PMF proton-motive force
pmol picomole
PPAR peroxisome proliferation activating receptor
PPARγ peroxisome proliferation activating receptor gamma
PPARδ peroxisome proliferation activating receptor delta
PRDM1 PR domain zinc finger protein 1
PRDM16 PRD1-BF1-RIZ1 homologous domain-containing protein-16
PRR pattern recognition receptor
xxviii
QH2 ubiquinol
Rag1 recombination-activating gene 1
RBC red blood cell
RhoA Ras homologue gene family, member A
rhTGF-β1 recombinant human transforming growth factor-beta 1
rIFN-γ recombinant interferon-gamma
rIL-2 recombinant interleukin-2
rIL-6 recombinant interleukin-6
rIL-10 recombinant interleukin-10
rIL-12 recombinant interleukin-12
rIL-17A recombinant interleukin-17A
RIPA radio immunoprecipitation assay
RNA ribonucleic acid
RNS reactive nitrogen species
RORγt retinoic acid receptor-related orphan receptor gamma t
ROS reactive oxygen species
RPMI Roswell Park Memorial Institute 1640 medium
RT room temperature
RT-PCR reverse transcription polymerase chain reaction
RUNX1 runt-related transcription factor 1
RXR retinoid X receptor
s second
SCID severe combined immunodeficiency
SDS sodium dodecyl sulphate
SDS-PAGE sodium dodecyl sulphate polyacrylamide gel electrophoresis
siRNA small interfering ribonucleic acid
SKM skeletal muscle
SLE systemic lupus erythematosus
SOD superoxide dismutase
Sod2 superoxide dismutase 2
SSC side scatter
SSC-A side scatter-area
SSC-W side scatter-width
STAT3 signal transducer and activator of transcription 3
xxix
STAT5 signal transducer and activator of transcription 5
T3 triiodothyronine
T-bet T-box transcription factor TBX21
TCA tricarboxylic acid
TCR T cell receptor
TBSI Trinity Biomedical Sciences Institute
TEMED tetramethylethylenediamine
TGF-β transforming growth factor-beta
TH cell T helper cell
TLR Toll-like receptor
TLR4 Toll-like receptor 4
TMB 3,3’,5,5’-tetramethylbenzidine
TNBH 5-thionitrobenzene
TNF tumour necrosis factor
TNF-α tumour necrosis factor-alpha
TNF-β tumour necrosis factor-beta
Treg cell regulatory T cell
UCP uncoupling protein
UCP1 uncoupling protein 1
UCP2 uncoupling protein 2
UCP3 uncoupling protein 3
Ucp3L uncoupling protein 3 long form
Ucp3S uncoupling protein 3 short form
UCP4 uncoupling protein 4
UCP5 uncoupling protein 5
Ucp5L uncoupling protein 5 long form
Ucp5S uncoupling protein 5 short form
Ucp5SI uncoupling protein 5 short form with insert
UNG uracil-deoxyribonucleic acid glycosylase
UV ultraviolet
V volt
v/v volume per unit volume
w/v weight per unit volume
WAT white adipose tissue
xxx
1
Chapter 1:
2
Chapter 1
Introduction
1.1 Metabolism
A fundamental property of living organisms is that they harness energy from their
environment in order to drive thermodynamically unfavourable processes (Brand, 2000).
The energy used by animals is sourced from food, while plants harness energy from the
sun. In animal cells, most of the energy produced is derived from three fuel sources:
glucose, glutamine and fatty acids (FAs). These fuel sources are digested and metabolized,
forming adenosine triphosphate (ATP). The displacement from equilibrium of the
hydrolysis of ATP to adenosine diphosphate (ADP) and phosphate (Pi; Figure 1.1)
provides significant Gibbs free energy for useful work, such as maintaining ion gradients,
transporting substrates and proteins across membranes, protein synthesis and muscle
movement. All cells of the body need ATP to fuel cellular processes and, due to this
displacement from equilibrium, it is the primary chemical energy currency of the cell
(Pebay-Peyroula et al., 2003). The majority of ATP in a cell is produced within the
mitochondria and an average 70 kilogram (kg) man produces approximately 50 kg of ATP
per day (Pebay-Peyroula et al., 2003).
Figure 1.1: The hydrolysis of ATP, forming ADP and Pi
Adapted from Berg et al. (2012). H2O: water.
3
1.1.1 Mitochondria
Mitochondria (singular: mitochondrion) arose when an ancient prokaryotic lineage
supposedly evolved a nucleus, giving rise to a eukaryote, and then endocytosed a
bacterium. This intracellular bacterium co-existed inside the eukaryote in symbiosis,
creating the first acquired or original mitochondrion (Henze and Martin, 2003).
Mitochondria are present in all known eukaryotic cells (except for erythrocytes). They are
interesting in that they contain mitochondrial deoxyribonucleic acid (DNA) that codes for
13 proteins, 2 ribosomal ribonucleic acids (RNAs) and 22 transfer RNAs, all of which are
essential for mitochondrial replication. This mitochondrial DNA is a vestige from the DNA
of the original bacterium from which mitochondria evolved. Mitochondrial density in cells
is dependent on ATP demand – the more energy required for a specific cell, the more
mitochondria present.
Structurally, mitochondria consist of two membranes: a mitochondrial outer membrane
(MOM), which is thought to be left over from the original endocytosis event, and an
extensively folded mitochondrial inner membrane (MIM; Figure 1.2A). The foldings and
convolutions of the MIM, called cristae (Plecitá-Hlavatá et al., 2008), are required to
substantially increase its surface area. Both membranes have highly distinct properties;
while both are made up of a phospholipid bilayer and proteins, the MOM is freely
permeable to small molecules and ions, whereas the MIM is practically impermeable to
most small molecules and ions, including protons. The MIM, therefore, houses a number
of transporters, proteins and enzymes, such as the ADP/ATP translocase, to transport
specific molecules across this impermeable barrier. Together, the two membranes create
two separate compartments within mitochondria: the intermembrane space (IMS) and the
mitochondrial matrix (MM; Figure 1.2B). The IMS lies between the two membranes, while
the MM is the inner most part of the organelle bound by the MIM. The MM is home to a
number of soluble enzymes involved in oxidative metabolism, as well as substrates,
nucleotide cofactors, inorganic ions, the mitochondrial genetic machinery, DNA, RNA and
ribosomes. Mitochondria range in size from 0.5 to 1 micrometre (µm) in diameter and tend
to form columnar reticular networks undergoing constant fission and fusion (Figure 1.2C;
4
Figure 1.2: Simplified structure of the mitochondrion
Electron micrograph (A) and schematic representation (B) of a mitochondrion. Taken from
Berg et al. (2012). (C) 4Pi microscopy images of originally highly interconnected
mitochondrial reticulum in INS-1E cells that have disintegrated following addition of 20
micromolar (µM) rotenone (panel a), 1 µM carbonyl
cyanide-p-trifluoromethoxyphenylhydrazone (FCCP; panel b) and both agents (panel c). Taken from
Plecitá-Hlavatá et al. (2008).
A
B
5
1.1.2 Glycolysis
Glucose is a simple sugar and the basic building block of polysaccharides. Importantly, it
acts as a carbon fuel source for the generation of cellular ATP by being metabolized via
two integrated pathways: glycolysis and oxidative phosphorylation (OxPhos; Zheng,
2012). Glycolysis is the first process that occurs in the metabolism of glucose. Taking
place in the cytoplasm, it is the sequence of reactions that converts one molecule of
glucose to two molecules of pyruvate, with the concomitant net production of two
molecules of ATP (Zheng, 2012) and two molecules of reduced nicotinamide adenine
dinucleotide (NADH; Figure 1.3). The first step of glycolysis occurs following the entry of
glucose into the cell through specific transport proteins. It is phosphorylated by hexokinase
to form glucose-6-phosphate, which is notable for two reasons: glucose-6-phosphate
cannot pass through the membrane because it is not a substrate for glucose transporters
(GLUTs) and is, thus, trapped in the cell for processing, and the addition of a phosphoryl
group acts to destabilize glucose, subsequently facilitating its further metabolism.
Glucose-6-phosphate is then processed down the glycolytic pathway, undergoing numerous
biochemical reactions until it has been converted to two molecules of pyruvate. Pyruvate is
further processed to lactate under anaerobic or hypoxic conditions (lactic acid
fermentation) and is excreted from the cell or, under aerobic conditions, pyruvate can be
transported into the mitochondria by the mitochondrial pyruvate carrier to be oxidized to
carbon dioxide (CO2) and acetyl coenzyme A (acetyl CoA) by pyruvate dehydrogenase. In
some cases, the conversion of pyruvate into lactate may also occur in normoxia (Chang et
al., 2013), which will be discussed in more detail later. As glycolysis does not require
6
Figure 1.3: Reactions of the glycolytic pathway
Glycolysis can be divided into two stages; during stage 1, glucose is destabilised and
cleaved into two interconvertible three-carbon molecules while during stage 2, those
molecules are used to produce ATP. Enzymes involved in the glycolytic pathway are
displayed in blue font. The consumption and production of ATP at different steps of the
7
1.1.3 FA Oxidation
Some cells can use FAs as a fuel source for energy rather than carbohydrates containing
glucose, as FAs are a rich source of ATP. For example, the oxidation of one palmitic acid
molecule yields a net production of 129 ATP molecules in comparison to 36 ATP
molecules from the complete oxidation of glucose. FAs can be broken down via beta
(β)-oxidation. The metabolism of non-esterified long-chain FAs present in the cytoplasm
requires several steps to transport them into the MM, where FA β-oxidation (FAO) takes
place (Schrauwen et al., 2001). In the cytoplasm, FAs are firstly converted to their
esterified form, fatty acyl-CoA, by an enzyme called fatty acyl-CoA synthetase
(Schrauwen et al., 2001, 2002, 2003, 2006). Fatty acyl-CoA (and non-esterified FAs;
NEFAs) can easily cross the MOM; however, the MIM is impermeable to long-chain fatty
acyl-CoA and NEFAs. The acyl-CoA ester is converted to acyl-carnitine by carnitine
palmitoyltransferase 1A (CPT1A) located at the MOM (Schrauwen et al., 2001, 2002).
Acyl-carnitine crosses the MIM in exchange for carnitine, is reconverted to acyl-CoA in
the MM by CPT2 and subsequently enters the FAO and tricarboxylic acid (TCA) cycles as
FAs can only undergo FAO in their esterified form (Schrauwen et al., 2001, 2002, 2006).
In contrast to long-chain FAs, medium-chain FAs do not need to be esterified to CoA
esters in the cytoplasm (Schrauwen et al., 2003). Medium-chain FAs bypass CPT1A and
can be esterified to their respective CoA esters inside the MM before being diverted to
FAO (Schrauwen et al., 2003). Once inside the MM, CoA esters then undergo the series of
reactions of FAO (Figure 1.4), resulting in the generation of acetyl CoA and reducing
equivalents [NADH, a proton (H+) and reduced flavin adenine dinucleotide (FADH2)] for
8
Figure 1.4: Sequence of reactions of FAO
FAs are degraded by the repetition of a four-reaction sequence consisting of oxidation,
hydration, oxidation and thiolysis. Adapted from Berg et al. (2012). Acyl CoA
Dehydrogenase
Enoyl CoA Hydratase
L-3-Hydroxyacyl CoA Dehydrogenase
9
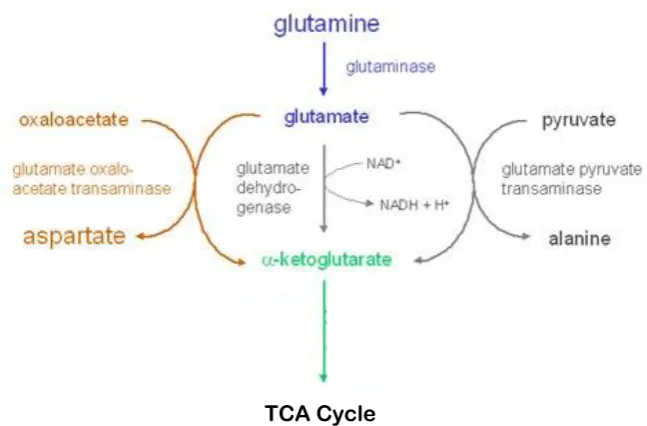
1.1.4 Glutaminolysis
The metabolism of the amino acid glutamine involves its conversion to alpha
(α)-ketoglutarate, an intermediate of the TCA cycle. The conversion of glutamine to
α-ketoglutarate involves two main steps: the hydrolysis of the amino group of glutamine by
glutaminase in mitochondria, yielding glutamate and ammonium, and the conversion of
glutamate to α-ketoglutarate by glutamate dehydrogenase, glutamate pyruvate
transaminase or glutamate oxaloacetate transaminase, a component of the malate-aspartate
shuttle (Figure 1.5; Jin et al., 2016). Once converted to α-ketoglutarate, it may enter the
[image:41.595.155.479.285.498.2]TCA cycle in the MM.
Figure 1.5: The glutaminolysis pathway
During glutamine metabolism, the amino group of glutamine is hydrolysed by glutaminase,
forming glutamate and ammonium. Glutamate can be converted to α-ketoglutarate by one
of three different reactions and enter the TCA cycle. Image taken and adapted from
[http://www.metabolic-database.com/html/glutaminolysis_energy_scheme.html].
10
1.1.5 The TCA Cycle
One of the main functions of mitochondria is to continue the metabolism of acetyl CoA
generated from pyruvate and FAO. This oxidation is achieved through the TCA cycle. The
reactions of the TCA cycle, also known as the citric acid cycle or Kreb’s cycle, occur in
the MM. Under aerobic conditions, acetyl CoA combines with four-carbon oxaloacetate to
yield a six-carbon tricarboxylic acid catalysed by citrate synthase. Citrate then undergoes a
series of oxidizing reactions denoted the TCA cycle (Figure 1.6). During the cycle, the
six-carbon compound releases CO2 twice in two successive oxidative decarboxylations.
Overall, two carbon atoms enter the cycle as acetyl units and two carbon atoms leave the
cycle in the form of two molecules of CO2. The reducing equivalents generated, namely
NADH, H+ and FADH2, are used to produce ATP by OxPhos. Succinyl CoA synthetase
also produces guanosine triphosphate (GTP; which is converted to ATP) by substrate level
11
Figure 1.6: Reactions of the TCA cycle
Enzymes involved in the TCA cycle are displayed in blue font. The reducing equivalents
NADH and FADH2, produced at certain steps of the TCA cycle, are displayed in pink font.
12
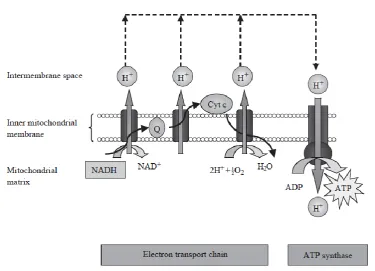
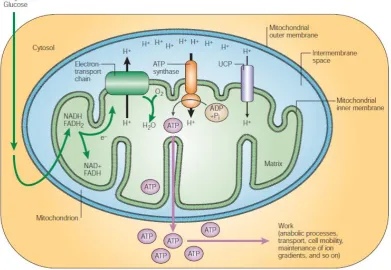
1.1.6 OxPhos
The main bulk of ATP for a cell is formed at the MIM where OxPhos takes place. OxPhos
is the terminal process of cellular respiration in eukaryotes. It utilises the energy released
from the oxidation of nutrients to create an electrochemical gradient across the MIM. This
gradient drives F1F0-ATP synthase, the enzyme responsible for catalysing the synthesis of
ATP, resulting in a large amount of ATP being made available to the cell. This process was
first described by Peter Mitchell in the 1960s and is best summarized by his proposed
chemiosmotic theory (Mitchell, 1961).
As previously mentioned, the energy harnessed up to this point from the oxidation of fuel
substrates during glycolysis, FAO and the TCA cycle is in the form of electrons that were
transferred to nicotinamide adenine dinucleotide (NAD+) and flavin adenine dinucleotide
(FAD) to form NADH plus H+ and FADH2, respectively. During OxPhos, these electron
carriers in turn pass the electrons to a series of enzyme complexes embedded in the MIM,
referred to as the electron transport chain (ETC; Krauss et al., 2005). The ETC consists of
four complexes: NADH-Q oxidoreductase (Complex I), succinate-Q reductase (Complex
II), Q-cytochrome c oxidoreductase (Complex III) and cytochrome c oxidase (Complex
IV). Electrons of NADH-linked substrates in the MM are donated to Complex I, while
electrons of FADH2-linked substrates are donated further up the ETC at an electron entry
site in Complex II. Electrons are transferred from Complexes I and II to the mobile
lipid-soluble carrier, ubiquinone, which is reduced to ubiquinol (QH2). From QH2, the electrons
are passed to Complex III followed by the water (H2O)-soluble mobile carrier cytochrome
c and, finally, to Complex IV. Here, they are transferred to molecular O2 at the haem a3
-CuB binuclear centre, reducing it to H2O (Krauss et al., 2005). The pass of electrons along
this chain is obligatorily coupled with the translocation of protons from the MM, across the
MIM and into the IMS by three of the protein complexes: Complex I, Complex III and
Complex IV (Krauss et al., 2005). This creates a transmembrane pH and electrochemical
gradient. The potential energy provided by this gradient, referred to as the proton-motive
force (PMF), is used to drive the synthesis of ATP from ADP and Pi by the flow of protons
down the gradient back to the MM through ATP synthase (Complex V; Stock et al., 2000).
In short, ATP synthesis by mitochondria is coupled to O2 consumption via the PMF
(summarized in Figure 1.7). As previously mentioned, the MIM contains an ADP/ATP
translocase. This exchanges ADP from the cytoplasm for the ATP synthesized during
OxPhos (Pebay-Peyroula et al., 2003). The ATP is translocated to the cytoplasm and other
13 generates a net production of approximately 34 molecules of ATP per glucose molecule,
making this form of glucose metabolism extremely resourceful in terms of energy
[image:45.595.130.506.147.418.2]production (Zheng, 2012).
Figure 1.7: The process of OxPhos
The cellular metabolism of substrates, such as glucose and FAs, generates electrons in the
form of the reduced hydrogen carriers, NADH plus H+ and FADH2. NADH and FADH2
donate electrons to the ETC which comprises protein complexes that are located in the
MIM. Electrons are ultimately transported to molecular O2 which is reduced to H2O. As
electrons are transferred along the ETC, protons are pumped from the MM into the IMS.
This generates a proton gradient across the MIM which is used to synthesize ATP. Protons
can cross the MIM and return to the MM via ATP synthase, thereby providing energy for
the conversion of ADP to ATP. ATP is then made available to the cell for various
processes that require energy. Adapted from Schrauwen et al. (2002). Cyt C: cytochrome
14
1.2 Reactive O2 Species
A by-product of all normally functioning mitochondria and a consequence of the
generation of the proton electrochemical gradient is the continual involuntary release of
free electrons from the ETC. These electrons have the potential to partially reduce O2,
forming intracellular reactive O2 species (ROS). ROS is the collective term for the
chemical species formed upon the incomplete reduction of molecular O2 and includes the
superoxide anion (O2-), hydrogen peroxide (H2O2) and the hydroxyl radical (OH-), all of
which are powerful oxidants. The major sites of intracellular ROS generation by the ETC
are predominantly Complexes I and III (Drahota et al., 2002; Brand et al., 2004; Murphy,
2009).
In some cases, the generation of ROS can be deliberate. For example, phagocytes generate
ROS as a host defence mechanism and ROS can also participate in cell signalling.
However, the occurrence of ROS is generally considered to be an unintended consequence
of aerobic metabolism (Lambeth, 2002). Free radicals can cause harm to cells if not
removed quickly. ROS cause damage to cellular components, particularly nuclear and
mitochondrial DNA as ROS are produced at the MIM, but also RNA, lipids and proteins
(Brand, 2000; Schrauwen et al., 2006). This leads to impaired function, increased somatic
mutation and, hence, degeneration and ageing (Brand, 2000; Brand et al., 2004).
Importantly, all cells have powerful antioxidants, such as O2- dismutase (SOD), and
physiological ROS defence mechanisms in place to counteract ROS production by
mitochondria and reduce oxidative damage (Ježek and Hlavatá, 2005). For example, O2-,
the parental form of ROS, can be enzymatically converted to H2O2 by SOD (Brand et al.,
2004). The H2O2 produced by SOD conversion of O2- can be reduced to O2 and H2O by