Simulating STM transport in alkanes from first principles
C. Toher,*I. Rungger, and S. Sanvito†
School of Physics and CRANN, Trinity College, Dublin 2, Ireland
共Received 20 January 2009; revised manuscript received 3 April 2009; published 27 May 2009兲
Simulations of scanning tunneling microscopy共STM兲measurements for molecules on surfaces are tradi-tionally based on a perturbative approach, most typically employing the Tersoff-Hamann method. This assumes that the STM tip is far from the sample so that the two do not interact with each other. However, when the tip gets close to the molecule to perform measurements, its electrostatic interplay with the substrate may generate nontrivial potential distribution, charge transfer, and forces, all of which may alter the electronic and physical structure of the molecule. These effects are investigated with theab initioquantum transport codeSMEAGOL, combining the nonequilibrium Green’s-function formalism with density functional theory. In particular, we investigate alkanethiol molecules terminated with either CH3or CF3end-groups on gold surfaces for which recent experimental data are available. We discuss the effects connected to the interaction between the STM tip and the molecule, as well as the asymmetric charge transfer between the molecule and the electrodes.
DOI:10.1103/PhysRevB.79.205427 PACS number共s兲: 73.63.⫺b, 72.10.Bg, 71.15.Mb
I. INTRODUCTION
Scanning tunneling microscopy 共STM兲 共Ref. 1兲 is an in-valuable surface-characterization tool with multiple applica-tions in molecular electronics. Typically, an atomically sharp probing tip constructed from heavy metals such as platinum, tungsten, or iridium scans a substrate by means of a tiny tunneling current. The method can be used as a topographic tool to map the positions of atoms, defects, and molecules on surfaces, as a spectroscopic tool to probe their local density of states, and more recently in its spin-polarized version as an ultrasensitive magnetometer.2Furthermore STM can also be used as an atomic fabrication tool for depositing atoms and molecules on a surface so as to form nanoscale devices.3 Additionally, it can be used to manufacture breaking junc-tions, where a molecule is pulled out of a surface, so that electronic transport measurements can be performed.4,5 In-deed, the level of geometric control provided by the STM even allows mechanical gating experiments to be carried out so that a range of different transport regimes can be investi-gated for the same molecule.6,7 In general, both in its topo-graphic and spectroscopical modes, an STM measurement consists of a collection of different I-V curves for different tip-to-sample positions.
In the vast majority of cases, calculations of STM currents are based on Bardeen’s perturbative approach to tunneling8 and consist of evaluating the tunneling matrix elements be-tween the STM tip and the sample. A simplified form due to Tersoff and Hamann共TH兲 共Ref.9兲which reduces to the cal-culation of the local density of states is now mainstream and usually implemented in standard electronic structure codes. The TH scheme assumes that the STM tip is sufficiently far from the molecule so as not to affect its electronic structure. As a result of this assumption, there is no self-consistent evaluation of the potential drop nor of the charge redistribu-tion between the tip and the sample. These methods thus become unreliable when the tip is close to the molecule and deviations from the TH current are expected. It is therefore important to explore, for STM simulations, the use of self-consistent transport methods10–12such as the nonequilibrium
Green’s-function formalism 共NEGF兲 共Ref. 13兲 combined with ab initio electronic structures obtained from density functional theory 共DFT兲.14,15 This is the goal of our work, which is based on the use of the electronic transport code SMEAGOL.10,11
It is important to realize that NEGF-DFT is completely complementary to the standard TH scheme. Indeed, it pre-sents problems in the limit of large tip-to-sample separation, where TH is most effective. The main reason for this is rooted in the fact that SMEAGOL employs the numerical implementation of DFT contained in theSIESTAcode.16The SIESTAbasis set is constructed from numerical orbitals whose radial component is truncated beyond a certain cutoff radius,17and the description of extended vacuum regions be-comes a delicate numerical problem. In fact in the extreme case of a vacuum region extending well beyond all the cutoff radii, all matrix elements between the tip and the sample vanish and the tunneling current is identically zero. Improve-ments can be obtained by populating the vacuum region with empty orbitals共basis functions not associated to a pseudopo-tential兲. However for sensitive calculations of tiny tunneling currents the actual position of the empty orbitals can deeply affect the results, most typically by creating spurious current oscillations as a function of the tip-to-sample distance. Therefore we limit our method to tip-to-sample separation smaller than 6 Å for which reliable calculations do not need empty orbitals in the vacuum. We call this limit the quasi-contact limit.
We can summarize this discussion by saying that, while the TH approach is ideal for large tip-to-sample separations, the NEGF scheme becomes competitive for problems where the interaction of the sample with the tip is relevant. How-ever when choosing the method for performing STM simu-lations one has also to remember that the NEGF scheme is considerably more computationally intensive than the TH one. In fact, to calculate both topographic and dI/dV maps using NEGF it is necessary to repeat a full self-consistentI-V
An example of experiments where the tip-to-molecule in-teractions are believed to be important is that performed by Pflaum et al.19 in which a monolayer of alkanethiol mol-ecules is deposited on a gold surface, and the transport prop-erties are then probed by using a STM setup. The obtained zero-bias conductance is low, being on the order of 10−7G0at
zero bias共the quantum conductanceG0 is defined as 2e2/h,
witheas the electron charge andh as the Planck constant兲.
The I-V curves are asymmetric, and this asymmetry in-creases noticeably when the terminating CH3 group is re-placed by a CF3 one. It is speculated that the additional
asymmetry of the CF3-terminated molecule is due to a
rear-rangement of the charge distribution near the end of the mol-ecule caused by the high electronegativity of the F atoms. This in turn generates an electrostatic force between the STM tip and the molecule, the direction of which depends on the electrostatic potential at the tip. Such interaction causes the molecule to be either repelled or attracted by the tip depending on the bias polarity and creates the asymmetry in the I-V.
Calculations using the TH method have been performed for pentanethiol molecules on gold.20However, the nature of the TH method requires a large tip-to-molecule separation, and the current obtained in these calculations is an order of magnitude smaller than that observed in the experiments. In this work, the mechanism behind the asymmetry in theI-V
curves of CH3- and CF3-terminated alkanethiol molecules on
gold is explored with NEGF-DFT. The issue related to the electrostatic interaction between the tip and the sample is investigated in an approximate way. First we calculate from equilibrium DFT the electrical dipole on the molecules. Then we use classical electrostatic theory to determine the equilib-rium position of the molecule with respect to the tip. Finally new transport calculations are carried out for the newly esti-mated atomic positions.
II. COMPUTATIONAL METHOD AND NUMERICAL DETAILS
STM transport measurements are equivalent to calculating the two-probe I-V curve of a molecule sandwiched in be-tween two metallic electrodes. One electrode represents the surface to which the molecule is attached and the other is the STM tip. The NEGF scheme partitions such system into three regions, respectively, the two current/voltage electrodes 共leads兲and a middle region called the scattering region共SR兲 共see Fig.1兲.
The SR includes both the molecule and a portion of the leads, and it is extended enough so that charge density cal-culated at the most external atomic layer resembles that of the bulk electrodes. The leads, which are assumed to be pe-riodic crystals in the transport direction, are kept at different chemical potentials 1/2=EF⫾eV/2 where V is the applied
potential bias. We note that this is somewhat different from STM experiments, where typically the chemical potential of the surface remains fixed while a potential bias is applied to the probe. However, such a difference is simply a redefini-tion of the absolute posiredefini-tion of the energy scale and does not effect the shape of the I-V curve. The SR is described by a
HamiltonianHs. This is used to construct the nonequilibrium Green’s function
G共E兲= lim
→0关共
E+i兲−Hs−⌺1−⌺2兴−1, 共1兲
where⌺1/2are the self-energies for the leads, constructed by
semianalytical derivation21 from the electronic structure of the bulk.G共E兲enters in a self-consistent procedure to calcu-late the density-matrixof the SR and, hence, the two-probe current of the device.10–13,22The Hamiltonian for the scatter-ing region Hs is generally assumed to be a function of the
nonequilibrium charge-density, which is calculated follow-ing the NEGF prescription as
= 1 2
冕
−⬁⬁
G共E兲关⌫1f共E,1兲+⌫2f共E,2兲兴G†共E兲dE, 共2兲
where ⌫1/2=i关⌺1/2−⌺1†/2兴. In practice, this integral is
per-formed by splitting it into two parts:10–13,22 an equilibrium part to be performed along a contour in the complex plane, and a nonequilibrium part to be evaluated along the real energy axis but that contributes only aroundEF. Finally, the
converged Green’s function can be used to calculate the two-probe current, I, through the device
I=2e
h
冕
−⬁ ⬁Tr关G共E兲⌫1G†共E兲⌫2兴关f共E,1兲−f共E,2兲兴dE.
共3兲
This is effectively the integral between 1 and 2 共the
bias window兲 of the transmission coefficients T共E兲
= Tr关G共E兲⌫1G†共E兲⌫2兴.
The NEGF scheme is general and not related to a particu-lar electronic structure theory. In the case of SMEAGOL,10,11 the electronic structure method used is DFT共Ref.14兲in the SIESTAimplementation. In particular in this work we will use the local density approximation15共LDA兲of the exchange and correlation functional.
We use standard scalar-relativistic pseudopotentials with the following reference configurations: H 1s1, C 2s22p2, S 3s23p4, and F 2s22p5. A simplified 6s-only bandstructure
for Au is used for all the transport calculations in order to reduce the computational overheads. In this case the Au pseudopotential is constructed with the reference
configura-G(E)
H[ ]ρµ
1µ
2s
Scattering Region
[image:2.609.350.518.67.142.2]Left Lead Right Lead
tion 6s1, while the d electrons are left in the core and non-linear core corrections are applied. We note that in general the description of Au by using 6s orbitals only should be taken with care. However this becomes a necessity here, where the additional computational overheads required by including the d shell in the valence make the calculations impractical. In a previous publication we have investigated the consequences of this drastic approximation on the trans-port through aromatic rings. We concluded that the effects of havingd electrons included explicitly in the Au valence are negligible at least at moderate biases.23
The atomic basis set is constructed as follows H: DZ-s; C: DZP-s, DZP-p; S: DZP-s, DZP-p; F: DZP-s, DZP-p; and Au: DZ-s共the notation is SZ= single zeta, DZ= double zeta, and P = polarized兲.16The real-space grid has an equivalent cutoff energy of 200 Ry. The complex part of the integral leading to the charge density is computed by using 60 energy points on the complex semicircle, 48 points along the line parallel to the real axis, and 10 poles. The integral over real energies necessary at finite bias is evaluated over at least 512 points.10,11All the calculations are carried out with periodic boundary conditions in the direction perpendicular to that of the transport and mesh of fourkpoints.
III. RESULTS
A. Electronic structure of the molecules
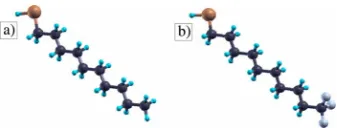
The molecules used in the experiments of Pflaumet al.19 are both methyl-terminated and fluorine-terminated al-kanethiols. A range of different alkane chain lengths was used in that study, but most of the data were collected for decanethiols 关see Figs. 2共a兲 and2共b兲兴. Decanethiol consists of an alkane chain of ten carbon atoms terminated with a thiol共-SH兲group. The sulfur atom in the thiol group forms a strong bond with gold and anchors the molecule to the sur-face forming a well-ordered self-assembled monolayer.
The orbital resolved density of states共DOS兲 for isolated decanethiol, both CH3- and CF3-terminated, is shown in Fig.
3. The energy gap between the highest occupied molecular orbital共HOMO兲and the lowest unoccupied molecular orbital 共LUMO兲 is in both cases rather large共⬃5 eV兲.24 Most im-portantly the DOSs of the two frontier molecular orbitals do not have large amplitude over the C atoms forming the de-canethiol but are rather localized on the states of S per-pendicular to the molecule axis关see Figs.3共b兲and3共d兲兴. In the case of CF3termination the F contribution to the DOS is
only confined to part of the LUMO and to low-energy HOMO levels. The orbital nature of the HOMO and LUMO
is further investigated in Fig. 4 where we present the local DOS for the CH3-terminated molecule 共the one for the
CF3-terminated case is rather similar and it is not presented
here兲.
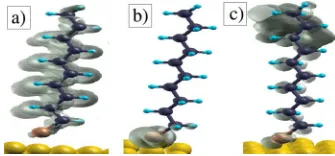
We note that both the HOMO and the LUMO have am-plitude mainly around the thiol group with little charge spread over the alkane chain. One should therefore expect little conductance through those states. In contrast the first state below the HOMO共HOMO-1兲 关Fig.4共a兲兴 appears as a delocalized state and it is expected to conduct efficiently. From this analysis we conclude that the HOMO-1 of the actual molecules corresponds to the delocalized HOMO of the parental polyethylene infinite chain, while the HOMO is associated to the anchoring thiol group.
[image:3.609.89.258.67.131.2]In order to better understand the transport across de-canethiol, in Fig.5we present both the real and the complex bandstructures for the parental infinite polyethylene chain, calculated as described in Ref.21. This has been obtained by inserting C2H4 into a large supercell, whose lateral dimen-sions 共10.58⫻10.58 Å兲 are enough to isolate the periodic images of the molecule. We have then performed two types of calculations. In the first 关Fig.5共a兲兴we have included, in addition to the already mentioned basis set, a number of supplementary basis functions in the vacuum region of the
FIG. 2. 共Color online兲 Decanethiol molecule with共a兲CH3and
共b兲CF3end-group. Color code: C = black, S = dark gray共brown on-line兲, H = light gray共blue online兲, and F = dark gray共purple online兲.
0 1 2 3 4
DOS
(arb.
units)
S C H
0 1 2 3 4
DOS
(arb.
units
)
Sπ Cπ
-8 -6 -4 -2 0 2 4
E - EF(eV) 0
1 2
3 F
-6 -4 -2 0 2 4
E - EF(eV) 0 1 2 3
(a)
(b)
[image:3.609.333.535.69.227.2](d)
(c)
FIG. 3. 共Color online兲 Orbital-resolved DOS for the isolated decanethiol molecule. Panels共a兲and 共b兲 are for the CH3 termina-tion, while panels共c兲and共d兲are for the CF3. In panels共b兲and共d兲 only the DOS corresponding toorbitals perpendicular to the mol-ecule axis are displayed.
[image:3.609.347.519.593.665.2]supercell. Such basis functions are constructed as DZP-s or-bitals by using the C pseudopotential and they are distributed over a 5⫻5⫻3 mesh in the supercell. The HOMO-LUMO gap for such a calculation is about 6.3 eV, a value which agrees reasonably well with that calculated with plane-wave basis set,25but it is considerably smaller than the value of 10 eV obtained previously with a localized basis set.26
The difference is attributed to the fact that the molecular LUMO is actually unbound so that free-electron-like vacuum states appear at midgap.25 As a result the actual HOMO-LUMO gap of polyethylene chains is between the molecular HOMO and the first vacuum level. Importantly, unless addi-tional basis functions are introduced into the vacuum, algo-rithms based on localized basis set do not capture such vacuum states. This is shown in Fig. 5共b兲, where the same calculation is repeated without basis functions in the vacuum. Now the HOMO-LUMO gap is that between levels with amplitude localized entirely over or near the molecule, and it is considerably larger than the HOMO-vacuum gap. This means that such a reduced basis set cannot properly describe vacuum states. The calculations shown in Fig.5共a兲 instead use a basis capable of describing energy levels well extended into the vacuum and therefore agree with the plane-wave results, at least for small Im共k兲 共these are the ones relevant for transport兲.
Importantly the vacuum levels become irrelevant for the two-probe transport calculations in the bias range described here. In fact the position of the vacuum is set by the Fermi level of the electrodes and their work function. Here the polyethylene HOMO positions are at about 4 eV below EF
共see the next section兲, which means that the first vacuum level will appear at energies larger thanEF+Au, whereAu
is the gold work function. Since Au is about 5 eV no
vacuum states can appear in the bias window for voltages smaller than 5 V. Since here we limit our analysis to voltages smaller than 2 V 共for both the current polarities兲 we can conclude that vacuum states can be safely neglected. For this reason we do not include any basis functions in the vacuum
region of the supercell. This last approximation is further validated by the fact that the complex band structure around the Au Fermi level共of HOMO-LUMO nature兲is essentially equally well described by a calculation which neglects any basis function in the vacuum关compare Figs.5共a兲and5共b兲兴.
B. Transport properties of the molecules on gold surfaces
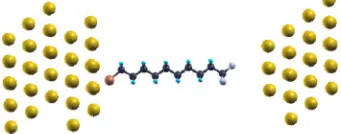
In order to calculate the transport properties, we attach the molecules to the Au fcc 共111兲 hollow site via a terminating thiol group at a sulfur-surface distance of 1.9 Å.27This is the equilibrium distance measured for the hollow site configuration.28The arrangement of the molecule on the sur-face and the relative position of the tip are shown in Fig. 6 for the CF3-terminated molecule. The configuration for the
CH3-terminated case is similar and it is not displayed here. In the experiments from Pflaum et al.19 CH3-terminated
de-canethiols are tilted at an angle of ⬃32° from the vertical direction, while for CF3-terminated the tilting angle is
⬃39°.19 Our simulation cells however have the molecules placed perpendicular to the surface. This allows the unit cell used to be smaller than that required for simulating such tilting angles, and the computational overheads are greatly reduced. We also make some approximations in modeling the STM tip. First of all we consider a gold tip instead of the used tungsten or platinum-iridium ones in such a way to avoid issues related to having two electrodes with different work functions. In doing this we describe the electronic structure of the electrodes with a 6s-only basis set, which was proven to provide a reasonably accurate choice for trans-port calculations at only a moderate computational cost.23,32 Second we do not consider an atomically sharp tip but a slightly blunter one. This geometry improves the stability of the calculations, allowing the self-consistent convergence to be quicker and more reliable.
[image:4.609.89.258.68.188.2]As expected the tunneling current is extremely sensitive to the distance between the tip and the molecule so that it is rather difficult to determine from experiments the precise tip vertical position. Our working strategy is then to adjust this distance to match the magnitude of the current obtained in experiments. Such a tuning exercise is presented in Fig. 7 where we show the I-V curves for different tip-to-molecule separations, where these are defined as the distance between the terminating surface of the tip and the C atom in the CH3
FIG. 5. 共Color online兲Real共positivek兲and complex共negative
k兲bandstructures for a C2H4polymer infinite chain:共a兲calculations obtained by including basis functions into the vacuum region; 共b兲 calculations obtained with basis functions positioned only over the molecule. Note in both cases the semicircular complex band joining the molecular HOMO and LUMO. Moreover, when basis functions are included into the vacuum paraboliclike bands associated to free-electron-like states appear in the band gap. Thekvector is measured in units of/c, wherec= 2.5 Å is the supercell lattice vector in the
zdirection.
FIG. 6. 共Color online兲Simulation cell used in the transport cal-culations: a CF3-terminated decanethiol molecule is attached to gold surface and probed with a Au STM tip. The case of the CH3-terminated molecule is similar and it is not displayed here. Color code: Au= gray 共yellow online兲, C = black, S = dark gray
共brown online兲, H = light gray 共blue online兲, and F = dark gray
[image:4.609.352.523.73.140.2]group. From the figure one can deduce that the best match is obtained for a distance of 5.25 Å. This corresponds to a Au-H 共Au-F兲 distance of 4.62 Å 共4.42 Å兲, which is about 2 Å longer than the Au-S distance 共2.53 Å兲 at the thiol termination. The results presented in the rest of this section are obtained for this tip-to-molecule separation.
The orbital resolved DOS for both CH3- and
CF3-terminated decanethiol on Au is shown in Fig. 8. In
general and for both the molecules the HOMO, now broad-ened by the interaction with the surface, is relatively close to the goldEF. However, a closer look at its local DOS共this is
calculated as the local DOS over an energy window corre-sponding to the HOMO level兲 depicted in Figs. 9 and 10 reveals that such a state is mainly localized around the S atoms of the thiol groups. The delocalizedorbitals capable of efficient charge transport across the molecule 共HOMO-1 of the thiol-linked molecules and HOMO of the polyethylene chain兲are further away from the Fermi level共approximately 4 eV兲. This essentially sets the position of the polyethylene HOMO at about 4 eV below the Au Fermi level, in substan-tial agreement with previous plane-wave calculations.29
It is also interesting to observe the effects that the differ-ent terminating groups 共CH3 and CF3兲 have over the
elec-tronic structure of the HOMO-1 level. The most notable dif-ference is associated with the charge-density distribution along the CH2groups forming the decanethiol. While in the
case of CH3 termination the electron charge distributes
al-most uniformly over CH2 up to near the terminating CH3
group, in the case of CF3-terminated molecule there is a
strong modulation with a decay of the charge density as the CF3group is approached. This is due to the Coulomb
repul-sion from the more electronegative CF3 group. Such an
electrostatic-driven charge decay is reminiscent of the same effect investigated by STM for molecules on surfaces in the presence of point charges.30
Despite these differences the absence of any extended molecular orbital near the Fermi level of gold is common to both molecules, and therefore we expect just a tiny tunnel current at low bias. This can be appreciated by looking at both the transmission coefficients,T共E兲 共Fig.11兲and theI-V
curves共Fig.12兲. There is a large gap in the resonances in the zero-bias transmission coefficients of about 5 eV on each side of the Fermi level with the edges of such a gap corre-sponding to the HOMO-1共HOMO of polyethylene兲and the LUMO, respectively, below and above the Au Fermi energy. The transmission of the HOMO provides only a small shoul-der inT共E兲 共T⬃10−6兲at about 2.5 eV belowE
F, confirming
that the HOMO does not provide an efficient transport chan-nel at resonance. However, since the HOMO is the first mo-lecular level to enter the bias window共at least for one of the
-1 -0.5 0 0.5 1
V(Volts)
-200 -100 0 100
I
(pA) 4.25Å4.75Å
4.95Å 5.05Å 5.25Å Exp.
-1 -0.5 0 0.5 1
V(Volts) -30
-20 -10 0 10 20
I
(p
A)
[image:5.609.351.519.69.147.2](a)
(b)
FIG. 7. 共Color online兲 I-V curves for CH3-terminated de-canethiol attached to a gold surface for different distances between the C atom in the CH3 group and the probing tip. Changing this distance by 0.1 Å causes the size of the current to change by ap-proximately one order of magnitude at 1 V. Panel共b兲is a zoom of panel共a兲in the current range between关−30, 20兴 pA.
0 1 2 3 4
DOS
(arb.
units)
S C EF
0 1 2 3 4
DOS
(arb.
units
)
Sπ Cπ EF
-8 -6 -4 -2 0 2 4 6 E - EF(eV)
0 1 2
3 F
-6 -4 -2 0 2 4 6 E - EF(eV)
0 1 2 3
(a)
(b)
(c)
(d)
FIG. 8. 共Color online兲Orbital-resolved DOS for the decanethiol molecule attached to the gold surface. Panels共a兲and共b兲are for the CH3termination, while panels共c兲and共d兲are for the CF3. In panels
共b兲and共d兲only the DOS corresponding toorbitals perpendicular to the molecule axis are displayed for C and S, while in panel共d兲all the fluorineorbitals are shown. The HOMO-LUMO gap is large, although the HOMO is about 1 eV belowEF.
FIG. 9. 共Color online兲 Local DOS isosurface for the CH3-terminated decanethiol molecule on the Au共111兲surface:共a兲 the HOMO-1 level,共b兲the HOMO level, and共c兲the LUMO level. Note how the HOMO is localized around the thiol end-group and it is not expected to conduct efficiently. Color code: Au= gray共yellow online兲, C = black, S = dark gray共brown online兲, and H = light gray
共blue online兲.
[image:5.609.70.273.70.155.2] [image:5.609.70.270.504.660.2] [image:5.609.352.518.570.665.2]two current polarities兲, it is expected to dominate the low-bias region of theI-V.
Moving our attention to theI-Vcurves and the differential conductances shown in Fig.12, the most noticeable feature is their asymmetry. In particular conductance at positive bias is between about two to three times smaller than that for nega-tive bias. Moreover we observe that the conductance of CH3-terminated molecules is both larger and more
asymmet-ric than that of CF3-terminated.
The reason for the conductance asymmetry is rooted in the different electronic coupling strength between the mol-ecule and the gold surface as compared to the much weaker one between the molecule and the STM tip. The S atom in fact forms quite a strong bond with the gold surface, whereas the tip is separated by a vacuum region which provides a substantial potential barrier. Such difference in coupling per-sists to rather close tip-to-molecule separations since both the CH3 and CF3end-groups do not bind to the Au tip. The
mechanism leading to the asymmetry is then illustrated in the cartoon of Fig. 13共a兲. Because of the different coupling strengths of the two electrodes with the molecule, electrons are easily transferred from the substrate to the molecule, but they find it much more difficult to hop to the tip. This means that the occupation of the molecule is determined by the chemical potential of the substrate and that the molecule gains electronic charges when the electron flux is from the surface to the tip共negative bias according to our definition兲. In contrast the molecules lose charge when the flux is in the other direction 共positive bias兲. Since charging produces a shift in the molecular electronic states toward higher energies
one expects the HOMO to move into the bias window at negative voltages and away from it at positive ones. The same behavior is expected for the HOMO-1, while the LUMO follows exactly the opposite pattern 共it moves into the bias window for positive bias and away from it for negative兲.31
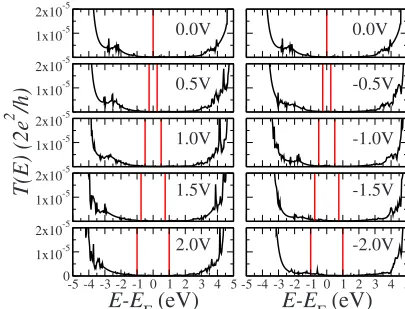
The electrostatic evolution of the system under bias is illustrated in Figs. 14 and15 where we show the transmis-sion coefficients as a function of energy for different volt-ages. Clearly the behavior is the one expected by our simple electrostatic model with an upshift 共downshift兲 in energy of the molecular levels at negative 共positive兲 bias. Since the highly conducting HOMO-1 and LUMO levels never enter the bias window in this voltage range共limited to⫾2 Volt兲, the onset of the current is solely determined by the position -10 -5 0 5 10
E - EF(eV)
10-7 10-6 10-5 10-4 10-3 10-2 10-1
T
(E
)
-10 -5 0 5 10
E - EF(eV)
10-7 10-6 10-5 10-4 10-3 10-2 10-1
T
(E)
[image:6.609.333.535.68.197.2](a)
(b)
FIG. 11. Transmission coefficients at zero bias for decanethiol attached to gold surface and terminated with 共a兲CH3and共b兲CF3 end-group. Note the gap in the transmission of about 5 eV on either side of the Fermi level.
-2 -1 0 1 2
V(Volts)
-80 -60 -40 -20 0 20
I
(p
A) CH3
CF3
-2 -1 0 1 2
V(Volts)
0 10 20 30 40 50 60 70
d
I/
d
V
(p
A/V)
(a)
(b)
FIG. 12. 共Color online兲 共a兲 I-V curve and共b兲 differential con-ductance for decanethiol molecules terminated with both CH3and CF3 groups. Note the bias asymmetry, with the conductance at negative bias being two to three times larger than that for positive bias. The conductance is lower for the CF3-terminated molecule than that of the CH3-terminated.
+
CF3
+
CF3
Tip +
Tip
Surface
Tip Surface
Tip Negative Bias
Positive Bias
[image:6.609.62.283.68.162.2]b) a)
FIG. 13.共a兲Schematic energy-level diagram of the STM geom-etry. Since the molecule is more strongly coupled to the surface than to the tip its occupation is determined by the surface chemical potential; i.e., it will charge for negative bias and decharge for positive. Such a charging mechanism produces a shift of the occu-pied molecular level toward higher 共lower兲 energy for negative
共positive兲bias.共b兲Cartoon showing the electrostatic interaction be-tween tip and molecule CF3 end-group. In this case there is an electric-dipole forming, so that the molecule will be attracted or repulsed by the STM tip, depending on the bias polarity.
1x10⁻⁵ 2x10⁻⁵
1x10⁻⁵ 2x10⁻⁵
1x10⁻⁵ 2x10⁻⁵
T(E)
(2e
2
/h)
1x10⁻⁵ 2x10⁻⁵
-5 -4 -3 -2 -1 0 1 2 3 4 5
E-E
F(eV)
01x10-5 2x10⁻⁵
-5 -4 -3 -2 -1 0 1 2 3 4 5
E-E
F(eV)
0.0V
0.5V
1.0V
1.5V
2.0V
0.0V
-0.5V
-1.0V
-1.5V
-2.0V
[image:6.609.333.536.515.670.2] [image:6.609.72.273.585.672.2]of the HOMO. This however can enter the bias window only for negative bias explaining the current asymmetry. Further-more, since the transmission of the HOMO for CH3-terminated decanethiol is larger than that of the CF3-terminated case, the conductance of CH3decanethiol is both larger and more asymmetric than that of its CF3-terminated counterpart.
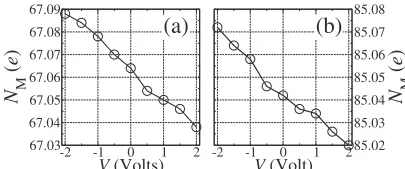
Finally, in Fig. 16we present the total Mülliken popula-tion,NM, of the molecule as a function of voltage. The figure
provides quantitative evidence for the charging of the mol-ecule as a function of bias and one can observe a total charge variation of about 0.05e over the entire bias range of 4 V. Interestingly, and despite the different terminating groups, the charge variation with bias is essentially identical for the two terminations.
C. Influence of the tip-to-molecule electrostatic interaction over the transport
As concluded in the previous section, the asymmetry of the conductance with respect to the bias direction found in our calculations is due to the asymmetry in the electronic coupling of the molecule to the leads. Interestingly a strong asymmetry was also observed in the experimental
conduc-tance measurements for the same molecules.19 However, in the experiments, CF3-terminated molecules displayed a far
more pronounced asymmetry than the CH3-terminated ones.
This is in contrast with our findings where the asymmetry is similar, and in fact it is more pronounced for the CH3-terminated case. In agreement with the initial
sugges-tion from Pflaum et al.,19 here we argue that this additional asymmetry is not of electronic origin but rather is connected to the electrostatic interaction between the tip and the mol-ecule under bias. This repositions the molmol-ecule with respect to the tip, effectively changing the tunneling current.
The main idea is illustrated schematically in Fig. 13共b兲. The large electronegativity of the F atoms in the CF3group is
expected to displace a substantial net charge toward the end of the molecule. This then interacts electrostatically with the surface charge of the STM tip, either repelling or attracting the molecule depending on the bias polarity. Such a charge displacement is illustrated in Fig. 17 where we show the charge excess with respect to neutrality, ⌬N, as calculated from the Mülliken population as a function of the position along the molecule axis. In our notation ⌬N⬎0 共⌬N⬍0兲
indicates a negatively 共positively兲 charged portion of the molecule. Substituting H by F atoms causes an increase in the occupation of the endmost carbon atom, although the F atoms show a net positive charge. Overall the total net charge on the CF3 group is negative 共it posses extra electrons兲,
whereas the total net charge on the CH3group is positive. In
addition the two end-groups produce an electrical dipole with opposite sign and different magnitude, with that associ-ated with CF3 being the largest. Finally it is important to
observe that by large the charge distribution over the mol-ecule is not affected by the external electric field so that⌬N
is almost bias independent for both the terminations. We estimate the forces acting on the molecule by using simple classical electrostatic theory. In the case of CH3-terminated decanethiol we calculate a force of 3 ⫻10−3 eV Å−1in the direction of the tip at the positive bias
of 2 V, and 2⫻10−3 eV Å−1in the direction of the substrate
at the negative bias of 2 V. These have to be put in relation with the elastic forces needed to stretch the molecule. DFT calculations performed usingSIESTAdemonstrate that the tip-to-molecule electrostatic force at positive bias causes the
1x10⁻⁵ 2x10⁻⁵
1x10⁻⁵ 2x10⁻⁵
1x10⁻⁵ 2x10⁻⁵
T(E)
(2e
2
/h)
1x10⁻⁵ 2x10⁻⁵
-5 -4 -3 -2 -1 0 1 2 3 4 5
E-E
F(eV)
0 1x10⁻⁵ 2x10⁻⁵
-5 -4 -3 -2 -1 0 1 2 3 4 5
E-E
F(eV)
0.0V
0.5V
1.0V
1.5V
2.0V
0.0V
-0.5V
-1.0V
-1.5V
[image:7.609.333.535.66.222.2]-2.0V
FIG. 15. 共Color online兲Transmission coefficients as a function of energy for different biases for CF3-terminated decanethiol. Note how the resonances in the transmission coefficients due to the oc-cupied states move up in energy closer to the bias window at nega-tive bias and move away from the bias window for posinega-tive bias. The vertical lines mark the bias window.
-2 -1 0 1 2
V(Volts)
67.03 67.04 67.05 67.06 67.07 67.08 67.09
N M
(
e
)
-2 -1 0 1 2
V(Volt)
85.02 85.03 85.04 85.05 85.06 85.07 85.08
N M
(
e
)
(a)
(b)
FIG. 16. Mulliken populations for decanethiol molecule termi-nate with 共a兲 CH3 and 共b兲 CF3 groups and attached to the gold surface. Note how in both cases the occupation of the molecule drops as the bias increases from negative to positive.
-5 0 5 10 15 20
Position (Å)
-0.15-0.1 -0.05 0 0.05 0.1 0.15
∆
N
(
e
)
CH3: -2V -1V 0V 1V 2V CF3: -2V -1V 0V 1V 2V
CF3
CH3
[image:7.609.71.273.70.224.2]S
[image:7.609.69.272.608.693.2]molecule to stretch by about 0.002 Å, while at negative bias the compression is on the order of 0.001 Å 共at ⫾2 V兲. Similarly, the force acting on the CF3group is calculated to be on the order of 3⫻10−3 eV Å−1 in the direction of the substrate when a positive bias of 2 V is applied, and on the order of 4⫻10−3 eV Å−1in the direction of the tip at a nega-tive bias of 2 V. These forces are in the opposite direction to those on the CH3 termination due to the opposite
direc-tions of the two dipoles. Again DFT calculadirec-tions for CF3-decanethiol indicate that the force at positive bias causes
the molecule to compress by about 0.001 Å, and the force at negative bias to stretch by 0.002 Å. These length changes are of the same magnitude for both types of end-group, but they occur at opposite bias directions due to the opposite direction of the electrostatic force in the two cases.
The stretching 共or compressing兲 of the molecule under bias alters the tip-to-molecule separation, which in turn af-fects the magnitude of the current. Let us look at the CH3 case first. At positive bias the molecule is stretched so that its end is closer to the STM tip, the tip-to-molecule separation is reduced and the current will increase. In contrast at negative bias, the molecule is compressed and a reduction in the cur-rent is expected. Since the curcur-rent obtained from our calcu-lations at negative bias is larger than that for positive bias, such a change in molecule length would contribute to reduc-ing the I-V asymmetry in agreement with the experimental results. However, a quantitative estimate of the changes in the I-V curve as a function of the molecule compression/ expansion reveals that molecular displacements of this tiny magnitude 共a few percent of Å兲 are insufficient to make a noticeable change to theI-V.
The results for CF3-terminated decanethiol are similar. At positive bias, the molecule is compressed so that the CF3
group is further away from the STM tip, while at negative bias the molecule is stretched and the tip-to-molecule sepa-ration is reduced. Since the current calculated at negative bias is larger than that at positive bias, the electrostatic inter-action in this case has the effect of enhancing the asymmetry of the I−V curves. This is also consistent with the experi-mental results, showing a larger asymmetry in the transport for the molecule terminated with the CF3 group. However,
similar to the CH3-terminated case, the estimated molecule length change is insufficient to make a noticeable modifica-tion to the I-V curve. Note that these negative estimates are all obtained by comparing the geometry at zero bias with that corresponding to the largest displacement共at⫾2 V兲, so that they should be considered as the upper bound for the current changes. Therefore we can safely conclude that changes in molecule length can hardly be at the origin of the experimen-tally observed asymmetry in theI-Vcurve.
A further possibility is to consider changes in the bonding angle between the molecule and the substrate. As mentioned before, decanethiols do not arrange vertically to the surface, but they rather form angles of 32 and 39°, respectively, for the CH3 and CF3 terminations.19 Hence it is likely that the
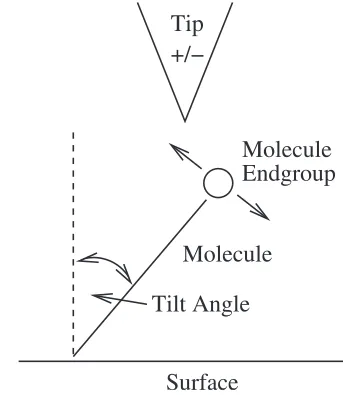
interaction between the STM tip and the end-groups causes the molecule to rotate either away from or toward the STM tip, as shown in Fig. 18. The direction of the rotation de-pends again on the sign of the electrostatic force. However since the energy required to change the bonding angle is
expected to be rather smaller than that required for an axial distortion, we expect changes in bond angle to produce larger changes in the tip-to-molecule separation.
Using the same electrostatic forces calculated before we estimate for the CH3 termination a 1° rotation toward the
STM tip at positive bias共2 V兲, and a 0.5° rotation toward the surface at negative bias共−2 V兲. Similarly for the CF3 termi-nation, the rotations are along the opposite direction with changes in the bond angle of 0.5° toward the surface at posi-tive bias and 1° toward the STM tip at negaposi-tive bias. These rotations are sufficient to alter the I-V characteristics, as shown for both types of molecule in Fig. 19.
In the case of CH3 termination the calculated rotation is
actually sufficient to suppress the asymmetry in the I-V
present because of the asymmetric coupling to the electrodes. The current at 1 Volt is now larger for positive bias than that at the same negative bias. In contrast for CF3-terminated
Tilt Angle
Molecule
Endgroup
Molecule
[image:8.609.344.516.68.266.2]Surface
Tip
+/−
FIG. 18. Schematic illustration showing the tilting angle of the molecule over the Au surface and the rotation due to the interaction with the STM tip.
-20 -10 0 10 20
I
(pA)
No Angle Change Angle Change
0 5 10 15 20
d
I/
d
V
(pA/V)
-1 -0.5 0 0.5 1 V(Volts)
-20 -15 -10 -50 0 5 10
-0.5 0 0.5 1 V(Volts)
0 5 10 15 20
(a)
(b)
(d)
(c)
FIG. 19. 共Color online兲I-Vcurves and differential conductance as a function of bias obtained both with and without considering the effects of the electrostatic-induced rotation of the molecule. Panels
[image:8.609.330.537.522.682.2]molecules, the rotation is such that the I-V asymmetry al-ready present is enhanced. Thus, when the electrostatic-induced rotation of the molecule is taken into account, the
I-V curve for the CF3-terminated molecule appears as more
pronounced than that obtained for the CH3-terminated one, in semiquantitative agreement with experiments.19
In concluding we wish to point out a few possible sources of error in our calculations, which might affect a fully quan-titative comparison with experiments. First we remark that the Au atoms of both the tip and the substrate are described at the 6s-only level. This provides a good description of the Au Fermi surface, thus of the transport properties, but usu-ally it does not provide accurate interatomic forces. Second the calculated forces between the molecule and the tip cer-tainly depend on the actual shape and detailed position of the tip. These are difficult to characterize with certainty and er-rors are therefore difficult to avoid. Finally the actual value of the tilting angle depends on the intermolecular interaction is the self-assembled monolayer, and thus the force required to change the angle would depend on the details of the mo-lecular coverage共density, symmetry, bonding site, etc.兲.
IV. CONCLUSION
We have demonstrated that the DFT-NEGF code SMEAGOLcan be used to simulate STM-type experiments in the near to contact regime. This is under the working condi-tion of the tip-to-sample distance being sufficiently small that the basis orbitals have not been artificially cut off共i.e., the vacuum region between the tip and the surface is still well described兲.SMEAGOLthen allows us to investigate sys-tems in which the tip interacts with the molecule, and to study effects of finite bias on the electronic structure of the molecule.
Calculations for alkanethiol molecules with STM-type arrangements show strong asymmetry in the I-V curves, which can be explained by the asymmetry in the coupling to the two different electrodes 共substrate and tip兲. However, the calculated asymmetry is similar for both CH3- and CF3-terminated decanethiols, in contrast to the experimental
measurements, showing a far stronger asymmetry for the case of CF3termination. We have then investigated the
origi-nal suggestion, which attributed the asymmetry to small con-figurational changes in the molecule under bias due to elec-trostatic interaction between the tip and the substrate. Our calculations demonstrate that changes to molecule length are too small and are unlikely to have any major impact on the
I-V curves; however, a rotation of the molecule may cause significant changes to the current.
As a final remark we point out that the results presented in this work have been obtained by using the LDA. However, LDA has several shortfalls which can strongly affect electron-transport calculations. In this case, approximate self-interaction corrections such as the atomic self-interaction correction共ASIC兲 共Refs. 23,32, and33兲are un-likely to offer a substantial improvement, since the conduc-tance is due to off-resonance tunneling, and would not be particularly sensitive to the exact position of the molecular orbitals. However, for these molecules, an accurate calcula-tion of the electric polarizability beyond the LDA might be important.34
ACKNOWLEDGMENTS
We thank G. Scoles for having driven our attention to the experiments discussed in this paper. This work was funded by Science Foundation of Ireland 共Grant No. 07/IN.1/I945兲. Computational resources have been provided by the HEA IITAC project managed by the Trinity Center for High Per-formance Computing and by ICHEC.
*Present address: Dresden University of Technology, Dresden, Ger-many.
1G. Binnig, H. Rohrer, Ch. Gerber, and E. Weibel, Appl. Phys.
Lett. 40, 178共1982兲; Phys. Rev. Lett. 49, 57共1982兲.
2F. Meier, L. Zhou, J. Wiebe, and R. Wiesendanger, Science 320,
82共2008兲.
3M. F. Crommie, C. P. Lutz, and D. M. Eigler, Science 262, 218
共1993兲.
4B. Xu and N. J. Tao, Science 301, 1221共2003兲.
5X. Xiao, B. Xu, and N. J. Tao, Nano Lett. 4, 267共2004兲. 6R. Temirov, A. Lassise, F. B. Anders, and F. S. Tautz,
Nanotech-nology 19, 065401共2008兲.
7F. Pump, R. Temirov, O. Neucheva, S. Soubatch, S. Tautz, M.
Rohlfing, and G. Cuniberti, Appl. Phys. A 93, 335共2008兲. 8J. Bardeen, Phys. Rev. Lett. 6, 57共1961兲.
9J. Tersoff and D. R. Hamann, Phys. Rev. Lett. 50, 1998共1983兲; Phys. Rev. B 31, 805共1985兲.
10A. R. Rocha, V. M. García-Suárez, S. Bailey, C. Lambert, J.
Ferrer, and S. Sanvito, Nature Mater. 4, 335共2005兲.
11A. R. Rocha, V. M. García-Suárez, S. Bailey, C. Lambert, J.
Ferrer, and S. Sanvito, Phys. Rev. B 73, 085414 共2006兲; SMEAGOLis available at www.smeagol.tcd.ie.
12M. Brandbyge, J.-L. Mozos, P. Ordejón, J. Taylor, and K.
Stok-bro, Phys. Rev. B 65, 165401共2002兲; J. Taylor, H. Guo, and J. Wang,ibid. 63, 245407共2001兲.
13S. Datta, Electronic Transport in Mesoscopic Systems 共 Cam-bridge University Press, CamCam-bridge, UK, 1995兲.
14H. Hohenberg and W. Kohn, Phys. Rev. 136, B864共1964兲. 15W. Kohn and L. J. Sham, Phys. Rev. 140, A1133共1965兲. 16J. M. Soler, E. Artacho, J. D. Gale, A. García, J. Junquera, P.
Ordejón, and D. Sanchez-Portal, J. Phys.: Condens. Matter 14, 2745共2002兲.
17J. Junquera, O. Paz, D. Sánchez-Portal, and E. Artacho, Phys.
Rev. B 64, 235111共2001兲.
18O. Paz and J. M. Soler, Phys. Status Solidi B 243, 1080共2006兲. 19J. Pflaum, G. Bracco, F. Schreiber, R. Colorado, Jr., O. E.
Shma-kova, T. R. Lee, G. Scoles, and A. Kahn, Surf. Sci. 498, 89
共2002兲.
21I. Rungger and S. Sanvito, Phys. Rev. B 78, 035407共2008兲. 22A. R. Rocha and S. Sanvito, Phys. Rev. B 70, 094406共2004兲. 23C. Toher and S. Sanvito, Phys. Rev. B 77, 155402共2008兲. 24Note that this is the LDA HOMO-LUMO gap calculated from
the Kohn-Sham eigenvalues. As such, in general it is not ex-pected to be a good estimate of the actual experimental gap, which is the difference between the ionization potential and the electron affinity of the molecule. In this case however the junc-tion is in a tunneling regime already at this LDA level and pos-sible corrections are expected to produce only minor quantitative changes to the calculated transport properties.
25F. Picaud, A. Smogunov, A. Dal Corso, and E. Tosatti, J. Phys.:
Condens. Matter 15, 3731共2003兲.
26J. K. Tomfohr and O. F. Sankey, Phys. Rev. B 65, 245105
共2002兲.
27The sulphur-surface distance is defined as the distance between
the S atom of the thiol group and the hollow position in the fcc
共111兲surface.
28H. Sellers, A. Ullman, Y. Shnidman, and J. E. Eilers, J. Am.
Chem. Soc. 115, 9389共1993兲.
29J.-G. Wang, E. Prodan, R. Car, and A. Selloni, Phys. Rev. B 77,
245443共2008兲.
30P. G. Piva, G. A. DiLabio, J. L. Pitters, J. Zikovsky, M. Rezeq, S.
Dogel, W. A. Hofer, and R. A. Wolkow, Nature共London兲 435, 658共2005兲.
31Note that in our transport calculation the bias window is
intro-duced by shifting the chemical potentials of both the tip and the substrate by ⫾eV/2. This is however completely equivalent to the standard STM setup where the sample potential is kept fixed and the voltage is applied to the tip. Note also that the definition of bias polarity in our work is opposite to that of Pflaumet al. 共Ref.19兲.
32C. Toher and S. Sanvito, Phys. Rev. Lett. 99, 056801共2007兲. 33C. D. Pemmaraju, T. Archer, D. Sanchez-Portal, and S. Sanvito,
Phys. Rev. B 75, 045101共2007兲.
34C. D. Pemmaraju, S. Sanvito, and K. Burke, Phys. Rev. B 77,