Physical Factors Affecting the Interior
Radon-Concentrations
Soliman M. S. Abdalla1, Saddig D. Jastaniah2
1Physics Department, Faculty of Science, King Abdulaziz University, Jeddah, KSA
2Diagnostic Radiology Department, Faculty of Medical Technology, King Abdulaziz University, Jeddah, KSA Email: soulimanabd@hotmail.com
Received December 2, 2012; revised January 5, 2013; accepted January 18, 2013
ABSTRACT
Researchers have realized that radon-contaminated air inside buildings is a principal way of human exposure to certain healthy-risks. A model is developed to estimate radon concentrations which consider various parameters: in indoor air radon (radon-222) concentration, air permeability of ground, air pressure difference between outdoor and indoor at ground level, ventilation of building ground and number of air changes per hour due to ventilation. The radon-222 transport into building might dominated by diffusion, pressure driven flow or/and a mixture of both depending on the actual values of the various parameters. So, in several and regular periods of time: January, April, July and October, radon-222 concentrations have been measured in ten rooms of five elementary schools and in five rooms of one high school at Qena city (Upper Egypt). This has been carried out using alpha scintillation counters. We have noticed that in three rooms the value has exceeded 200 Bq·m−3 at the basement and only one room at the first floor, and all values have changed with respect to time and localization: They have decreased from July to January and from basement to first floor. For example, radon-222 concentrations obtained by exposing track detectors varied in the range from 20 Bq·m−3 up to 100 Bq·m−3. The experimental results of the present work have been well fitted with the presented model (calcula- tions) which supports the validity of the presented model. So, to decrease the level of indoor air radon-222 concentra- tions and to reduce its harmful effects it is recommended to follow the suggestions in the present study and to limit as possible the use of ceramic in the building construction, increase the hours of ventilation and to restrict the use of un- derground floors in buildings, the underground Metro and garage parking should be carefully (and even mandatory) ventilated.
Keywords: Indoor Radon Concentrations; Theoretical Model; Environmental Parameters
1. Introduction
Radium (226Ra) decays naturally to radon-gas radon-222: They both are member of uranium series (238U). Ra- don222 is noble gas which can be released to soil pores; migrate to the ground surface without any chemical reac- tions; then it can accumulate in buildings. Radon is poi- sonous gas in air that comes from natural sources such as ground and can harm the environment and the human health. Radon exists ubiquitously in air (all over the globe) and in particular in the indoor of buildings of all kinds. USA environmental protection agency (EPA) es- timates that about 20,000 radon-related lung cancers oc- cur per one year. All acts of radon-222-inhaling (and daughter-products) are a major source of natural radia- tion exposure which leads to lung cancer [1]. Any person, anywhere she/he lives, no matter he will expose to ra- don-222 in the air that she/he inhale. Moreover, because radon-222 attach to aerosol particles, it is considered as one of the principal causes to lung cancer. Bergman et al.
the most important source of indoor radon-222 in Upper Egypt dwellings, while building material and household water from drilled wells are rarely the main cause of in- side-radon-222 concentrations which are in the average level of 200 Bq·m−3. In another work, it has been shown that radon in water and fertilizers have important effects on the environment [5-7]. The concentration of radon- 222 in water, building-ground or soil extends from less some thousands to more than some millions Bq·m−3 in soils abundantly rich in radium (radium-rich soils). Both ground and the air tightness of the foundation structure affect strongly the radon-222-concentration, for indoor radon-222 concentrations. Even invisible cracks in the foundation floor or very minute crakes in walls below the ground level may lead to important infiltration of ra- don-222 to the indoor air which affects drastically the safety parameters. Fleicher et al. [8] have demonstrated that homes, in nortern New York State, that are more air tight have three times the radon-222 levels greater than those of normal homes.
International interest exists of reducing the inside-ra- don-222 concentrations to a level as minimum as possi- ble. In different countries, Rahman and Tercy have re- viewed the radon-222 control systems [9]. It should be noted that the “low-levels” of radon-222 in some days might not have the low values the day after. Different analysis to pre-estimate (and to model) the inside-radon- 222 concentration is found in the scientific literature. For example, several authors have studied the different varia- tions of radon-222 concentrations (seasonal variations) with prediction through model calculations [10-13]. Also, pre-estimation due to premier calculations, after these models, demonstrate that there is some contribution from the building materials. So, to give a satisfied estimation to the radon-222 concentration based on various factors and as a consequence, one will gain some information about which counter measures should be effectuated, will be an essential tool in this domain. However, these mod- els have considered the inside-radon-222 concentrations either: By treating a part of some parameters or by pre- diction of some detailed and relatively complex equa- tions covering only certain sides of the total indoor-ra- don-222 problem. Here, we will take, initially, into con- sideration some different climatic parameters then we will establish a comprehensive, simplified and ready-to- use model for estimating the radon-222 concentration in indoor air and we will consider several factors that can affect the radon-222 concentration in indoor air:
1) Radon-222 concentration in ground;
2) Radon-222 diffusion resistance of radon-222 bar- rier-resistance;
3) Air permeance of ground;
4) Air pressure difference between outdoor and indoor ground levels;
5) Ventilation of the building and number of air changes due to ventilation;
6) Radon-222 transport into buildings might be domi- nated by diffusion, pressure driven flow or a mixture of both depending on the actual values of the different fac- tors;
7) Permeance of building materials which is a scale of ability of that material (or substance) to permit a con- tinuous and steady flow of matter (or energy); it is ex- pressed as the volume (number of liters) of gas diffused normally (at angle 90˚ with surface) in one hour through a square meter. Permeance is expressed in Liters/hour and denoted as P = μA/L [14]. To minimize the radon- 222 level concentration in indoor air, this model may be applied as a tool to select the effective and cheapest way to minimize the radon-222 level concentration in indoor air;
8) The data of the present contribution give evidence that the values of parameters (most of the transport of radon-222 from the building ground to the indoor air) are due to leakage driven by pressure differences through the construction.
2. Experimental Techniques
the cane [18]. The radon-222 detectors have been sus- pended at the center of the room-class. 8 detectors have been arranged in ordered-distribution all-over the class- room (at about 3 meters height). The exposure time, in all buildings, has been recorded from 15 June 2011 to 15 December 2011. Then, the detectors have been sub- jected to chemical processing in a 10 M analytical grade sodium hydroxide solution at 60˚C ± 1˚C, for 90 minutes, in a constant temperature water bath to enlarge the latent tracks produced by alpha particles from the decay of ra- don-222. Following the etching process, the detectors have been washed for half hour with tap water (running and cold). Then the detectors have been rewashed with distilled water and finally with a 50% water-alcohol so- lution. Some minutes drying in air, the detectors are now ready for tracking counting. An optical microscope (Zeiss at 400× magnification) can then be used to count the etched tracks. Their concentration is estimated in track cm−2. Moreover, the field of view (area) has been calculated using stage micrometer. Unexposed films (LR-115 type II detector) under identical etching condi- tions have been used to estimate the average background track concentration under standard and identical etching conditions. Then, the measured track concentrations have been corrected for background. The experimental toler- ance (error ± 1σ) in the track concentrations have been estimated by multiplying track concentration with the inverse of the square root of the total number of tracks (N)
− 1/2, where N is the total number of tracks counted in each sample. To obtain good statistics of tracks, one should select about 70 - 130 fields of view in a random way on each of the detector surface. The track concentra- tions of the two detectors in each dosimeter, installed at a location, have been averaged. These track concentrations have been converted into radon-222 concentrations by applying the conversion factor for LR-115 type II detec- tors per Bq/m3. The calibration process for the dosime- ters has been calibrated against a known activity of 226 Ra, ˚C (radon-222 source). The calibration coefficient for LR-115 nuclear track detectors obtained from the calibra-tion experiment is 0.036 and 0.18 alpha-track cm−2·day−1 per Bq·m3 of radon-222, respectively. These values are in good agreement with that reported by other investtigators [16,19,20] activity concentration Da has been calculated
using Da = i/(kta): k is attenuation factor [21] from
radon-222 transport through the polyethylene (PE) insu- lating foil [22], is the calibration coefficient of the ra- don-222 measuring device in terms of alphatracks cm−2·day−1 per Bq·m3 of radon-222 and t
a is the exposure
time in hours. Most of buildings have no air-conditioning conditions and some rooms are ventilated by ventilators or simply by opening doors and windows. The measure- ments have been carried out in regular periods of time: January, April, July and October, to estimate the indoor air radon radon-222 concentrations. These periods have
been characterized by different climatic parameters, for example pressure and temperature and we have taken an average value for each period.
3. Model
3.1. Factors Affect Measurements against Radon The estimation of indoor radon-222 concentrations for selected buildings is based on a combination of some (or all) of the following factors:
1) Sufficient high radon-222 diffusion resistance and air tightness under the ground floor of the building which are caused by sealing of surfaces (that separate the indoor occupied space from the soil or the application of radon- 222 barrier-resistances or membranes).
2) Active (fan powered) or passive (no fan) soil de- pressurization which gives a combined effect of ventila- tion of the building ground and balancing the pressure difference between the indoor air and the surrounding soil.
3) Ventilation (balanced) of both occupied rooms (in- door air) and unoccupied spaces such as vent crawl spaces. In their experiment, Kokotti et al. [23] have shown that when tenants have increased the ventilation of their rooms, radon-222 level has significantly de- creased. The most cost-effective solution for non-new buildings will usually be a combination of the previous three factors. The costs compared to the effectiveness are usually much lower for preventive measures in new con- structions, than in existing buildings [3,4]. This work focuses on the air tightness of radon-222 barrier-resis- tance or so-called radon-222 membrane. An airtight con- struction is a premise for other preventive measures to function, e.g. sub-slab depressurization systems (SSDS). Analysis of different measures show that active SSDS usually are the most effective preventive measure as a stand-alone [24], assuming an air tight construction. A major problem for the policy-makers is to solve an im- portant question: How to protect human health and safty from radon-hazards? Because ambient outdoor air is fairly considered good, but indoor air, on the other hand, could not be considered safe. Searching for indoor qual- ity should face the fact that individuals are making their own air-quality [25].
3.2. Model to Estimate Indoor Radon Concentration
Simply, the indoor-radon-222 concentration (IRC) may be due to the influence of four parameters:
1) Ventilation and air leakage from indoor to outdoor (VAL);
2) Diffusion from outdoor (DOD);
So, can write that the total ICR = VAL + DOD + EBM + DG. The above mentioned parameters can estimate the IRC as shown in the following calculations. The ICR at steady-state may be expressed as:
A 1 D D P D D
V
S 1 A 1
D D P D D
V
w
a a w e a
m a g a
n
n
V n
(1)
Also, ICR at steady state (Equation (1)) could be ap- proximated as:
1
C P
A V
1 P V
a
w w
q p n n
A Cg
(2)
where Da is the IRC indoor-radon-222 concentration in
Bq·m−3, D
e is the outdoor-radon-222 concentration in
Bq·m−3, D
m is the Building material-radon-222 concen-
tration in Bq·m−3, D
g is the ground-radon-222 concentra-
tion in Bq·m−3, P
w is the radon-222 diffusion transmit-
tance between indoor and outdoor air, i.e. through walls and roof in m·s−1 (P
w = 1/Rw), the radon-222 diffusion
transmittance of radon-222 barrier-resistance or whole ground construction in m·s−1 (P = 1/R), R is the radon- 222 diffusion resistance of radon-222 barrier-resistance or whole ground construction in m·s−1 (P = 1/R), R is ra- don-222 building material emission (exhalation) coeffi- cient in m·s−1, S is the indoor surface area of radon-222 containing building material m2, A is the room (building) area towards ground in m2, V is the room (building) volume m3 and n is number of air changes per hour due to ventilation, in-filtration and ex-filtration, through walls and roof as the floor is included in q (air change/ hour), q is the air permeance of ground in m3/m2·h·Pa, p is the air pressure difference between outdoor ground and indoor air at ground level (Pa), Aw is the room
(building) area towards outdoor air (m2). Radon-222 re- sistance is defined as the capability of radon-222 to dif- fuse through the material, i.e. this means the answer of the simple question: How much a considered material does resist the flow of radon-222 through it? Also, one can note that P and R may include the total radon-222 diffusion transmittance and resistance, respecttively. This means that the various building materials (for example concrete floor) in addition to the radon-222 resistance (or transmittance) of the radon-222 barrier-resistance is also included. The same analysis is valid for the permeance q; as it may include the average air permeance of the build- ing ground structure with all its perforations and air leakage in addition to the permeance of the various mate- rials, i.e. not only of the radon-222 barrier-resistance. The term (q pA) represents the air leakage (m3·h−1). Ventilation of the building ground is not included in the model but might be seen in Equation (1) as a reduction of
an effective radon-222 concentration in ground, and thus be applied in the calculations. In addition, wind increases the air infiltration and ex-filtration and the total ventila- tion reduces the radon-222 concentration in indoor air and the product Dm with unit (Bq·m−2·h−1) may be re-
ferred to as a radon-222 building surface material emis- sion or “exhalation rate”. For economic reasons, au- thority’s trends accelerate towards the minimization of ventilation and infiltration rates in recent constructions which drastically increases the radon-222 level inside buildings. The majority of the “sick buildings” disorders are associated with poor indoor-air quality [26]. Also, the number of air changes per hour (n) includes air leakages between indoor and outdoor air through the walls and roofs. Equation (1) (the above mentioned model) gives the equilibrium of the steadystate situation where the decay of radon-222 is not included where radon-222 has a self-life of 3.8 days [3,4]. On the other hand, if one considers Dm constant, the presented model will give
more correct data: Dm is constant means that an inex-
haustible or continuously replenished radon-222 reser- voir in ground is time-independent. However, in some of the more extreme cases where the radon-222 model will not give the correct data due to the decay of radon-222, we will be not considering the normal building anymore. Real buildings, above ground, are mostly neither airtight nor radon-222-tight because they have at least some ven- tilation (n is not zero) and win- dows and doors are par- tially or completely opened. For example, if we imagine the presence of an ideally-tight (ultra-tight) building where radon-222 diffusion is not permitted, the ra- don-222 disintegration and time-dependency will also affect ICR. In the present work, the outdoor-radon-222 concentration might be assumed to be null (De ≈ 0).
Similarly, if we consider that the radon-222 concentra- tion in building materials (Dm≈ 0), the building materials
will absorb radon-222 from the indoor air. Also, we may assume that the radon-222 concentration in the building ground is much higher than the radon-222 concentration in the indoor air (Dm >> Da). Similarly, if we consider
that the radon-222 concentration in building materials (Dm ≈ 0), the building materials will absorb radon-222
from the indoor air. Calculating and solving Da from
Equation (1) without the forgoing simplification yields the following expression for the radon-222 concentration in indoor air:
A S A
1 P D D P D
V V V
D
A S A
1 P P
V V V
w
w e m
a
w w
q p
n n n
q p
n n n
g
(3)
where
1
M g 1 1
R T T
atm
gas e a
p h
p
gh
(5)
where h is the indoor-outdoor air pressure equilibrium height (meter), p is the air pressure difference between outdoor ground and indoor ground levels in Pascal Pa, R
is radon-222 resistance of radon-222 barrier-resistance in s/m (R = 1/P), M is the air molar mass = 28.97 gram (mole)−1, P1
atm is the air pressure at 1atm = 101325 Pa, g =
gravitational acceleration on Earth ≈ 9.8 m·s−2, R
gas
8.31451 J(K·mol)−1, T
a and Te are the indoor and outdoor
temperatures, respectively, in Kelvin.
The air leakage from the ground into the building is proportional to driving force due to the pressure differ- ence p and Equation (5) can describe this driving force by the chimney/stack effect as:
0
0 0
( )
( g g ) ( )
g a e a a
e a e a
p p p p p p p
p p h h
(6)
M and
R T R T
a
a e e
gas a gas e
Mp p
(7)
where
1
PaPe Patm (8)
Here the indoor (a) and outdoor (e) represent the air masses concentration, with Pa and Pe as indoor and out-
door air pressure and Ta and Ta as the indoor and out-
door temperature, respectively. If one denotes the air pressure at outdoor ground level p0 and the air pressure in outdoor ground just beneath the radon-222 barrier- resistance is denoting pg, the driving force for air leak-
ages into the building from the underneath ground will be calculated after Equation (6). One can approximate the air pressure difference as: p = Pg− Pa, with p = Pe− Pa =
P0 − Pa, i.e. the air pressure difference between the
out-side air pressure at ground level Pa (=P0 ≈ Pg) and the
indoor air pressure at ground level Pa. This means that
the driving force or pressure difference p is approxima- tely independent of the radon-222 barrier-resistance depth in ground hg, the ground air mass concentration g and
temperature Tg, the latter temperature is varying ac-
cording to location under the building. Thus, it is safe to approximate: Two remarks should be considered: 1) If the approximation in the last equation (Equation (8)) is not used, this will lead to nonstop values (an infinite se- ries) for the pressure difference p. 2) this latter (p) is a positive value when Ta > Te, i.e. when the indoor air tempe-
rature is higher than the outdoor air temperature. That is, the highest value of p occurs typically in winter time or in cold climates.
[image:5.595.57.289.279.377.2] [image:5.595.308.540.678.736.2]4. Results
Table 1 shows the experimental values of radon-222
concentration obtained in five elementary schools (codes ES-1, -2, -3, -4 and -5) and one high school (code HS-1) in Qena city.
In general, the indoor air radon-222-concentrations, Da
in all rooms is relatively low at all conditions; only it has reached little bit more than 200 Bq·m−3 in three class- rooms. It is worth noting that in other localizations in Egypt (Alexandria city), these low concentrations have been also reported [1]. Even higher values (1000 Bq·m−3) have been recorded in east Europe [27]. Moreover, it is interesting to report that values greater than 12,100 ± 600 Bq·m−3 have been reported in King’s valley at Luxor [28]. Perhaps these high values have been recorded at deep distances inside the ground where the probability of finding radium and its daughters (and consequently ra-don-222) increased. Because of different climates in the above mentioned locations, this comparison could not be true, and one can’t simply ranks the radon-222 as high or low levels. Moreover, because of the interference of these factors on each other, the parameters affecting the inside-radon concentration (which are given in Equation (1)) are not really sufficient to represent the real situation; for example the geometrical aspects of any building af- fect the inside-radon concentration and more effective ventilation rate affects the pressure difference. The main task in these geometrics is to ensure a sufficient air-tight- ness of the radon barrier-resistance to minimize the in- door-radon concentration. For example, it is necessary to weld the various radon barrier-resistance joints to ensure this air-tightness.
5. Discussions
To fit the presented model to experimental values (Table 1), an appropriate value for the air permeance has been chosen =q = 10−3 m3/(m2·h·Pa) and then we look for the most suitable values that fit the experimental data; then another value for q has been chosen and so on. After several iterative processes, one has found that the best fit- ing parameters that fit Equations (1) and (2) to the ex- perimental data are as follows: Dg = 5 × 10⁴ Bq·m−3, Rw
= 3 × 10⁷ s·m−1, R = 2.6 × 10⁷ s·m−1, v = 0 s·m−1, q = 10−3 m3/(m2·h·Pa), p = 1.7 Pa, D
e = Dm = 0 Bq·m−3, Aw =
196 m2, S = 296 m2, V/A = 2.4 m, n = 0.25 h−1, h = 2.7 m, Ta = 31˚C, Te= 41˚C. These parameters are evidently func-
tioning of time throughout one year. We have kept some
Table 1. Radon density obtained in five elementary schools (codes ES-1, -2, -3, -4 and -5) and one high school (code HS-1) in Qena (Upper Egypt).
Code School ES-1 ES-2 ES-3 ES-4 ES-5 HS-1 Da (Bq·m−3)
(Experimental)128.8 ± 30 132 ± 14 113 ± 21 77 ± 13 203 ± 54 122 ± 12 Da (Bq·m−3)
parameters constant and vary the inside-radon-222 con- centration with different other parameters. Figure 1
shows Da as a function of radon-222 barrier-resistance,
for different values of fitting parameters, e.g. Dg, n, qp
and R. As seen from Figure1, Da decreases, first sharply
with radon-222 resistance, and then second, it tends to stabilize for higher radon-222-resistance values. For ex-ample, at some values of radon-222 resistance, Da de-
creases with the permeance as shown in Table 2.
In Figure2, we show the behavior of indoor-radon-
222 concentration Da as a function of ground-radon-222
concentration Dg on keeping all other factors constant,
for example at certain values of radon-222 ground con- centration, Da increases with the ventilation rate as
shown in Table 3. The inside-radon-222 concentration Da is plotted against radon-222 resistance where the
other fitting parameters are kept constant; for example: when the radon-222-ground concentration Dg = 5 × 10⁴
Bq·m−3. This is depicted in Figure1 where at low ra- don-222 concentrations Da decreases rapidly where
dif-fusion of radon-222 is dominant, while at higher resis- tance, radon-222 concentrations decreases in slower rate till approaching to a limit value given by the air-leakage. It is noticed that if the permeance q set to zero the inside- radon-222 concentration increases with low resistance concentrations. So, comparing the values in Figure 1,
0.0 0.1 0.2 0.3 0.4
0 100 200 300 400 500
Calculated q = 3 x10⁻³
m3
/(m2
hpa)
Calculated q = 2 x10⁻³
m3
/(m2
hpa)
Calculated q = 4 x10⁻³
m3
/(m2
hpa)
Calculated q = 1 x10⁻³m3/(m2hpa)
Experimental ES-1 Experimental ES-2 Experimental ES-3 Experimental ES-4 Experimental ES-5 Experimental HS-1 Experimental Abd El-Zaher (2011)
Ins
ide
(222
)R
n Dens
ity
, B
qm
-1
(222)Rn Resistance, (108Sm-1)
0.0 0.1 0.2 0.3 0.4
[image:6.595.311.536.87.255.2]0 100 200 300 400 500
Figure 1. shows indoor radon density Da as a function of
radon-222 barrier-resistance, for different values of fitting parameters. Symbols show experimental results, and Black Square represents the data of Abd El-Zaher 2011 [1]. Table 2. Indoor radon density Da as a function of 222Rn bar-
rier-resistance, for different values of air permeance 222Rn- resistance (s·m−1).
Da (Bq·m−3) Da (Bq·m−3) Da (Bq·m−3) Da (Bq·m−3)
1 80 74 73 73
2 168 154 150 150
3 279 248 225 225
0.0 2.0x10⁴
4.0x10⁴
6.0x10⁴
8.0x10⁴
1.0x10⁵
1.2x10⁵
0 100 200 300 400
Experimental ES-1 Experimental ES-2 Experimental ES-3 Experimental ES-4 Experimental ES-5 Experimental HS-1 Experimental Abd El-Zaher (2011)
Calculated with n = 0.25 h-1 Calculated with n = 0.50 h-1 Calculated with n = 0.75 h-1
In
si
de-ra
do
n
C
oncent
ra
ti
ons,
(
B
qm
-3 )
Ground-radon density, Bqm-3
0.0 2.0x10⁴ 4.0x10⁴ 6.0x10⁴ 8.0x10⁴ 1.0x10⁵ 1.2x10⁵
[image:6.595.309.538.346.424.2]0 100 200 300 400
Figure 2. shows indoor radon density Da as a function of
radon-222 ground-density for different values of fitting parameters. Symbols show experimental results and black square represents the data of Abd El-Zaher 2011 [1]. Table 3. Indoor radon density Da as a function of rate of air
changes, for different values of ground-222Rn density D
g. Da(Bq·m−3)
(Calculated) “n” (h−1)
Da (Bq·m−3)
2 × 10⁴ Da (Bq·m −3)
5 × 10⁴ Da(Bq·m −3)
8 × 10⁴ Da (Bq·m −3)
1 × 10⁵
0.25 52 130 208 260
0.5 60 150 240 300
0.75 70 175 288 350
one can see that at higher radon-222 resistances (by dif-fusion) there is some contribution from the radon-222 diffusion to the inside-radon-222 concentration because most of radon-222 is carried out by simple air leakage. The behavior of indoor-radon-222 concentration Da as a
function of rate of air changes, n is depicted in Figure3
on keeping all parameters constant, for example at cer- tain values of n, Da increases with the pressure differ-
ence as shown in Table 4. This last behavior is important to keep considerable amounts of air changes per hour to maintain indoor-radon-222 concentration below some critical value. On the contrary, if we have low values of radon-222 resistance (low R) and high values of ground- radon-222 concentrations, then the indoor concentration of radon-222 will reach high values even with very ef- fective (or even ultra-) air-tightness. This fact shows the importance to ensure high level of radon-222 resistance in the normal ground; for example by using ground-ra- don-222 barriers. Moreover, the indoor-radon-222 con- centration Da is depicted as a function of air permeance,
for different values of radon resistances in Figure4, for example at certain values of air permeance, Da increases
[image:6.595.62.284.407.576.2] [image:6.595.56.288.675.736.2]cause it decreases the radon-222 concentration in ground which, also, decreases the radon-222-resistance barriers.
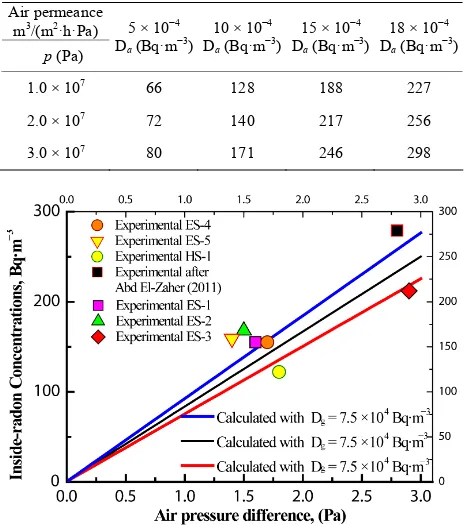
The pressure difference, p is a linear function with Da which is seen in Figure5. This linear dependence of
Da with p is calculated after Equations (1)-(3). Fi
0.0 0.5 1.0 1.5 2.0 2.5
0 200 400 600
Experimental ES-1 Experimental ES-2 Experimental ES-3 Experimental ES-4 Experimental ES-5 Experimental HS-1 Experimental Abd El-Zaher (2011) Calculated 2.5 Pa
Calculated 1.7 Pa Calculated 1.0 Pa
Insi
de-ra
do
n d
ens
it
y,
(
B
qm
-3 )
Rate of air changes, hour-1
0.0 0.5 1.0 1.5 2.0 2.5
[image:7.595.62.284.155.321.2]0 200 400 600
Figure 3. shows indoor radon density Da as a function
able 4. Indoor radon density Da as a function of rate of
of rate of air changes, for different values of pressure differ- ence between indoor and outdoor air. Symbols show ex- perimental results and Black Square represents the data of Abd El-Zaher 2011 [1].
T
pressure difference (indoor/outdoor), for different values of rate of air changes.
n (h−1)
0.1 Da ( −3)
0.25 Da −3)
0.5 Da ( 3)
0.75 Da −3)
1 Da (B m−3)
p (Pa) Bq·m (Bq·m Bq·m− (Bq·m q·
0.25 225 95 49 37 38
0.5 340 155 57 48 49
0.75 410 233 105 68 70
Figure 4. shows Da as a function of air permeance, for
dif-near increasing of Da as a function of
0 Bq·m−3 and D
m =
50
at these barriers may pre- ve
over, Figure5 shows the indoor-radon-222 con- ce
able 5. Indoor radon density Da as a function of rate of
ferent values of radon resistances. Symbols show experi-mental results and Black Square represents the data of Abd El-Zaher 2011 [1].
gure4 shows the li
the air-permeance: First, we have found that the suitable fitting parameters are as following: De = 0, Dm = 0, Dg =
5 × 10⁴ Bq·m−3, R = 2.5 × 10⁸ s·m−1, n = 1/4 h−1 and V/A = 2.3 m. The radon-222-resistance could be considered as a typical value in vast range of building products: For example polyolefin products and bitumen. Then, second, if we consider that the suitable fitting parameters are: De
= 50 Bq·m−3, D
m = 0, Dg = 5 × 10⁴ Bq·m−3, R = 2.5 × 10⁸
sm−1, n = 1/4 h−1 and V/A = 2.3 m, one will found the second linear behavior in Figure4.
Similarly, if one considers that De = 5
Bq·m−3, we will find the third (higher) linear pro- portionality in Figure4.
However, one should note th
nt radon-222 from leaking through very minute (al- most invisible) cracks in walls and floor-foundation [29, 30]. This picture shows clearly that a highly enough ra- don-222-resistance barrier (in the ground or the building structure facing the ground) makes air leakage occur through some uncertain (and/or accidental) “perfora- tions”.
More
ntration Da as a function of air pressure difference, for
T
pressure difference (indoor/outdoor), for different values of rate of air changes.
Air permeance m3/(m2·h·Pa)
p (Pa)
5 × 10⁻⁴
D
10 × 10−4
D
15 × 10−4
D
18 × 10−4
D )
a (Bq·m−3) a (Bq·m−3) a (Bq·m−3) a (Bq·m−3
1.0 × 10⁷ 66 128 188 227
2.0 × 10⁷ 72 140 217 256
3.0 × 10⁷ 80 171 246 298
Figure 5. shows Da as a function of air pressure difference,
[image:7.595.307.539.422.685.2] [image:7.595.58.287.428.689.2]re = 3 × 10⁷ whi rres s to trans-−8
del has successfully applied to fit ex-
REFERENCES
[1] M. A. El-Zahe f Inside-Radon-222 Concentration dria City,”
Radia-different values of radon-222-ground concentrations, for
mark from these data, it is recom- m
pa
able 6. Indoor radon density Da as a function of Rn
example at certain values of air pressure, Da increases
linearly with the radon-222-ground concentrations as shown in Table 6.
As a general re
ended that the minimum ventilation rate should be 0.5 air changes per hour. The mechanical movements of air particles, if they are ventilated, will ensure larger control of air exchange rate than the normal motion of wind. The indoor-radon-222 concentration is so sensitive to upon different sources of radon-222-leakage through the barri- ers. We summarize these different sources of radon-222- leakage by the term qp which is somewhat crucial to ensure sufficient high air-tightness in the radon-222 bar-riers. The normal value of radon-222 concentration in ground Dg is 104 - 5 × 10⁴ Bq·m−3 and if Dg exceeds this
range it will considered as high radon-222 concentration. We have calculated several cases with different fitting- rameters and we have arrived to the conclusion that it is mandatory to ensure very high air tightness. Even with a very high resistance radon-222-barrier, it may contain minute air leakages which indicate the importance of welding all joints and radon-222-barriers; in this regard aging factors of the building could be a principal cause to radon-leakage. We have taken the air-permeance value q
= 10−3 m3/(m2·h·Pa) which is an average air-permeance value for radon-222 for achieving the maximum security value; a standard value for q is q = 5 × 10⁻⁴ m3/(m2 ·h·Pa) which should not taken into application because it does not include the radon-222-barrier connection (joint) to-wards the wall that enhances making large radon-222- leakage; thus higher value of air-permeance q = 10−3 m3/(m2·h·Pa) is considered when fitting experimental values with model (Figure4). Although the in-and-out- door temperatures vary throughout the year, we have taken a typical average values for this location, 30˚C ± 1˚C and 40˚C ± 1˚C. Nevertheless, larger difference in temperatures stimulates a larger pressure difference be- tween in- and out-door pressures, Δp, and consequently radon-222 concentration will increase. For normal build- ings, the above ground radon-222 diffusion gradient could be neglected because the walls and roof have some radon-222-resistance, R. A typical value for radon-222-
222
T
bar-rier-resistance for different values of air pressure difference (indoor/outdoor).
Air pressure Pa R 1)
1.0Da
(
1.5Da
(
2.0 Da
(
2.5 Da
(
3. (
75 113 149 182 225 (s·m− Bq·m−3) Bq·m−3) Bq·m−3) Bq·m−3)
0 Da
Bq·m−3)
2.5 × 10⁴
5.0 × 10⁴ 80 125 162 208 251
7.5 × 10⁴ 84 172 180 228 273
sistance R s/m, ch co pond
mittance value P = 3.33 × 10 m/s. If one starts by as-suming large values of radon-222-resistance, R, this will give larger calculated values of indoor radon-222 con-centration. Moreover, for normal n values (0 < n < 1), the De concentration is directly proportional to n for the
equilibrium state conditions (steady state situation). This means that the values of “n” are replacing the inside-air to outside. In all figures, the experimental data are shown as symbols while the calculated values are illustrated as solid lines. The fit shows suitable and appropriate condi-tions between experimental and calculated values which supports the presented model.
6. Conclusion
The presented mo
perimental data which show the validity of this model. In order to maintain the indoor-radon-222 concentration as low as possible, the different calculations depict a nice picture giving rise to the importance of air-tightness of the radon-222-barrier, or generally rather the building structures, facing the building ground has to be ensured by securing sufficient air-tightness in joints and different feed-through and avoiding perforations. Also, continu- ous mechanical ventilation should maintain high rate of air exchange which will reduce also the pressure differ- ences between indoor-air and outdoor-one. Moreover, the presented model gives realistic values and valuable in- formation about the influence of different parameters on the indoor-radon-222 concentration which permits dif- ferent choices to select a good and effective measure and low-coast to keep the radon-222 level as low as possible. After our model, the most effective source that affects the indoor-radon-222 concentration is the diffusion of ground-radon-222 to inside building through air leakages and cracks forced (driven) by pressure difference through the building-construction. It is really an urgent problem to protect public health from radon-hazards. Finally, one should provide his home with a smoke-free ambience.
r, “Seasonal Variation o in Dwellings of Alexan
tion Protection Dosimetry, Vol. 143, No. 1, 2011, pp. 56- 62. doi:10.1093/rpd/ncq357
[2] H. Bergman, C. Edling and O. Axelson, “Indoor-Radon Daughter Concentrations and Passive Smoking,” Envi- romental International, Vol. 12, No. 1-4, 1986, pp. 17-19. doi:10.1016/0160-4120(86)90005-X
[3] “Annex E: Sources-to-Effects Assessment for Radon-222 in Workplaces and Homes,” United Nations Scientific
ic Committee on the Effects of Atomic Radiation, 2006. [4] “Annex E: Sources-to-Effects Assessment for Radon-222
[image:8.595.58.287.651.737.2]on Exhalation in Phosphate Fertilizers,” Arabian
ination of Correlation to U-238 Concentra-
apping in a Linac Radiotherapy Facility,”
rgy-Efficiency in Ho-
d New Construction: A Review,” Radiation
Committee on the Effects of Atomic Radiation, 2003, pp. 22-28.
[5] M. W. Kadi and D. A. Al-Eryani, “Natural Radio Activity and Rad
Journal for Science and Engineering, Vol. 37, No. 1, 2012, pp. 225-231.
[6] M. W. Kadi, “Rn-222 in Some Underground Water-Sam- ples and Exam
tion,” Asian Journal of Chemistry, Vol. 22, No. 1, 2010, pp. 148-152.
[7] Sh. A. Dheya, S. Abdul-Majid and M. W. Kadi, “Fast Neutron Dose M
10th Radiation Physics & Protection Conference, Cairo, 27-30 November 2010, pp. 27-30.
[8] R. L. Fleicher, A. Mogro-Campero and L. G. Turner, “In- door-Radon Levels: Effect of Ene
mes,” Environmental International, Vol. 8, No. 1-6, 1982, pp. 105-109.
[9] N. M. Rahman and B. L. Tracy, “Radon Control Systems in Existing an
Protection Dosimetry, Vol. 135, No. 4, 2009, pp. 243-255. doi:10.1093/rpd/ncp112
[10] H. Arvela, “Seasonal Variation in Radon-222 Concentra- tion of 3000 Dwelling with Model Comparisons,” Radia-tion ProtecRadia-tion Dosimetry, Vol. 59, No. 1, 1995, pp. 33-42. [11] C. K. Man and H. S. Yeung, “Modeling and Measuring
the Indoor Radon-222 Constructions in High Rise Build- ings in Hong Kong,” Applied Radiation and Isotopes, Vol. 50, No. 6, 1999, pp. 1131-1135.
doi:10.1016/S0969-8043(98)00128-6 [12] D. Dapra, C. Silibello and G. Queir
Ventilation Rate on Inside-Radon-222
azza, “Influence Concentration in
ation of Indoor Radon Concentration
ilding Materials,” AIR-INS Inc., Ottawa, 1988.
on,”
Protec
Using of
a Test Chamber,” Radiation Protection Dosimetry, Vol. 56, 1994, pp. 15-18.
[13] S. M. Musavi and A. Negarestani, “An Electrical Circuit
Model for Simul ,”
Radiation Protection Dosimetry, Vol. 153, No. 1, pp. 117- 120.
[14] D. Bombaru, R. Jutras and A. Patenaude, “Air Permeance of Bu
[15] A. Cuyt and B. Verdonk, “Combining the Radon, Marcov, and Stieljes Transforms Foe Object Reconstructi Universidad Complutpnse, Madrid, 2004.
[16] S. A. Durrani and R. Ilic, “Radon-222 Measurements by Track Detectors, Application in Radiation tion, Earth Science and Environment,” Singapore, 1997. [17] A. M. Golubenkov and A. F. Malenchenko, “Determina-
tion of Natural Uranium in Biological Samples Solid State Nuclear Track Method,” Journal of Radio- Analytical and Nuclear Chemistry, Vol. 36, No. 2, 1977, pp. 547-556. doi:10.1007/BF02517021
[18] L. S. Quindos, P. L. Fernandez and J. Soto, “National Sur- vey on Indoor in Spain,” Environment International, Vol. 17, No. 5, 1991, pp. 449-453.
doi:10.1016/0160-4120(91)90278-X
[19] M. Malhlobo, M. Nsibande and S. M. Farid, “Indoor Ra- don Measurements in Swaziland with Solid State Nuck Detector,” Journal of Environmental Radioactivity, Vol. 27, No. 3, 1995, pp. 261-268.
doi:10.1016/0265-931X(94)00041-T
[20] G. Somogyi, “The Environmental Behavior of Radium
don Technical Reports Series 310,” IAEA, Vienna, 1990. [21] L. A. Kunyansky, “Generalized and Attenuated Ra
Transforms: Restorative Approach to the Numerical Inlu- vertision,” Inverse Problems, Vol. 8, No. 5, 1992, pp. 809-817. doi:10.1088/0266-5611/8/5/008
[22] A. F. Hafez and G. Somogyi, “Determination of Ra- don-222 and Thoron Permeability through Some Plastic by Track Technique,” Nuclear Tracks, Vol. 12, No. 1-6, 1986, pp. 697-600. doi:10.1016/1359-0189(86)90682-5 [23] H. Kokotti, T. Savolainen, T. Raunemmaa and P.
Kalli-a-
door Air Pollution and
Pub-door Pollution,” Environmental Internatio-
“Systematic Indoor
uber, E. Salama and W. Ruh, “Real-Time
Measure-ons
K. J. Renken, “Laboratory Measure- okoski, “Indoor Radon in Three Similar Two-Story Houses with Different Ventilation Systems,” Environmen- tal International, Vol. 15, No. 1-6, 1986, pp. 289-292. [24] World Health Organization, “Hand Book on Indoor R
don,” WHO, Geneva, 2009. [25] K. Sexton and R. Repetto, “In
lic Policy,” Environmental International, Vol. 8, No. 1-6, 1982, pp. 5-10.
[26] J. L. Repace, “In
nal, Vol. 8, No. 1-6, 1982, pp. 21-36. [27] J. Vaupotic, M. Sikovec and I. Kobal,
Radon and Gamma-Ray Measurements in Slovenian Schools,” Health Physics, Vol. 78, No. 5, 2000, pp. 559- 562.
[28] E. Gr
ments of Individual Occupational Radon Exposure in Tombes of the Vally of the Kings, Egypt,” Radiation Protection Dosimetry, Vol. 144, No. 1-4, 2011, p. 620. [29] W. Z. Daoud and K. J. Renken, “Further Investigati
on Radon Gas Diffusion through Fractured Concrete Samples Coated with a Sealant,” Proceedings of Inter- national Radon Symposium, Milkwaukee, November 2000, pp. 22-25.
[30] W. Z. Daoud and
ments of the Radon Gas Diffusion Coefficient for Frac- tured Concrete Sample and Radon Gas Barrier Systems,”