http://www.scirp.org/journal/lce ISSN Online: 2158-7019
ISSN Print: 2158-7000
DOI: 10.4236/lce.2017.83007 Aug. 23, 2017 81 Low Carbon Economy
External Shocks and the Law of Carbon Price
Fluctuation
—Based on the Framework of CWT and EEMD
Yihan Zhou, Xing Yang, Jianling Shu
School of Economics, Jinan University, Guangzhou, China
Abstract
This paper focused on researching the fluctuation of carbon trading price caused by the external shocks through analyzing the data of three-phase car-bon spot price from Blue Next Environmental Exchange and the European Climate Exchange (ECX). The results are the following: 1) released important information and events will seriously affect the carbon price fluctuations; some important information are released that cause sharp fluctuations in a short period of time; the Sudden events lead to long-term, drastic fluctuations in carbon price and its influence over the impact of important information; 2) the impact of external events is always corresponding to the low-frequency component of time sequence; this is because the low-frequency component usually reflects the data signal amplitude which is severer, and the high-frequency component represents the data signal amplitude which is a smaller part; it has random fluctuations of the time sequence.
Keywords
Carbon Price Fluctuations, External Shocks, The Wavelet Analysis Method, EEMD Model
1. Introduction
In order to respond to the challenge brought by global climate change, the Eu-ropean Commission established EuEu-ropean Union Emission Trading Scheme (EU ETS) in Jan. 2005, with market mechanism as a new path to address greenhouse gas emission reduction issue, making carbon credit tradable intangible goods and gradually transit to a financial asset. EU ETS is the first major carbon trad-ing market worldwide, also the biggest carbon tradtrad-ing market currently world-wide. The practice of 11-year operation of EU carbon credit trading market
How to cite this paper: Zhou, Y.H., Yang, X. and Shu, J.L. (2017) External Shocks and the Law of Carbon Price Fluctuation. Low Carbon Economy, 8, 81-95.
https://doi.org/10.4236/lce.2017.83007
Received: July 14, 2017 Accepted: August 20, 2017 Published: August 23, 2017
Copyright © 2017 by authors and Scientific Research Publishing Inc. This work is licensed under the Creative Commons Attribution International License (CC BY 4.0).
DOI: 10.4236/lce.2017.83007 82 Low Carbon Economy
shows that EU carbon credit trading mechanism is increasingly mature, provid-ing an effective operational normal form of carbon credit tradprovid-ing for every country across the world, accumulating a large amount of data and experience. However, as an exploring emerging unique trading system, it also has many problems, and dramatic fluctuation of carbon trading price is one of its major problems.
Since EU ETS was established, the price of carbon credit has experienced sev-eral dramatic fluctuation: due to imbalance of supply and demand resulting from deviation of initial quota estimation by the government; the price of carbon credit suffered a cliff fall after the event of certification disclosure in the end of April 2006; when it was known in the end of Phase I that carbon quota cannot be used continuously, the price of carbon credit fell to near zero; due to influence of global financial crisis, the price of carbon credit fell dramatically again in later 2008; due to influence of European debt crisis and stagnation of global climate negotiation, the price of carbon credit fell once again in early 2011. Wide ranged fluctuation, especially nose dive of carbon credit price, fails to provide clear sig-nal of market price for long-term emission reduction of enterprises, not conduc-tive to promotion of long-term investment in emission reduction of enterprise. In order to protect enterprises’ enthusiasm of emission reduction, reduce in-vestment risk of investors, and maintain stable operation of carbon market, dramatic price fluctuation shall be avoided as much as possible.
Through intuitive observation it was found that every dramatic price fluctua-tion of EU ETS actually related to impact of external shocks (disclosure of im-portant information and sudden events). Major issue this paper will address is to observe fluctuation of carbon credit price after external event, empirically test whether impact of external event is a major factor influencing short term ab-normal fluctuation of carbon credit price in some specific period and further analyze extend of these events influencing yield of carbon quota market in short time. Through analysis of such events, we try to arouse carbon market rule de-signer’s attention to impact of external event to draw experience and learn les-sons to constantly improve design of trading system and risk control system, promote solid development of carbon market, at the same time, to help instruct trading behavior of carbon market participant during recurrence of such events, providing reference for them to maximize profit and enhance ability to hedge risk. In addition, we also hope to provide reference for China building a national unified carbon market from 2017 to 2020.
With development of EU carbon financial industry and enhancement of commodity and financial attributes of carbon credit, carbon price fluctuation draws high attention of scholars, and research on influencing factor and fluc-tuating rule of carbon price becomes a hot spot increasingly.
DOI: 10.4236/lce.2017.83007 83 Low Carbon Economy
cause of singular points and fluctuation between former and later price, then further analyze and test the influence of external event on extend of yield fluctu-ation using EEMD-based event research. Part V is conclusion.
2. Literature Review
With regards to research on influencing factor of carbon price, existing literature research shows that change of energy price, climate change, macro policy and impactive event are major factors influencing carbon price. For example, re-searches of Kanen [1], Bunn etc. [2] and Chevallier [3] agreed that among fac-tors influencing carbon price, the influence of energy price is significant; Ob-erndorfer [4] studied the relation between important electric power company’s share price in European Union countries and the carbon price, confirmed the main electric power company’s share price was positively related with the carbon price relationship, a further sign of energy markets has important connections with the carbon market. Researches of Mansanet-Bataller etc. [5] found that be-sides energy price, climate change also influences carbon price fluctuation, which is supported by many scholars; research of Alberola etc. [6][7] found that factors influencing carbon credit future price in phase I of EU ETS include energy price, air temperature change and impactive event, etc.; Chen Xiaohong
[8] found that besides significant influence of energy price and air temperature on carbon price, policies and system influencing supply-demand change also hace significant influence; Zou Yasheng et al. [9] found that CER cash market price is positively influenced by macroeconomic indicator and climate indicator of environment factor by analyzing with VEC model and impulse response model: Zheng Chunmei et al.[10] found that carbon credit future price is not influenced by petroleum future price by analyzing with MS-VAR model. Factors influencing carbon credit future price are different in different period. As for factors influencing carbon credit price at home, Ding Yang [11], Zheng Yuhua et al. [12] found that carbon price is influenced by factors such as economic factor, energy price and exchange rate, etc. likewise at home. Research of Xu Jia, Tan Xiujie [13] shows that domestic carbon price is influenced significantly by im-pactive event represented by policy adjustment and market inherent mechanism.
DOI: 10.4236/lce.2017.83007 84 Low Carbon Economy
resulting in dramatic fluctuation of carbon price in short period time. Guo Fu-chun, Pan Xiquan [16] researched EU carbon credit future price with B-P struc-tural mutation check, finding that carbon price fluctuated greatly multiple times, nonlinearly; Ying, Fan etc. [17] used event study method to analyze the hap-pened since the establishment of the EU ETS 50 policy issues affecting the price of carbon trading, unlike previous single policy research of events, but the 50 events can be divided into 6 types, classification inspects the influence degree of each type of event to the carbon price, the results show that the influence of the negative influence of slightly higher than the positive events, and some events have a long term and short term different influence on the carbon price. In addi-tion, in financial area, event research is also widely used to discuss the influence of a specific economic event on market value. For example, Pan Huifeng et al.
[18] used the method to research the influence of impactive supply impact on petroleum market; Guo Hongyu et al.[19] used event analysis to observe short term influence of QE policy on Japanese stock market.
In a word, this paper thinks existing researches have the following deficiency: First, most scholars pay more attention to the influence of energy price, elec-tricity price and weather on carbon credit price when researching carbon trading market, with less attention to and no systemic analysis of the influence of factors such as issuance of important information in 3 phases or sudden event on car-bon trading market. Second, with regards to research method, event research and multiple linear regression expanded ARCH family model research the in-fluence of event on price fluctuation after occurrence of specific known event, probably causing omission or error of event definition, resulting in greater error in empirical analysis and only detecting influence of event on price, failing to re-flect specific price fluctuation.
Based on above deficiency, this paper analyzes the influence of external im-pact on EU carbon price fluctuation by introducing event research under wavelet analysis and EEMD algorithm.
3. Research Method
“mathemat-DOI: 10.4236/lce.2017.83007 85 Low Carbon Economy
ics microscope” in addition, signal can be resolved to different frequency chan-nel through wavelet to remove fluctuation resulting from occasional factors in data, reserve lower-frequency part, so as to highlight main factor and macro break point.
Singularity detection theory was presented by Mallat in 1992, wavelet trans-formation has the feature of time-frequency localization, able to analyze effec-tively singularity of signal. When wavelet transformation detects singular point of time sequence data, it can precisely decide position of the singular point and size of singularity. Wavelet transformation is divided into two categories: Dis-crete Wavelet Transform (DWT) and Continuous Wavelet Transform (CWT). Main difference between them is that CWT is operated all possible zooming and translation, while DWT adopts specific subset of all possible zooming and trans-lation. Advantage of CWT lies in inclusion of all information of signal, while that of DWT lies in removing redundancy expressed by CWT information. Con-sidering CWT is typically used in the research direction of system modal para-meter identification, in order to maintain integrity of information at the same time, this paper introduces CWT to analyze influence of external event on price fluctuation.
3.2. Ensemble Empirical Mode Decomposition
Ensemble Empirical Mode Decomposition (EEMD) is an effective kind of me-thod processing nonlinear unsteady time sequence. Its core is Empirical Mode Decomposition (EMD) proposed by Norden E. Huang et al. (1998), EEMD is a kind of improvement algorithm based on it. EMD is a signal screening process, and the principle is to separate out different sized fluctuation in original data signal, and decompose them into different characteristic sized sequence ranked from high frequency to low frequency, which is called intrinsic mode function (IMF), every separate IMF contains different time sized local characteristic of original signal.
Classify and sum up different frequency sized decomposed IMF using re-structuring method, in which we can get high frequency component sequence and low frequency component sequence representing fluctuation of different phase. This method can decompose and restructure original price sequence in to high frequency component group and low frequency component group to re-search economic significance behind the data respectively.
4. Empirical Analysis
4.1. Source and Pre-Processing of Data
sub-DOI: 10.4236/lce.2017.83007 86 Low Carbon Economy
ject. Time span chose 3 phases EU ETS has experienced since it began trading. No. 1 phase is trial exploration phase, choosing EUA spot price of every trading day from June 24, 2005 to Dec 28, 2007, totaling 628 data; transaction market gradually became mature from the beginning of No. 2 phase, choosing time in-terval from Feb 26 to Dec 31, 2012, totaling 1241 trading data; No. 3 phase (this phase will end in 2020) chooses EUA spot price of very trading day from Jan 2, 2013 to Apr 20, 2016, totaling 852 data. This paper completed demonstration through MATLAB 2013a software programming.
The yield adopts spot transaction logarithm yield of 3 phases, which is the first order difference of the log taken from price to ensure stability of data. Written as:
( )
( )
1ln ln
i t t
R = P − P− (1)
where, i = 1, 2, 3, represents yield of 3 phases respectively.
4.2. Wavelet Analysis Based Carbon Price Singularity Detection
Signal singularity typically has two cases: 1) Amplitude mutates at some point, causing discontinuity of signal, this kind of mutation is called discontinuity of the first kind; 2) signal appears smooth, its amplitude has no mutation, but the first order difference of the signal has mutation and first order derivative is dis-continuous, this type of mutation is called discontinuity point of the second kind. Step of singularity detection is as follows:Step I: Yield time sequence fluctuation analysis
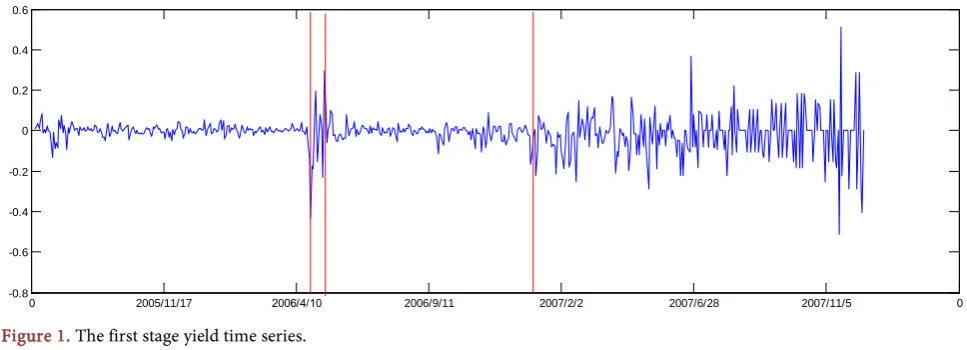
According to equation 1) calculate yields of 3 phases R1, R2, R3 to plot, results
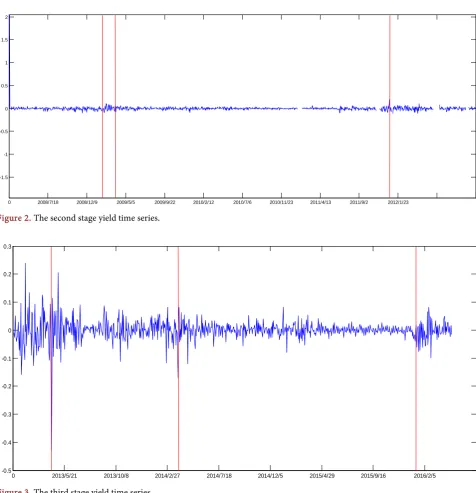
are shown as Figures 1-3, the amplitude in phase 1, 3 has obvious mutation, there is no obvious mutation in phase 2,but its appearance is non smooth curve,
so only need to detect discontinuity point of the first kind.
Seeing from yield fluctuation of 3 phases, price fluctuation in phase 1, 3 is more violent, while phase 2 is relatively smooth. Long vertical line represents the part with relatively violent fluctuation.
Step II: Wavelet decomposition
[image:6.595.56.540.551.726.2]As for wavelet base selection of wavelet decomposition, combining results of multiple wavelet base fitting and referencing other similar research, it is found
Figure 1. The first stage yield time series.
0 2005/11/17 2006/4/10 2006/9/11 2007/2/2 2007/6/28 2007/11/5 0
DOI: 10.4236/lce.2017.83007 87 Low Carbon Economy Figure 2. The second stage yield time series.
Figure 3. The third stage yield time series.
the fitting result of db4 wavelet base is more significant, so select db4 wavelet base for wavelet decomposition analysis. Detect discontinuity point of the first kind by decomposing yield signal of 3 phases 3 layers with db4 wavelet, d1 layer is high frequency component, d2 is the component filtering out part of high frequency information, d3 is further filtered low frequency component, the posi-tion of data signal abnormal fluctuaposi-tion point is reflected at the peak point of decomposed wavelet. Decomposed wavelet eliminates interference of high fre-quency noise, maintaining important part of information. Its fluctuation form can reflect the influence of external event and impact on price. Results of layer-ing are as follows (Figures 4-6):
0 2008/7/18 2008/12/9 2009/5/5 2009/9/22 2010/2/12 2010/7/6 2010/11/23 2011/4/13 2011/9/2 2012/1/23
-1.5 -1 -0.5 0 0.5 1 1.5 2
0 2013/5/21 2013/10/8 2014/2/27 2014/7/18 2014/12/5 2015/4/29 2015/9/16 2016/2/5
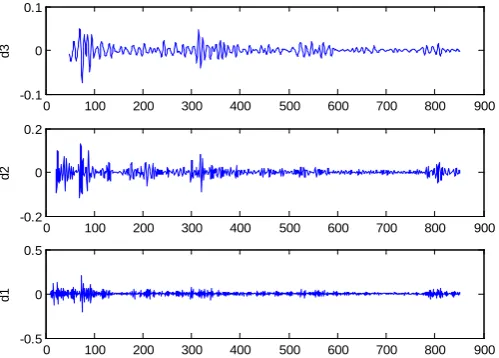
DOI: 10.4236/lce.2017.83007 88 Low Carbon Economy Figure 4. The first phase signal with db4 decomposition 3 layers of
detail coefficients.
Figure 5. The second phase signal with db4 decomposition 3 lay-ers of detail coefficients.
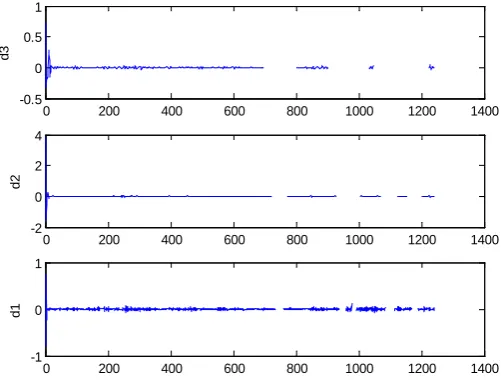
From 3 layer detail coefficient of phase 1 can position singular point, hori-zontal coordinate is 205 - 220,435 - 445, 590 - 620 internal, corresponding date
is early May 2006, early April 2007 and early December 2007,
The signal in phase 2 is the longest. The signal filtered out part of high fre-quency component seems almost level, and singular point is positioned the in-terval of horizontal coordinate 20 - 50, corresponding date is early April 2008.
From d3 filtered out part of high frequency data we can see that the signal of phase 3 is periodic, which is shown by 4 extreme points that become weak grad-ually. Position of extreme points is horizontal coordinate 70 - 90,300 - 330, 580 -
590, 770 - 810 respectively, corresponding date is from April 9 to May 8, 2013, before and after early April 2014, March 31 to April 19, 2015, December 23, 2015 to February 19, 2016.
0 100 200 300 400 500 600 700
-0.2 0 0.2
d3
0 100 200 300 400 500 600 700
-0.5 0 0.5
d2
0 100 200 300 400 500 600 700
-0.5 0 0.5
d1
0 200 400 600 800 1000 1200 1400
-0.5 0 0.5 1
d3
0 200 400 600 800 1000 1200 1400
-2 0 2 4
d2
0 200 400 600 800 1000 1200 1400
-1 0 1
[image:8.595.248.499.308.498.2]DOI: 10.4236/lce.2017.83007 89 Low Carbon Economy Figure 6. The third phase signal with db 4 decomposition 3 layers of
detail coefficients.
4.3. Singular Points and Corresponding External Event
We analyzed several singular points with larger jump and found that every jump point has the background of external event. External events at the time corres-ponding to price fluctuation singular point of 3 phases are shown as Table 1.
4.4. Influence of External Event Impact on Carbon Market Yield
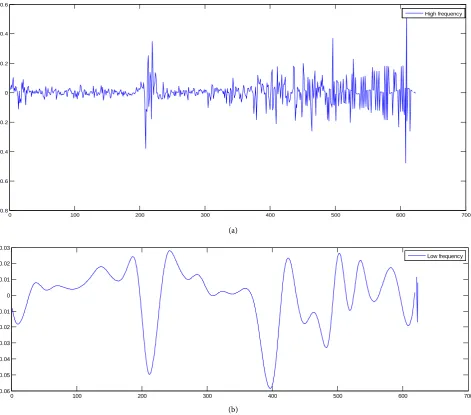
In order to further analyze how external event influences carbon price fluctua-tion and test the result of continuous wavelet singularity detecfluctua-tion, this paper chose 7 events in phase 1 and 3 as research subject to analyze the influence of external event on carbon price fluctuation in detail by using EEMD based event analysis.It can be found from layer analysis of wavelet signal that yield fluctuation is mainly combined result of components of different frequency. From the angle of structure decomposition, this paper decomposes and restructure into dimen-sions of high frequency component and low frequency component to discuss the influence of external event on carbon market yield fluctuation. High frequency component reflects small amplitude fluctuation, and low frequency component reflect larger one. Through structural combination of yield of different frequen-cy, we can improve accuracy of analysis of price fluctuation rule.
4.4.1. Decomposition and Restructuring under EEMD Algorithm
Referencing the setting rule on decomposition by Huang, Wu et al. [20], the am-plitude ratio coefficient of white noise is set as 0.2, the number of population mean is set as 100. Decompose the yield of 2 phases into a trend component and 8 Intrinsic Mode Function (IMFs) of different frequency respectively with
EEMD, IMF1-IMF8 are ranked from high frequency to low frequency
respective-ly, combine MF1-IMF4 to high frequency components, combine IMF5-IMF8 to
low frequency component, the result of combination is shown in Figure 7 and
Figure 8.
0 100 200 300 400 500 600 700 800 900
-0.1 0 0.1
d3
0 100 200 300 400 500 600 700 800 900
-0.2 0 0.2
d2
0 100 200 300 400 500 600 700 800 900
-0.5 0 0.5
DOI: 10.4236/lce.2017.83007 90 Low Carbon Economy Table 1. EU ETS carbon price abnormal fluctuations and reason.
Phases Events Time
The first phases: 2005.01.01-2007.12.31
The European Union’s 2005 emissions report and the
explicit first phase of quotas cannot be used in phase 2. The end of April to early May 2006.
The European Union’s 2006 emissions report. On April 2, 2007
The first phase ends with a large surplus of quotas. In early December 2007
The second phases: 2008.01.01-2012.12.31
The European Union’s 2007 emissions report. In early April 2012 The global financial crisis broke out. In the middle of September 2008
The third phases: 2013.01.01-2020.12.31
The European Union’s 2012 emissions report. In early April 2013 The European Union’s 2013 emissions report. In early April 2014 The European Union’s 2014 emissions report. In early April 2015
“The Paris agreements” were signed. On December 14, 2015
Note: The events are collected from the following sources: 1) European Commission Climate Action, see
http://ec.europa.eu/clima/news/news_archives_en.htm; 2) See Steffen H. et al. [15].
(a)
(b) Figure 7. The first stage yield decomposition diagram.
0 100 200 300 400 500 600 700
-0.8 -0.6 -0.4 -0.2 0 0.2 0.4 0.6
High frequency
0 100 200 300 400 500 600 700
-0.06 -0.05 -0.04 -0.03 -0.02 -0.01 0 0.01 0.02 0.03
[image:10.595.64.536.293.708.2]DOI: 10.4236/lce.2017.83007 91 Low Carbon Economy (a)
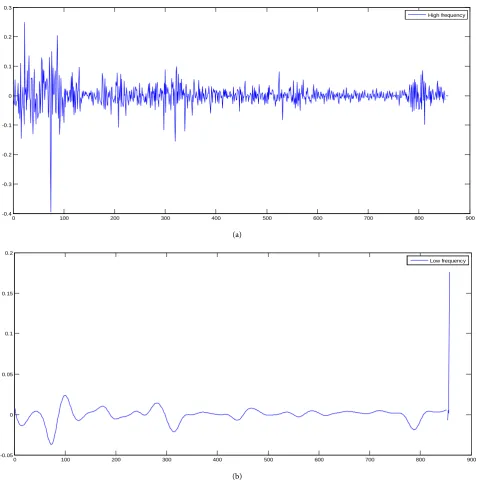
[image:11.595.60.538.71.555.2](b) Figure 8. The third stage yield decomposition diagram.
Figure 7, Figure 8 are the sketches decomposing the yield of phase 1 and 3 to high frequency component and low frequency component. It can be found from the fluctuation of low frequency component that positions with larger fluctua-tion correspond to the time when external event impact occurs, and the charac-teristic of fluctuation corresponding to the yield is that it drops first, then re-stores to balanced value.
4.4.2. Abnormal Yield Test of High and Low Frequency Component
Using the basic thoughts of event analysis, lock a test interval of the chosen ex-ternal event. This test interval is divided into an estimate window and an event
0 100 200 300 400 500 600 700 800 900
-0.4 -0.3 -0.2 -0.1 0 0.1 0.2 0.3
High frequency
0 100 200 300 400 500 600 700 800 900
-0.05 0 0.05 0.1 0.15 0.2
DOI: 10.4236/lce.2017.83007 92 Low Carbon Economy
window. Estimate window is the period before occurrence of the event. This pa-per chose 70 days before occurrence of the event as the estimate window to es-timate normal yield without event. Event window is the period when the event occurs. This paper chose the period when above mentioned singular point posi-tioning occurred as event window to test abnormal yield variation during this period. Set mean yield of estimate window as normal yield without event, ex-pressed as:
1
0
, ,
1 T
i t i t
T
AR R
N
=
∑
(2)I and t represent time t of No. i event; T0 represents the start date of estimate
window, T1 represents the start date of event window; abnormal excess yield in
event window is expressed as:
, , ,
i t i t i t
RB =R −AR (3)
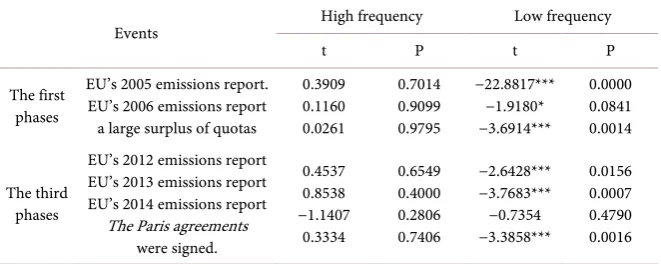
Finally, took single sample t statistical test for abnormal yield variation of high and low frequency component in event widow respectively, compare signific-ance of yield variation, and extent of influence before and after event. The result of test is as shown in Table 2.
The smaller statistical result P value is, the more significant the result is, that is, there is significant difference. Results show: external event impact has no sig-nificant influence on yield fluctuation of high frequency component. For low frequency component, except that issuance of Emission Report 2014 by EU in-fluences very insignificantly, other events all influenced significantly, especially issuance of Emission Report 2005 and Emission Report 2013 by EU, both made low frequency component of yield significantly abnormally fluctuate. From the low frequency curve fluctuation of the yield decomposition chart (shown as
[image:12.595.209.540.569.701.2]Figure 7) it can be seen that except issuance of Emission Report by EU, the low frequency component of other events all showed significant drop of yield. There are two possible causes: first, the point range captured by wavelet singularity de-tection is relatively narrow, its event window is only 10 days, while abnormal time influenced is relatively long, so yield varied little compared with previous;
Table 2. High frequency and low frequency components abnormal yield results.
Events High frequency Low frequency
t P t P
The first phases
EU’s 2005 emissions report. EU’s 2006 emissions report a large surplus of quotas
0.3909 0.1160 0.0261 0.7014 0.9099 0.9795 −22.8817*** −1.9180* −3.6914*** 0.0000 0.0841 0.0014 The third phases
EU’s 2012 emissions report EU’s 2013 emissions report EU’s 2014 emissions report The Paris agreements
were signed. 0.4537 0.8538 −1.1407 0.3334 0.6549 0.4000 0.2806 0.7406 −2.6428*** −3.7683*** −0.7354 −3.3858*** 0.0156 0.0007 0.4790 0.0016
DOI: 10.4236/lce.2017.83007 93 Low Carbon Economy
second, issuance of Emission Report in 2014 is the third report of phase 3. At that time carbon emission market had been relatively mature, and carbon price was also relatively stable, based on experience of two previous report, the third report brought less influence on market.
Wavelet singularity detection can successfully capture abnormal fluctuation point, finding that abnormal fluctuation of carbon price mainly related to two things, the first is predicable issuance of significant announcement and policy, such as issuance of Emission Report, Treaty of Paris by EU; the second is unpre-dictable incident, such as break out of financial crisis, large surplus of carbon quota, etc. The influence brought by predictable issuance of significant report, policy of the first kind has certain periodicity, showing that carbon price fluc-tuates dramatically during report period, restores stability beyond incident pe-riod, influencing narrow range of time. Periodic fluctuation resulting from is-suance of Emission Report of phase 3 is obvious (as shown in Figure 6). It indi-cates that with development and maturity of carbon market, carbon price fluc-tuated more regularly. The influence brought by unpredictable incident is rela-tively dramatic, with wider range of time influenced, such as the announcement of large surplus of phase 1 carbon quota resulted in nose dive of carbon price. Issuance of Emission Report in phase 2 from 2009 to 2012 did not result in ab-normal fluctuation of carbon price, mainly because of economic depression and low carbon price due to 2008 financial crisis and EU debt crisis. The carbon price is nearly zero in later phase 2, indicating financial crisis has long term, far reaching influence on carbon price.
5. Conclusions
Main conclusions of the paper are as follows: first, wavelet analysis is a excellent abnormal point detection tool, able to precisely find the singular point of EU ETS price yield fluctuation, successfully detect specific position where important incident occurs and corresponding time; secondly, issuance of important infor-mation and incident will severely influence fluctuation of carbon price, issuance of important information resulting in dramatic carbon price fluctuation in a short period, incident resulting in more dramatic carbon price fluctuation in a long period of time, with its influence exceeding that brought by issuance of important information; thirdly, it is concluded by using EEMD based incident analysis that occurrence of external incident always corresponds to a low-frequency component of time sequence, because the low-frequency component typically reflects the part with a large amplitude of data signal, while high frequency re-flects small amplitude, being random fluctuation of time sequence.
DOI: 10.4236/lce.2017.83007 94 Low Carbon Economy
speed to significant incident impact, establish flexible car quota supply adjust-ment mechanism, maintaining reasonable scarcity of carbon credit. Investors shall also pay attention to the impact of relevant incident to acquire maximum benefit from investment in carbon exchange.
Contribution of this article is based on such mature events in the European carbon market analysis, which can cause the carbon market rules designers full attention to external shocks, draw lessons from experience and constantly im-prove the design of the trading system and risk control system, promote the de-velopment of the carbon market steady. At the same time it also can help to guide the carbon trading behaviors of market participants to happen again, as they seek to maximize income and improve the ability of avoiding risk for ref-erence, which for the Chinese national unity will be from 2017 to 2017 construc-tion carbon markets. Carbon market supervision departments formulate policy management system to consider the impact on the market stability, and can ex-pect a major social and political and economic emergency on the fluctuation of the carbon price, improve the impact of the response speed of response to major events, and establish the elastic carbon rationing regulating mechanism, to keep carbon emissions moderating scarcity. Investors should also pay attention to the impact of relevant events to get the most out of the carbon trading market.
Due to the limit of the method in this paper, we can only demonstrate wheth-er thwheth-ere is any impact of diffwheth-erent events on EUA returns but cannot explain the causality for each policy.
Acknowledgements
In this paper, the author is grateful to the national social science foundation of China (Fund number: 15AGJ009) for the contribution of the national social science foundation and the evaluation committee of the anonymous review committee.
References
[1] Kanen, J.L.M. (2006) Carbon Trading and Pricing. Environmental Finance Publica-tions, 1-57.
[2] Bunn, D.W. and Fezzi, C. (2007) Interaction of European Carbon Trading and Energy Prices. FEEM Working Paper No. 63. https://doi.org/10.2139/ssrn.993791
[3] Chevallier, J. (2009) Carbon Futures and Macroeconomic Risk Factors: A View from the EU ETS. Energy Economics, 31, 614-625.
https://doi.org/10.1016/j.eneco.2009.02.008
[4] Oberndorfer, U. (2009) EU Emission Allowances and Stock Market: Evidence from the Electricity Industry. Ecological Economics, 68, 1116-1126.
https://doi.org/10.1016/j.ecolecon.2008.07.026
[5] Mansanet-Bataller, M., Pardo, A. and Valor, E. (2007) CO2 Prices, Energy and
Weather. The Energy Journal, 28, 67-86.
https://doi.org/10.5547/ISSN0195-6574-EJ-Vol28-No3-5
DOI: 10.4236/lce.2017.83007 95 Low Carbon Economy
https://doi.org/10.1016/j.enpol.2007.10.029
[7] Chevallier, J. (2011) Detecting Instability in the Volatility of Carbon Price. Energy Economics, 33, 99-110.https://doi.org/10.1016/j.eneco.2010.09.006
[8] Chen, X.H. and Wang, Z.Y. (2010) Empirical Research on Price Mechanism of Eu-ropean Carbon Emissions Trading. Science & Technology Progress and Policy, 27, 142-147.
[9] Zou, Y.S. and Wei, W. (2013) The Study on Impact Factors of Certified Carbon Emissions (CERs) Sport Markets. Journal of Financial Research, No. 10, 142-153. [10] Zheng, C.M. and Liu, H.M. (2014) The Research of EU Carbon Emissions Factors
Affecting Price Fluctuation—Based on MS-VAR Model. Journal of Shangdong In-stitute of Business and Technology, 28, 73-105.
[11] Ding, Y. (2015) Based on GEN Method of Domestic Research on the Influence Fac-tors of the Carbon Price—Carbon Emissions Exchange Price in Shenzhen as an Example. Times Finance, No. 4, 291-292.
[12] Zheng, Y.H. and Li, B.J. (2016) China’s Carbon Emissions Quota Market Price In-fluence Factors Analysis. Co-Operative Economy & Science, No. 5, 132-134. [13] Xu, J. and Tan, X.J. (2016) Carbon Prices’ Space-Time Heterogeneity.
Environmen-tal Economic Research, No. 2, 107-122.
[14] Christian, C., Daniel, R. and Waldemar, R. (2012) Modeling and Explaining the Dynamics of European Union Allowance Prices at High-Frequency. Energy Eco-nomics, 34, 316-326.https://doi.org/10.1016/j.eneco.2011.02.011
[15] Steffen, H., Marliese, U. and Karl-Martin, E. (2015) Emission Permits and the An-nouncement of Realized Emissions: Price Impact, Trading Volume, and Volatilities.
Energy Economics, 51, 560-569.https://doi.org/10.1016/j.eneco.2015.07.007
[16] Guo, F. and Pan, X. (2011) Carbon Market: Price Volatility and Risk Measurement Based on Empirical Analysis of the Price of EU ETS Futures Contracts. Finance & Trade Economics, No. 7, 110-118.
[17] Ying, F., Jia, J., Wang, X. and Xu, J.H. (2017) What Policy Adjustments in the EU ETS Truly Affected the Carbon Prices? Energy Policy, No. 103, 145-164.
https://doi.org/10.1016/j.enpol.2017.01.008
[18] Pan, H. and Shi, Z. (2012) Oil Markets’ Short Run Reactions to Significant Demand Shocks—An Event Study Perspective. Shanghai Journal of Economics, No. 12, 32-43.
[19] Guo, H., Xu, Z. and Tong, J. (2016) The Characteristic of Japan’s Quantitative Eas-ing and Short-Term Effect on the Stock Market Research—Based on Event Analysis.
Studies of International Finance, No. 5, 38-47.