Discussion Papers in
Accounting and Finance
Behind DEA Efficiency in Financial Institutions
C. Serrano Cinca
University of Zaragoza, Spain
C. Mar Molinero
University of Southampton, UK
and
F. Chaparro García
Universidad Autónoma de Bucaramanga, Colombia
Number AF02-7
BEHIND DEA EFFICIENCY IN FINANCIAL INSTITUTIONS
By:
C. Serrano Cinca
Department of Accounting and Finance University of Zaragoza, Spain.
serrano@posta.unizar.es
C. Mar Molinero
Department of Management University of Southampton, UK. camm@socsci.soton.ac.uk
F. Chaparro García Department of Accounting
Universidad Autónoma de Bucaramanga, Colombia fchaparr@www.unab.edu.co
This version: February 2002 JEL: G21
Address for correspondence: C. Serrano-Cinca: Department of Accounting and Finance, Fac. CC Económicas y Empresariales, Univ. Zaragoza, Gran Vía 2, Zaragoza (50.005) SPAIN serrano@posta.unizar.es
BEHIND DEA EFFICIENCY IN FINANCIAL INSTITUTIONS
ABSTRACT
DEA has been extensively used to measure the efficiency of financial institutions. Its advantages are clearly understood. But there are many unresolved problems. There are various views based on different modelling philosophies of what constitutes inputs and outputs in a financial institution. The paper explores up to what point the various combinations of inputs and outputs are equivalent, and up to what point the efficiency score obtained by a given institution changes under the various combinations of inputs and outputs. The extent to which two institutions that achieve the same efficiency score arrive at it following different strategies is explored with the aim of finding out what is behind such a score.
It is suggested that, not one but many different DEA specifications, containing different combinations of inputs and outputs, be modelled and that the results be analysed with the tools of multivariate statistics. Particular emphasis is placed on using tools that visualise the main characteristics of the data. By-products of the approach proposed here are the creation of league tables of financial institutions in terms of efficiencies and the possibility to assess strengths and weaknesses of individual institutions. This methodology is applied to the particular case of Spanish savings banks (Cajas de Ahorros) and proves to be particularly rewarding.
KEY WORDS
BEHIND DEA EFFICIENCY IN FINANCIAL INSTITUTIONS
1. INTRODUCTION
Efficiency is a key concept for financial institutions. It has long been studied. A review of 130 such studies in 21 countries is given by Berger and Humphrey (1997). Berger and Humphrey classify papers according to the technical approach employed, which they identify as parametric- Stochastic Frontier Approach (SFA), Distribution Free Approach (DFA), Thick Frontier Approach (TFA)- or non parametric- Data Envelopment Analysis (DEA), Free Disposal Hull (FDH), Index Numbers (IN), Mixed Optimal Strategy (MOS). By far the most popular technical approach is DEA, which was applied in 62 of the papers surveyed. DEA is appropriate for sets of homogeneous units with similar inputs and similar outputs since it performs multiple comparisons using a Linear Programming based approach. The assumptions are minimal. Inputs and outputs do not need to be measured in the same units, which adds to the advantages of the methodology. A survey of the more restricted area of DEA applications to bank branch performance is given by Schaffnit et al. (1997). Some recent references on the application of DEA to financial institutions are Dekker and Post (2001), Pastor et al. (1997), Hartman et al. (2001), Kuosmanen and Post (2001), Seiford and Zhu (1999), Saha and Ravisankar (2000), and Athanassopoulos (1997).
For the purposes of this paper, it will be useful to make a distinction between model and specification in a DEA context. Different philosophical approaches as to what a financial institution does, and what is meant by efficiency will lead to different models; see Berger and Mester (1997) for a full discussion. Two basic models are prevalent in the literature: intermediation and production. Specification will refer to a more restricted concept: the particular set of inputs and outputs that enter into model definition.
particular choice of inputs and outputs. It may be puzzling for the manager of a bank branch to discover that it is possible for different researchers to arrive at different conclusions about the efficiency of a bank branch when using the same technique (DEA). However, this confusion may be more apparent than real, since alternative specifications may be equivalent and the case may never arise. The study of the extent to which two different specifications are equivalent is one of the purposes of this paper.
Model and specification selection are not the only issues addressed in this paper. We wish to go behind the efficiency score. Two financial institutions may achieve the same DEA efficiency under a given model and under a common specification, but they may still be very different. Efficiency, being a mere score, may be compatible with a variety of management strategies. Imagine two institutions that achieve the same efficiency, one may have specialised in the production of a particular output and the other on the good use of a particular input. These differences will, of course, be reflected in different weight structures for inputs and outputs, and could be identified by means of such techniques as cross-efficiency analysis; Doyle and Green (1994). Here we propose a new methodological approach to strategy identification for financial institutions based on multivariate statistical analysis. This approach has the advantage of visualising the way in which a particular DEA score has been achieved by an institution and how this score is related to the model selected.
In this paper, efficiencies are calculated for a variety of DEA specifications. It is proposed that DEA modelling be embedded in a multivariate statistical framework.
This paper unfolds as follows. The next section contains a discussion of efficiency in financial institutions. The particular case study of Spanish savings banks (Cajas de Ahorros) is introduced and presented in the next section. This is followed by a description of the model and its implementation. The paper is completed with a conclusions section.
2. EFFICIENCY MODELLING IN FINANCIAL INSTITUTIONS
Deposits and acquired loans are inputs. Institutions are interested in placing loans, which are traditional outputs in studies of this kind; see, for example Berger and Humphrey (1991). Under the production model, a financial institution uses physical resources such as labour and plant in order to process transactions, take deposits, lend funds, and so on. In the production model manpower and assets are treated as inputs and transactions dealt with -such as deposits and loans- are treated as outputs. See, for example, Vassiloglou and Giokas (1990), Schaffnit, Rosen and Paradi (1997), Soteriou and Zenios (1999).
The mathematical models used to study the efficiency of financial institutions can be divided into two groups: those based on parametric frontier techniques, and those based on Data Envelopment Analysis (DEA). Berger and Humphrey find inconsistencies between the two approaches, although Ondrich and Ruggiero (2001) argue that both produce similar rankings, and conclude that there is no advantage in using parametric frontiers.
In this paper we focus on DEA models. Up to what point different DEA modelling approaches produce different results? This question can only be answered by looking at particular case studies. Oral and Yolalan (1990) found that a DEA model aimed at estimating service efficiency in bank branches in Turkey produced indistinguishable results from an alternative DEA model focused on profitability. A way of out this problem, the one implemented in this paper, would be to develop specifications with many inputs and outputs. This would be an attempt to create a general model that encompasses various modelling philosophies as particular cases. But care has to be exercised since the more inputs and outputs a model contains, the more units become efficient through specialisation or, as Lovell and Pastor (1997) put it, “because they are self-identifiers”. The relationship between efficiency and the number of inputs and outputs has been studied by Pedraja Chaparro et al. (1999).
different specifications are not totally equivalent, and it is difficult to assess what are the consequences for individual units of adding or removing an input/output without engaging in considerable extra work.
A new approach to specification search is proposed in this paper. The distinctive features of a specification are revealed by embedding DEA efficiency results into a multivariate statistical framework. We use in particular Principal Components Analysis (PCA), multiple regression, and Hierarchical Cluster Analysis (HCA). PCA has been used as an alternative to DEA by Zhu (1998) and Premachandra (2001). PCA as a data reduction technique to select inputs and outputs has been used by Adler and Golany (2001).
In our approach, PCA plays a fundamental role in specification and model selection. We do not attempt to find a “best” specification of inputs and outputs. A variety of possible specifications that offer combinations of inputs and outputs are estimated and efficiencies calculated for each financial institution under each specification. In this way, a matrix is obtained in which each column corresponds to a specification, and each row to a financial institution. This matrix is analysed by means of Principal Components Analysis (PCA). Component scores are plotted to show the extent to which the efficiency of financial institutions remains unchanged under the various specifications. The plot is interpreted by means of property fitting (Pro-Fit), a regression-based technique. The superimposition of the Pro-Fit results on the scores plot will help to identify specification equivalence, guide model selection, identify outlying behaviour, and assess strategic behaviour patterns in financial institutions that achieve the same efficiency score. The methodology will be applied to the particular case of Spanish Savings Banks (Cajas de Ahorro).
3. A CASE STUDY: SPANISH SAVINGS BANKS
very successful institutions, with none having defaulted since their creation over a century ago. They take 57% of all deposits, although traditional banks make more loans than they do. In recent years this sector has undergone an intense concentration process. Starting in 1980 there have been 34 mergers. Some other mergers are still under discussion. The largest institutions are Caja Madrid and La Caixa. The total number of Savings Banks is 47. There have been many empirical studies on the efficiency of Spanish financial institutions. Examples are Lozano-Vivas (1997 and 1998), Dietsch and Lozano-Vivas (2000), Lovell and Pastor (1997), Pastor (1999), and Pastor et al (1997).
This section will be divided into sub-sections. First, the data set will be described. The second subheading will concentrate on DEA and PCA. Empirical results will be interpreted in the third and fourth sub-sections.
3.1 THE DATA SET: 3 inputs and 3 outputs
Data was obtained from the Statistic Yearbook of the CECA (The Spanish Confederation of Savings Banks) on annual accounts published by all 47 Spanish Savings Banks for the year 2000. Having been extracted from annual accounts, all the data except number of employees, is measured in monetary units. The list of all institutions is given in Table 1. Rather than use the full name of each institution, the Domain Name of their web page has been employed to identify them. The full Internet address of each institution is of the form www.domainname.es.
After a survey of the inputs and outputs used in the literature, the following inputs and outputs were selected.
Input A: Number of employees
Input B: Fixed assets
Input C: Deposits
Output 1: Operating Income
Output 2: Deposits
There is much agreement on what constitutes inputs and outputs under the production model and under the intermediation model, although not all authors use the same set of inputs and outputs. The list displayed responds to a pragmatic use of available information. A source of debate relates to deposits, which could be seen as inputs or as outputs. See Pastor, Perez and Quesada (1997) for a discussion. Deposits are treated as inputs by Mester (1989), and Elyasiani and Mehdian (1992); they are treated as outputs by Berger and Humphrey (1991), and Ferrier and Lovell (1990); they are treated simultaneously as inputs and outputs by Aly et al (1990). The values of all inputs and outputs for all the Savings Banks are given in Table 1.
Table 1 about here
Notation will be introduced in order to simplify the discussion of the various specifications. Inputs are referred to by means of capital letters, in such a way that the first input is represented by the letter A, the second input by the letter B, and the third one by the letter C. Outputs are referred to by means of numbers. The first input is associated with number 1, the second input with number 2, and the third input with number 3. In this way a specification that treats a savings bank as an institution whose employees (input A) take deposits (output 2) and place loans in the market (output 3) would be labeled A23. If this specification is augmented with fixed assets (input B) and operating income (output 1), the specification becomes AB123. Specification AB123 treats a savings bank as a production unit that employs manpower (A) and plant (B) in order to generate income, deposits, and loans. An intermediation model would be described by a specification such as AC13, in which deposits (C) are treated as an input. Under this specification a savings bank is an institution whose employees collect deposits in order to make loans and generate income.
Other possible views of the way in which a savings bank operates can be generated by using different combinations of inputs and outputs. Efficiency ratios are generated by choosing a specification with only one output and one input. It is, of course, possible to use all possible combinations of inputs with all possible combinations of outputs. The total number of specifications that could possibly be generated with n inputs and m outputs is given by the formula
∑
∑
= = m i i m n i i n 11
C
*
C
where i!(
n i)
!n! n
i Cin
In general, it will not be necessary to calculate efficiencies under all possible specifications, as some of them can be discarded on a priori grounds. In our case there are 3 inputs and 3 outputs, giving a possible total number of specifications of 49. Specifications that treat deposits both as inputs and outputs have been excluded, reducing their total number to 33. The complete list of specifications and the inputs and outputs that they contain can be found in Table 2.
Table 2 about here
DEA efficiencies, on a scale from 0% to 100%, for all savings banks were calculated under Constants Returns to Scale (CRS) for all specifications. The results are given in Table 3.
Table 3 about here
Visual examination of Table 3 reveals some important features. Some savings banks (Cajavital, Bbk, Cajamadrid, Cajanavarra, Bancaja) are 100% efficient under many specifications. In the same way, some savings banks achieve low scores under most specifications. No savings banks is efficient under all specifications, highlighting the fact that the selection of inputs and outputs and, therefore, the view of what constitutes efficiency in the financial sector, is a matter of importance. This was one of the conjectures that guided this research. Take, for example, Bbk, which is 100% efficient under 12 specifications, implying that this is an excellent institution. However, its efficiency drops to 52% under B23. This suggests the presence of some weakness in Bbk, a subject that will be further explored below. A counter example is Cajaen, whose DEA scores tend to be low, but becomes 100% efficient under 4 specifications: BC1, BC13, ABC1, ABC13. This indicates that, although Cajaen can take action to improve its efficiency, it has some strong points that deserve further attention.
indicates that the two institutions follow two different paths to efficiency. What is behind their strategies? Answering such a question was another of the objectives of this research.
In summary, the level of efficiency achieved by a particular financial institution depends on the chosen specification, indicating that specification search is delicate and important. In addition, if two financial institutions achieve the same efficiency score under a given specification they may do so following very different patterns of behavior: there is no single path to efficiency in financial institutions. Exploring what is behind a DEA score is the objective of the next three subsections.
3.2 DEA SPECIFICATION SEARCHES USING MULTIVARIATE METHODS
Although visual inspection of Table 3 is a source of important insights, a more formal analysis of the information it contains will be performed. Table 3 will be treated as a matrix with 47 cases, the savings banks, and 33 variables, the specifications, and analyzed using multivariate statistical methods. The methodological approach will combine PCA, HCA, and Pro-Fit.
[image:11.596.141.344.576.657.2]The results of applying PCA to Table 3 are shown in Table 4. Four eigenvalues take values larger than one, accounting for 96% of the total variance. The first principal component accounts for 47% of the variance. The second principal component is also of importance, as it accounts for a further 21%. The variance accounted for drops to 18% in the case of the third component, and to 10% in the case of the fourth component. Component loadings are given in Table 5. In what follows the discussion will be based on these four components.
Table 4 about here
Table 5 about here
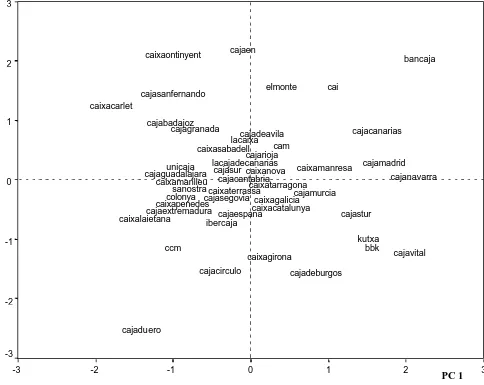
Figure 1 about here
Figure 2 about here
Those savings banks that achieved full 100% efficiency under a majority of specifications (Cajanavarra, Cajamadrid, Cajavital, Kutxa, Bbk) plot towards the right hand side of Figure 1. Those savings banks that consistently underperform plot towards the left hand side of this same figure. It is to be noticed that Caixacarlet, the only institution that no longer exists, having been taken over by Bancaja in July 2001, is located at the extreme of the left hand side. It is, therefore, clear that the first principal component can be interpreted as a “global efficiency score”. An efficiency ranking of savings banks can be obtained by simply looking at the ordering on the first component. Usually, efficiency rankings are based on the concept of super-efficiency introduced by Andersen and Petersen (1993), although other ranking methods have also been proposed; Doyle and Green (1994), Sinuany-Stern and Friedman (1998), and Raveh (2000). The advantage of the ranking procedure proposed here is that it embeds results from many different specifications, while the alternatives produce a ranking for each specification.
Concentrating now on the second component, the North-South direction in Figure 1, it can be observed that Bancaja plots towards the top of the figure, while Cajavital plots towards the bottom. Both are 100% efficient under many specifications. In which way they are different, and what accounts for their achieving full efficiency, will be revealed by attaching meaning to the second principal component. In the same way, interpretation of the position of savings banks in Figure 2 requires that meaning be attached to the third and the fourth principal components.
and outputs were to be selected in order to produce a global assessment of efficiency, any of these three models would be appropriate.
Specifications that include deposits as an input (C) are salient in the second component, in the sense that they achieve high positive component loadings. The third component appears to be associated with fixed asset utilization (input B), and the fourth one with operating income (output 1).
These results can be visualized by means of Pro-Fit and Cluster analysis. This will be done in the next subsection.
3.3 RESULTS VISUALIZATION AND STRATEGIC PATTERN IDENTIFICATION
Each specification generates a DEA score for each savings bank, and each savings bank is located in Figures 1 and 2 by means of its component scores. The relationship between DEA scores and component scores can be assessed by means of regression analysis and visualized. For each specification, a regression was run in which the dependent variable was the efficiency value, and the independent variables were the four component scores. Each institution was treated as a case in the regression. In total, 33 regressions were performed. This procedure is known as Property Fitting (Pro-Fit) analysis; see Schiffman et al (1981). For a given specification, Pro-Fit produces a directional vector on Figures 1 and 2 in such a way that DEA efficiencies grow in the direction of the vector. Directional vectors were calculated for each one of the 33 specifications. Being regression-based, the quality of the representation can be assessed by means of the coefficient of determination, R2, and the F statistic. These are shown in Table 6. It is to be noticed that values of R2 are very high, all of them above 0.90, indicating that there is a strong linear relationship between DEA scores and the position of the savings bank in Figures 1 and 2. The directional vectors are located in Figure 1 and 2 by means of their directional cosines, which are related to the regression coefficients. The value of their standardized directional cosines, -γ1, γ2, γ3, and γ4- and their level of significance, are
Table 6 about here
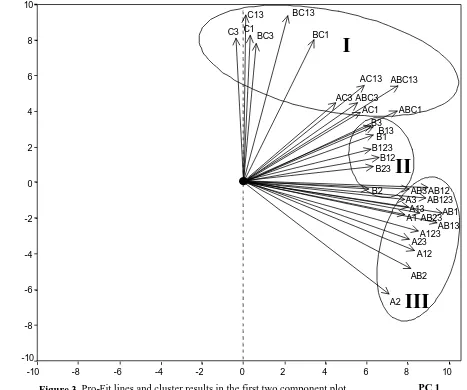
Figure 3 about here
Figure 4 about here
If efficiencies produced by two different specifications are highly correlated, their associated Pro-Fit vectors will plot next to each other. In the same way, if the efficiencies generated by particular specifications are highly correlated with a particular principal component score, the Profit vector will plot in the direction of the axis associated with the given component. The length of the projection of the Pro-Fit vector reflects its relevance in the interpretation of the particular figure. The longer the vector, the more agreement there is between the ordering of the savings banks in the representation and the efficiency values obtained from the specification.
Pro-Fit vectors form a fan in Figure 3. All vectors point in the direction in which efficiency grows. There are 33 specifications, which means that there are 33 definitions of efficiency. Most vectors point in the direction of the first principal component. This confirms the observation that the first principal component gives an overall measure of the efficiency of a savings bank, and that an ordering along the first principal component produces an efficiency ranking of institutions.
A small set of vectors is clearly associated with the second principal component, as they all point towards the top of Figure 3. All such vectors contain deposits as an input, reflecting the fact that the value of the second principal component score is influenced by the decision to model deposits as an input. In other words, amongst the 33 specifications, those that include deposits as an input are a group apart from the rest.
Similar considerations would relate the value of the third principal component to the decision to use specifications that contain as a sole input the value of fixed assets (B), since a fan that includes only B as an input can clearly be discerned on the left hand side of Figure 4.
is clear that vectors that contain output 1 in their definition point towards the bottom of Figure 4, while those that do not contain output 1 in their definition point towards the top of the figure.
All the above discussion has been based on the interpretation of two dimensional projections of a four dimensional data set. Each Pro-Fit vector is plotted in a four dimensional space, and it would be appropriate to assess if the groups that are observed on the projections are true reflections of the groups that exist in the space. For this reason Pro-Fit analysis has been supplemented with Hierarchical Cluster Analysis (HCA). If equivalent specifications exists, they will group into clusters, and if specifications within a cluster share something in common, the analysis will reveal it, with the added bonus that model simplification will naturally follow.
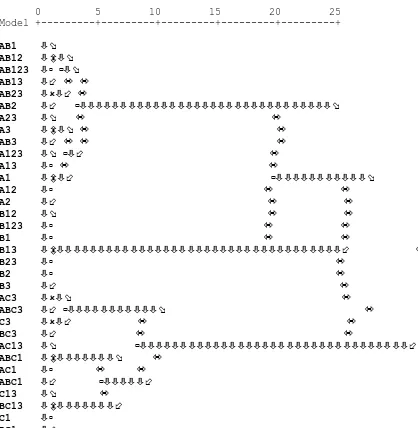
Efficiencies in Table 3 have been taken as inputs for HCA and clustered using Ward’s method with Euclidean distances. This method maximizes within group homogeneity and between group heterogeneity. The dendrogram can be seen in Figure 5.
Figure 5 about here
Specifications group neatly into three clusters in Figure 5. These clusters have been superimposed in Figure 3 and have been labeled I, II, and III.
Cluster I is located at the North and North West of Figure 3, grouping specifications whose Pro-Fit vectors point up or up and to the right of the figure. All the specifications in cluster I contain deposits as input (C). It includes specifications of the type C, AC, BC, or ABC. Deposits as an input are a standard feature of intermediation models.
It can be argued that specifications contained in a given cluster are largely equivalent in the sense that they produce similar efficiency scores for the various savings banks. This can guide input and output selection. Each cluster can be represented by a single specification, reducing the total number of possible specifications from 33 to 3. The selected specification could be the most parsimonious one or the most central one within the cluster.
The superimposition of HCA and Pro-Fit results on the component score map clearly reveals the differences between the various modeling approaches. The decision to opt for an intermediation model or for a production model, which is related to the way in which deposits are treated in the specification, will impact on the efficiencies obtained for individual saving banks. Since Cluster I is clearly associated with the second principal component and clusters II and III are clearly associated with the first principal component, different views of the world will, in general, lead to different assessments of efficiency and to different calls for action. This leads to the conclusion that if we want to study the efficiency of a savings bank, we should not proceed by choosing only one model and only one specification, as this may miss important features of its operations.
3.4 LOOKING BEYOND THE EFFICIENCY SCORE
It has been argued that there is no single definition of efficiency in the context of savings banks. Different views of the way in which savings banks operate, as reflected in the different modeling philosophies will produce different efficiency scores. The combination of PCA, Pro-Fit, and HCA sheds light into the reasons why a particular savings bank achieves a certain efficiency level. This subject will be further examined in what follows.
component in Figure 3. All these specifications contain number of employees (A) in their definition, which leads to the conclusion that Cajavital owes its position in the league table to the good performance of its employees. The specifications that make Bancaja is 100% efficient but not Cajavital can be divided into two groups. The first group contains C13, C3, BC13, BC1, and BC3 whose associated Pro-Fit lines point directly upwards, in the direction of the second principal component. All these contain Deposits as an input, and are specifications that would be developed under the intermediation modeling philosophy. The second group contains specifications B1, B12, B123, B13, B23, and B3, all of them belonging to Cluster II and containing fixed assets (B) in their definition. One can conclude that Bancaja’s strong point is an efficient utilization of its fixed assets, and that Bancaja is a good institution from the intermediation point of view.
This discussion can be extended to the differences and similarities of Bancaja and Cajavital under the third and fourth principal components. Cajavital is located on the positive side of the third principal component, while Bancaja is located on the negative side of this component. Recall that the third principal component is associated with fixed assets (input B), we observe that the use of fixed assets discriminates between the two institutions, a conclusion that has already been arrived at by means of Cluster analysis. The fourth principal component, associated with operating income (output 1), shows little difference between these two savings banks.
side, on the lower half of the figure. We notice that in Figure 4, vectors associated with specifications that contain fixed assets (input B) point on the whole towards the left hand side. This implies that Bbk under performs in specifications that contain fixed assets as an input, something that is coherent with the results shown in Table 3.
4 CONCLUSIONS
There has been much interest and debate on how to model DEA efficiency in financial institutions. This has extended over the type of model (intermediation or production) that is appropriate, as well as to the selection of inputs and outputs once a modeling philosophy has been selected. We have suggested a specification search strategy that highlights the extent to which two different DEA specifications produce similar results and the reasons why this happens.
The methodology proposed relies on estimating a variety of input/output mixtures and analyzing the results by means of multivariate statistical methods. Particular emphasis is given to data visualization, which is achieved by combining Principal Components Analysis, Property Fitting, and Hierarchical Cluster Analysis.
This approach has been applied to the particular case of Spanish savings banks. Three different views of what constitutes efficiency in a savings bank have been identified, although these can be further grouped into two that are related to the intermediation and the production models. The treatment of deposits as an input or as an output has proven to be key in the modeling of financial institutions.
The standard procedure of starting by an a priori view of what inputs and outputs should go into the calculation of efficiency should be revised, as different models and specifications can produce different efficiency results for a given institution. A more realistic view would be to accept that efficiency is a multidimensional concept, and that several models ought to be estimated and combined before managerial action is taken to improve the way in which a financial institution works.
institution which encompasses many specifications; it has made it possible to assess why a particular institution has achieved a given level of efficiency under a given choice of inputs and outputs; and has allowed to identify the various paths to efficiency followed by different institutions which would, under most studies, have been classified as equivalent but that differ in important aspects of their operations.
Further advantages of the method proposed here is that it creates a natural ranking of institutions in terms of efficiency, and that it highlights the strengths and weaknesses of each institution.
REFERENCES
Adler, N., and Golany, B. (2001): Evaluation of deregulated airline networks using data envelopment analysis combined with principal component analysis with an application to Western Europe European Journal of Operational Research, 132 (2), 18-31.
Aly, H., Grabowsky, R., Pasurka, C., and Rangan, N. (1990): Technical, scale, and allocative efficiencies in U.S. banking: an empirical investigation, Review of Economics and Statistics, 72, 211-219.
Andersen P,. and Petersen N.C. (1993): A procedure for ranking efficient units in data envelopment analysis. Management Science, 39, 1261-1264.
Athanassopoulos, A.D. (1997): Service quality and operating efficiency synergies for management control in the provision of financial services: Evidence from Greek bank branches, European Journal of Operational Research, 98 (2), 300-313
Berger, A.N., and Humphrey, D.B., (1991): The dominance of inefficiencies over scale and product mix economies in banking. Journal of Monetary Economics, 28, 117-148.
Berger, A.N., and Humphrey, D.B., (1997): Efficiency of financial institutions: International survey and directions for future research. European Journal of Operational Research, 98 (2), 175-212.
Berger, A.N., and Mester, L.J., (1997) Inside the black box: what explains differences in the efficiencies of financial institutions? Journal of Banking and Finance, 21, 895-947.
Dietsch, M., and Lozano-Vivas, A. (2000): How the environment determines banking efficiency: A comparison between French and Spanish industries, Journal of Banking & Finance, 24 (6), 985-1004
Doyle, J., and Green, R. (1994): Efficiency and cross-efficiency in DEA: derivations, meanings and uses. Journal of the Operational Research Society, 45, 567-578.
Elyasiani, E., and Mehdian, S. (1992): Productive efficiency performance of minority and non-minority owned banks: a nonparametric approach. Journal of Banking and Finance, 16, 933-948.
Ferrier, G., and Lovell, C.A.K. (1990): Measuring cost efficiency in banking: econometric and linear programming evidence, Journal of Econometrics, 46, 229-245.
Hartman, TE.; Storbeck, JE.; Byrnes, P. (2001): Allocative efficiency in branch banking. European Journal of Operational Research, 134, 232-242.
Kuosmanen, T.; Post, T. (2001): Measuring economic efficiency with incomplete price information: with an application to European commercial banks. European Journal of Operational Research, 134, 43-58.
Lovell, C.A.K., and Pastor, J.T. (1997): Target setting: an application to a bank branch network. European Journal of Operational Research, 98, 290-299.
Lozano-Vivas, A. (1997): Profit efficiency for Spanish savings banks, European Journal of Operational Research, 98, 381-394
Lozano-Vivas, A. (1998): Efficiency and technical change for Spanish banks, Applied Financial Economics, 8, 289-300
Mester, L.J. (1989): Testing for expense preference behaviour: mutual versus stock savings and loans. Rand Journal of Economics, 4, 483-498.
Ondrich, J., Ruggiero, J. (2001): Efficiency measurement in the stochastic frontier model. European Journal of Operational Research, 129, 434-442.
Oral, M., Yolalan, R. (1990): An Empirical Study on Measuring Operating Efficiency and Profitability of Bank Branches, European Journal of Operational Research, 46, 282-294. Pastor, J.M. (1999): Efficiency and risk management in Spanish banking: A method to decompose
risk, Applied Financial Economics, 9, 371-385.
Pastor, J.T., and Lovell, C.A.K. (1997): Target setting in a bank branch network, European Journal of Operational Research, 98, 290-299.
Pedraja Chaparro, F., Salinas Jimenez, J., and Smith, P. (1999): On the quality of the Data Envelopment Analysis model. Journal of the Operational Research Society, 50, 636-645. Premachandra, I.M. (2001): A note on DEA vs principal component analysis: An improvement to
Joe Zhu's approach, European Journal of Operational Research, 132, 553-560.
Raveh, A. (2000): The Greek banking system: reanalysis of performance. European Journal of Operational Research, 120, 525-534.
Ruiz Gomez, J.L., Pastor, J., and Sirvent, I. (2002): A statistical test for radial DEA models. Operations Research, forthcoming.
Saha, A., and Ravisankar, T.S. (2000): Rating of Indian commercial banks: A DEA approach, European Journal of Operational Research, 124, 187-203
Schaffnit, C., Rosen, D., and Paradi, J.C. (1997): Best practice analysis of bank branches: An application of DEA in a large Canadian bank, European Journal of Operational Research, 98 (2), 270-290.
Seiford, L.M. and Zhu, J. (1999): Profitability and marketability of the top 55 U.S. commercial banks Management Science, 45 (9), 1270-1288
Serrano-Cinca, C. (1998): “From Financial Information to Strategic Groups - a Self Organizing Neural Network Approach”, Journal of Forecasting, 17, 415-428.
Schiffman, J.F., Reynolds, M.L. and Young, F.W. (1981): Introduction to Multidimensional Scaling: Theory, Methods and Applications. Academic Press, London.
Sinuany-Stern Z., and Friedman L. (1998): DEA and the discriminant analysis of ratios for ranking units. European Journal of Operational Research, 111, 470-478.
Soteriou, A. and Zenios, S.A. (1999): Operations, quality and profitability in the provision of banking services, Management Science, 45 (9), 1221-1238.
Vassiloglou, M. and Giokas, D., (1990): A study of the relative efficiency of bank branches: An application of data envelopment analysis, The Journal of the Operational Research Society, 41, 591-597.
Wilkinson, E (2001): Savings banks are here to stay, Euromoney, 386, 20-21.
Savings Bank Number of employees Fixed assets Operating income Deposits Loans
Bancaja 4,551 37,346 97,758 1,907,234 2,147,534
Bbk 2,511 50,694 73,195 1,666,972 1,088,115
Cai 1,225 16,940 29,548 503,394 478,491
Caixacarlet 83 1,126 952 20,844 20,789
Caixacatalunya 4,801 78,376 93,586 2,486,395 2,276,395
Caixagalicia 3,425 49,775 76,554 1,660,766 1,305,776
Caixagirona 756 6,952 13,776 382,213 241,493
Caixalaietana 773 18,886 13,124 316,066 262,953
Caixamanlleu 380 4,414 6,312 137,480 105,931
Caixamanresa 583 4,893 11,848 267,540 188,761
Caixanova 2,299 32,465 50,584 1,027,050 787,264
Caixaontinyent 218 2,288 2,916 57,378 61,413
Caixapenedes 1,903 35,147 33,188 798,094 715,034
Caixasabadell 1,245 13,951 19,785 466,732 456,653
Caixatarragona 1,164 8,347 18,536 446,508 339,479
Caixaterrassa 1,090 8,884 17,689 416,881 317,650
Cajabadajoz 770 11,030 13,089 244,019 190,024
Cajacanarias 1,044 9,948 25,121 504,200 408,342
Cajacantabria 998 14,265 21,233 434,818 337,316
Cajacirculo 550 12,800 12,613 289,777 153,653
Cajadeavila 578 7,622 12,558 231,719 181,912
Cajadeburgos 753 14,732 18,288 502,969 371,792
Cajaduero 2,459 41,204 38,291 1,203,134 740,224
Cajaen 133 1,130 2,154 37,180 33,609
Cajaespana 2,666 48,512 58,120 1,275,801 976,839
Cajaextremadura 1,063 10,269 17,335 401,218 282,454
Cajagranada 2,049 24,293 32,848 690,784 649,897
Cajaguadalajara 233 2,242 3,460 82,167 69,047
Cajamadrid 10,952 205,193 300,763 6,287,709 5,981,043
Cajamurcia 1,510 20,055 34,940 785,773 622,753
Cajanavarra 1,369 13,398 31,529 841,902 668,661
Cajarioja 411 5,422 7,077 176,630 176,420
Cajasanfernando 2,084 21,750 30,750 605,413 569,226
Cajasegovia 524 9,896 10,522 237,869 211,685
Cajastur 1,324 16,302 32,608 756,633 526,704
Cajasur 2,210 31,473 40,019 912,072 841,895
Cajavital 672 12,961 19,612 504,555 370,498
Cam 5,031 59,676 97,589 2,106,343 2,022,398
Ccm 2,179 31,808 37,089 936,451 676,599
Colonya 63 716 1,030 23,857 18,896
Elmonte 1,982 24,431 38,309 744,619 787,766
Ibercaja 4,241 43,135 68,216 1,789,422 1,478,053
Kutxa 1,654 38,807 47,738 1,100,332 807,668
Lacaixa 19,126 330,404 401,928 7,885,253 7,199,949
Lacajadecanarias 931 13,351 19,492 402,543 340,800
Sanostra 1,412 18,545 22,935 557,223 492,561
Unicaja 4,510 59,741 77,010 1,596,091 1,238,335
Model INPUT OUTPUT
A1 Employees Income
A12 Employees Income, Deposits
A123 Employees Income, Deposits, Loans
A13 Employees Income, Loans
A23 Employees Deposits, Loans
A2 Employees Deposits
A3 Employees Loans
B1 Assets Income
B12 Assets Income, Deposits
B123 Assets Income, Deposits, Loans
B13 Assets Income, Loans
B23 Assets Deposits, Loans
B2 Assets Deposits
B3 Assets Loans
AB1 Employees, Assets Income
AB12 Employees, Assets Income, Deposits
AB123 Employees, Assets Income, Deposits, Loans
AB13 Employees, Assets Income, Loans
AB23 Employees, Assets Deposits, Loans
AB2 Employees, Assets Deposits
AB3 Employees, Assets Loans
C1 Deposits Income
C13 Deposits Income, Loans
C3 Deposits Loans
AC1 Employees, Deposits Income
AC13 Employees, Deposits Income, Loans
AC3 Employees, Deposits Loans
BC1 Assets, Deposits Income
BC13 Assets, Deposits Income, Loans
BC3 Assets, Deposits Loans
ABC1 Employees, Assets, Deposits Income
ABC13 Employees, Assets, Deposits Income, Loans
A1 A12 A123 A13 A23 A2 A3 B1 B12 B123 B13 B23 B2 B3 AB1 AB12 AB123 AB13 AB23 AB2 AB3 C1 C13 C3 AC1 AC13 AC3 BC1 BC13 BC3 ABC1 ABC13ABC3
Bancaja 74 74 86 86 86 56 86 100 100 100 100 100 81 100 100 100 100 100 100 81 100 87 100 100 88 100 100 100 100 100 100 100 100
Bbk 100 100 100 100 88 88 79 55 58 58 55 52 52 37 100 100 100 100 88 88 79 75 75 58 100 100 79 76 76 58 100 100 79
Cai 83 83 83 83 71 55 71 67 67 67 67 52 47 49 92 92 92 92 76 61 76 100 100 84 100 100 84 100 100 84 100 100 84
Caixacarlet 39 39 45 45 45 33 45 32 34 34 32 34 29 32 44 44 49 49 49 38 49 78 89 89 78 89 89 78 89 89 78 89 89
Caixacatalunya 67 69 86 86 86 69 86 46 51 55 51 55 50 51 71 71 89 89 89 73 89 64 81 81 74 91 91 65 81 81 74 91 91
Caixagalicia 77 77 77 77 69 65 69 59 61 61 59 53 53 46 84 84 84 84 73 71 73 79 80 70 87 87 76 80 81 70 88 88 76
Caixagirona 62 67 67 62 67 67 58 76 87 87 76 87 87 60 78 78 87 78 87 87 66 61 63 56 70 70 62 76 76 60 78 78 66
Caixalaietana 58 58 62 62 62 54 62 27 28 28 27 27 27 24 58 58 62 62 62 54 62 71 78 74 71 78 74 71 78 74 71 78 74
Caixamanlleu 57 57 57 57 51 48 51 55 57 57 55 50 50 42 66 66 66 66 56 56 56 78 79 68 78 79 68 79 79 68 79 79 68
Caixamanresa 70 70 70 70 61 61 59 93 97 97 93 87 87 67 93 93 97 93 87 87 68 75 75 63 81 81 66 93 93 67 93 93 68
Caixanova 75 75 75 75 62 60 62 60 60 60 60 50 50 42 83 83 83 83 66 66 66 84 84 68 89 89 71 85 85 68 89 89 71
Caixaontinyent 46 46 51 51 51 35 51 49 49 49 49 48 40 47 54 54 57 57 57 42 57 87 97 95 87 97 95 87 97 95 87 97 95
Caixapenedes 60 60 68 68 68 56 68 36 39 39 36 39 36 35 61 61 69 69 69 57 69 71 80 80 72 80 80 71 80 80 72 80 80
Caixasabadell 54 54 67 67 67 50 67 54 58 60 57 60 53 57 64 64 74 74 74 59 74 72 87 87 72 87 87 74 87 87 74 87 87
Caixatarragona 55 55 55 55 53 51 53 85 91 91 85 85 85 71 85 85 91 85 85 85 71 71 75 68 71 75 68 85 85 71 85 85 71
Caixaterrassa 56 56 56 56 53 51 53 76 81 81 76 75 75 62 76 76 81 76 75 75 62 72 75 68 72 75 68 81 81 68 81 81 68
Cajabadajoz 58 58 58 58 45 42 45 45 45 45 45 35 35 30 64 64 64 64 48 47 48 91 91 69 91 91 69 91 91 69 91 91 69
Cajacanarias 82 82 82 82 71 64 71 96 97 97 96 82 81 71 100 100 100 100 82 81 81 85 85 72 94 94 78 97 97 72 100 100 81
Cajacantabria 73 73 73 73 61 58 61 57 58 58 57 49 49 41 80 80 80 80 65 64 65 83 83 69 86 86 70 83 83 69 87 87 70
Cajacirculo 79 79 79 79 70 70 51 38 40 40 38 36 36 21 79 79 79 79 70 70 51 74 74 47 87 87 53 74 74 47 87 87 53
Cajadeavila 74 74 74 74 57 53 57 63 63 63 63 48 48 42 84 84 84 84 62 60 62 92 92 70 92 92 70 93 93 70 93 93 70
Cajadeburgos 83 89 90 90 90 89 90 47 54 54 47 54 54 44 83 83 90 90 90 89 90 62 68 66 83 90 90 64 68 66 84 90 90
Cajaduero 53 65 65 55 65 65 55 36 46 46 36 46 46 31 56 56 68 56 68 68 56 54 59 55 61 62 60 54 59 55 61 62 60
Cajaen 55 55 55 55 46 37 46 73 73 73 73 56 52 52 73 73 73 73 56 52 53 99 99 80 99 99 80 100 100 80 100 100 80
Cajaespana 75 75 75 75 66 64 66 46 48 48 46 42 42 35 76 76 76 76 67 65 67 78 79 68 85 85 73 78 79 68 85 85 73
Cajaextremadura 56 56 56 56 50 50 48 64 68 68 64 62 62 48 68 68 69 68 62 62 55 74 74 63 74 74 63 79 79 63 79 79 63
Cajagranada 55 55 58 58 58 45 58 52 53 53 52 50 45 47 63 63 65 65 63 52 63 81 88 84 81 88 84 81 88 84 81 88 84
Cajaguadalajara 51 51 54 54 54 47 54 59 63 63 59 60 58 54 62 62 64 64 61 58 61 72 79 75 72 79 75 75 79 75 76 79 75
Cajamadrid 94 94 99 99 99 76 99 56 57 57 56 54 49 51 95 95 100 100 100 77 100 81 89 84 100 100 100 82 89 84 100 100 100
Cajamurcia 79 79 79 79 75 69 75 67 70 70 67 62 62 54 89 89 89 89 81 78 81 76 79 70 88 88 79 81 81 70 91 91 81
Cajanavarra 79 82 89 89 89 82 89 90 100 100 90 100 100 87 95 95 100 100 100 100 100 64 72 71 82 89 89 90 90 87 95 100 100
Cajarioja 59 59 78 78 78 57 78 50 54 59 57 59 52 57 66 66 84 84 84 65 84 68 89 89 70 90 90 69 89 89 71 90 90
Cajasanfernando 51 51 51 51 50 39 50 54 54 54 54 49 44 46 60 60 61 61 55 47 55 87 92 84 87 92 84 87 92 84 87 92 84
Cajasegovia 69 69 73 73 73 60 73 41 43 43 41 41 38 37 69 69 74 74 74 61 74 75 83 79 80 86 83 75 83 79 80 86 83
Cajavital 100 100 100 100 100 100 100 58 63 63 58 62 62 50 100 100 100 100 100 100 100 66 71 65 100 100 100 71 71 65 100 100 100
Cam 66 66 73 73 73 56 73 62 65 65 62 63 56 59 77 77 80 80 80 65 80 79 88 85 80 88 85 82 88 85 83 88 85
Ccm 58 58 58 58 57 57 56 45 49 49 45 47 47 37 64 64 65 64 63 63 60 67 71 64 69 72 65 67 71 64 69 72 65
Colonya 56 56 56 56 54 50 54 55 58 58 55 53 53 46 65 65 66 66 60 59 60 74 78 70 74 78 70 75 78 70 76 78 70
Elmonte 66 66 72 72 72 50 72 60 60 60 60 57 49 56 76 76 79 79 79 58 79 88 97 94 88 97 94 88 97 94 88 97 94
Ibercaja 55 56 63 63 63 56 63 60 67 67 60 67 66 60 66 66 71 71 71 68 71 65 74 73 66 74 74 71 74 73 71 74 74
Kutxa 99 99 99 99 89 89 89 47 50 50 47 45 45 36 99 99 99 99 89 89 89 74 75 65 99 100 89 74 75 65 99 100 89
Lacaixa 72 72 72 72 68 55 68 46 47 47 46 41 38 38 75 75 75 75 70 57 70 87 91 81 87 91 81 87 91 81 87 91 81
Lacajadecanarias 72 72 72 72 66 58 66 56 57 57 56 50 48 44 79 79 79 79 71 64 71 82 85 75 85 87 77 83 85 75 85 87 77
Sanostra 56 56 63 63 63 53 63 47 51 51 47 51 48 46 63 63 68 68 68 60 68 70 79 79 70 79 79 70 79 79 70 79 79
[image:26.842.32.812.58.201.2]Component Eigenvalue % of variance Cumulative
PC1 15.596 47.261 47.261
PC2 7.012 21.248 68.509
PC3 5.962 18.067 86.576
PC4 3.416 10.351 96.926
PC5 .475 1.440 98.366
PC6 .188 .570 98.936
[image:27.596.143.419.174.282.2]PC7 .107 .324 99.260
PC1 PC2 PC3 PC4
A1 .828 -.279 .363 -.298
A12 .819 -.350 .342 -.264
A123 .849 -.289 .403
-A13 .858 -.234 .421
-A23 .790 -.321 .397 .303
A2 .717 -.644 .238
-A3 .790 -.186 .413 .386
B1 .640 .296 -.701
-B12 .637 .174 -.748
-B123 .640 .174 -.744
-B13 .647 .298 -.696
-B23 .622 - -.729 .251
B2 .603 - -.772 .147
B3 .598 .333 -.602 .394
AB1 .945 - - -.282
AB12 .945 - - -.282
AB123 .961 -.166 -
-AB13 .975 - -
-AB23 .883 -.249 - .333
AB2 .824 -.494 -.232
-AB3 .857 - .195 .448
C1 - .809 .184 -.521
C13 - .927 .294
-C3 - .786 .260 .536
AC1 .591 .346 .432 -.547
AC13 .577 .527 .559 -.145
AC3 .448 .442 .503 .547
BC1 .340 .781 -.240 -.426
BC13 .217 .940 -
-BC3 - .781 .169 .582
ABC1 .751 .365 .115 -.488
ABC13 .724 .513 .302 -.173
ABC3 .524 .424 .414 .557
Directional cosines Model
γγ1 γγ 2 γγ 3 γγ 4
F Adj R2
0.83 -0.28 0.37 -0.30 681.8 0.98
A1
(43.59)** (-14.66)** (19.12)** (-15.68)**
0.83 -0.35 0.35 -0.27 527.2 0.98
A12
(37.99)** (-16.23)** (15.86)** (-12.26)**
0.86 -0.29 0.41 -0.01 309.5 0.96
A123
(30.38)** (-10.33)** (14.43)** (-0.40)
0.87 -0.24 0.43 -0.02 327.5 0.97
A13
(31.56)** (-8.59)** (15.49)** (-0.79)
0.80 -0.32 0.40 0.31 429.3 0.97
A23
(33.13)** (-13.44)** (16.66)** (12.72)**
0.72 -0.65 0.24 0.00 711.6 0.98
A2
(38.55)** (-34.59)** (12.82)** (0.14)
0.80 -0.19 0.42 0.39 483.1 0.98
A3
(35.11)** (-8.27)** (18.36)** (17.17)**
0.64 0.30 -0.70 -0.07 1636.5 0.99
B1
(51.97)** (24.03)** (-56.89)** (-5.58)**
0.64 0.17 -0.75 0.00 1931.9 0.99
B12
(56.12)** (15.31)** (-65.91)** (-0.13)
0.64 0.17 -0.75 0.03 1832.3 0.99
B123
(54.95)** (14.95)** (-63.88)** (2.30)*
0.65 0.30 -0.70 -0.03 1377.7 0.99
B13
(48.18)** (22.24)** (-51.85)** (-2.55)*
0.63 0.09 -0.73 0.25 951.5 0.99
B23
(38.61)** (5.41)** (-45.20)** (15.59)**
0.61 -0.05 -0.78 0.15 649.8 0.98
B2
(30.97)** (-2.70)** (-39.69)** (7.56)**
0.60 0.34 -0.61 0.40 720.7 0.98
B3
(32.32)** (18.03)** (-32.53)** (21.33)**
0.95 -0.08 -0.06 -0.28 609.3 0.98
AB1
(47.07)** (-4.09)** (-2.77)** (-14.05)**
0.95 -0.08 -0.06 -0.28 609.3 0.98
AB12
(47.07)** (-4.09)** (-2.77)** (-14.05)**
0.98 -0.17 -0.08 -0.07 262.0 0.96
AB123
(31.72)** (-5.47)** (-2.54)* (-2.29)*
0.99 -0.09 0.02 -0.08 291.6 0.96
AB13
(33.89)** (-3.14)** (0.76) (-2.67)*
0.90 -0.25 -0.03 0.34 211.6 0.95
AB23
(26.31)** (-7.42)** (-0.94) (9.91)**
0.83 -0.50 -0.23 0.05 501.1 0.98
AB2
(37.29)** (-22.34)** (-10.50)** (2.20)*
0.87 -0.08 0.20 0.45 505.8 0.98
AB3
(38.96)** (-3.50)** (8.86)** (20.36)**
0.04 0.82 0.19 -0.53 260.7 0.96
C1
(1.26) (26.64)** (6.06)** (-17.17)**
0.00 0.95 0.30 -0.05 193.3 0.94
C13
(0.07) (26.47)** (8.39)** (-1.50)
-0.03 0.80 0.26 0.54 369.1 0.97
C3
(-1.08) (30.61)** (10.14)** (20.87)**
0.60 0.35 0.44 -0.56 223.8 0.95
AC1
(18.09)** (10.60)** (13.24)** (-16.74)**
0.59 0.54 0.58 -0.15 180.2 0.940
AC13
(15.94)** (14.55)** (15.45)** (-4.01)**
0.46 0.45 0.52 0.56 192.0 0.94
AC3
(12.76)** (12.57)** (14.30)** (15.58)**
0.35 0.80 -0.24 -0.43 280.9 0.96
BC1
(11.59)** (26.66)** (-8.18)** (-14.53)**
0.22 0.97 -0.05 -0.08 162.6 0.93
BC13
(5.71)** (24.74)** (-1.27) (-2.06)*
0.05 0.79 0.17 0.59 493.7 0.98
BC3
(2.26)* (35.07)** (7.58)** (26.12)**
0.77 0.37 0.12 -0.50 189.9 0.94
ABC1
(21.26)** (10.32)** (3.26)** (-13.80)**
0.76 0.54 0.32 -0.18 105.1 0.90
ABC13
(15.58)** (11.03)** (6.50)** (-3.72)**
0.54 0.44 0.43 0.58 153.1 0.93
ABC3
(13.39)** (10.85)** (10.60)** (14.24)**
** Significant at the 0.01 level. * Significant at the 0.05 level
PC 2
Figure 1. Plot of the first and the second principal component scores
PC 1 3
2 1 0 -1 -2 -3 3 2 1 0 -1 -2 -3 cai ibercaja cajavital caixapenedes caixanova bancaja
caixaterrassa caixatarragona cajasanfernando elmonte
cajasegovia cajacantabria cajacanarias kutxa cajaduero caixasabadell colonya cajanavarra lacajadecanarias sanostra cajastur caixaontinyent cajamurcia caixalaietana caixamanresa caixamanlleu
PC 4
Figure 2. Plot of the third and the fourth principal component scores
10 8 6 4 2 0 -2 -4 -6 -8 -10 10 8 6 4 2 0 -2 -4 -6 -8 -10 ABC3 ABC13 ABC1 BC3 BC1
AC3 AC13 AC1 C3 C13 C1 AB3 AB2 AB23 AB13 AB123 AB12
[image:32.596.52.519.140.530.2]AB1 B3 B2 B23 B13 B123 B12 B1 A3 A2 A23 A13 A123 A12 A1
III
II
PC 2Figure 3. Pro-Fit lines and cluster results in the first two component plot. PC 1
I
PC 4
Figure 4. Pro-Fit results on the third and the fourth components plot
0 5 10 15 20 25 Model +---+---+---+---+---+
AB1 òø AB12 òôòø AB123 òú ùòø AB13 ò÷ ó ó AB23 òûò÷ ó
AB2 ò÷ ùòòòòòòòòòòòòòòòòòòòòòòòòòòòòòòòø
A23 òø ó ó A3 òôòø ó ó AB3 ò÷ ó ó ó A123 òø ùò÷ ó A13 òú ó ó
A1 òôò÷ ùòòòòòòòòòòòø A12 òú ó ó A2 ò÷ ó ó B12 òø ó ó B123 òú ó ó B1 òú ó ó
B13 òôòòòòòòòòòòòòòòòòòòòòòòòòòòòòòòòòòòò÷ ó
B23 òú ó B2 òú ó B3 ò÷ ó AC3 òûòø ó
ABC3 ò÷ ùòòòòòòòòòòòø ó
C3 òûò÷ ó ó BC3 ò÷ ó ó
AC13 òø ùòòòòòòòòòòòòòòòòòòòòòòòòòòòòòòòòò÷
ABC1 òôòòòòòòòø ó
AC1 òú ó ó ABC1 ò÷ ùòòòòò÷ C13 òø ó
BC13 òôòòòòòòò÷
[image:34.596.70.488.95.523.2]C1 òú BC1 ò÷