ISSN 0252-8~66
EUROSTATISTIK
Oaten zur Konjunkturanalyse
EUROSTATISTICS
Data for short-term economic analysis
EUROSTATISTIQUES
Donnees pour l'analyse de 'lq-~onjoncture
-~
eurostat
STATISTISCHES AMT DER EUROP.AISCHEN GEMEINSCHAFTEN
STATISTICAL OFFICE OF THE EUROPEAN COMMUNITIES
OFFICE STATISTIOUE DES COMMUNAUTES EUROPEENNES
L-2920 Luxembourg -
Tel. 43011, Telex: Comeur Lu 3423
8-1049 Bruxelles, Batiment Berlaymont, Rue de la Loi 200 (Bureau de liaison) -
Tel. 23511 11
Diese Veroffentlichung ist bei den auf der dritten Umschlagseite aufgefuhrten Vertriebsburos erhaltlich.
This publication is obtainable from the sales offices mentioned on the inside back cover.
EUROSTATISTIK
Oaten zur Konjunkturanalyse
EUROSTATISTICS
Data for short-term economic analysis
EUROSTATISTIQUES
Luxembourg : Office des publications officielles des Communautes europeennes. 1 983
Kat./cat.: CA-BJ-83-01 2-3A-C
lnhaltswiedergabe nur mit Ouellennachweis gestattet
Reproduction of the contents is subject to acknowledgement of the source
La reproduction du contenu est subordonnee
a
!'indication de la source
Hinweis
Die Veroffentlichung Eurostatistik -
Daten zur Konjunkturanalyse
ist
eine von drei Sch/Osselveroffentlichungen des Eurostat, die dem Leser
einen Oberblick Ober die wichtigsten quantitativen Oaten geben sol/en,
die fur die Gemeinschaft und die Mitgliedstaaten zur VerfOgung stehen.
Die anderen Veroffentlichungen in dieser Reihe sind Statistische
Grundzahlen
mit Oaten for ein bestimmtes Jahr sowie Eurostat-Revue
mit einem ZehnjahresOberblick Ober die Gemeinschaft in Zah/en.
Eine monatliche Veroffentlichung mit laufenden Wirtschaftsdaten mu/3
standig angepa/3t und auf den neuesten Stand gebracht werden. Zu
Beginn des Jahres 1982 wurde mit der Einbeziehung von Oaten for
Griechenland und der Abwandlung der Aufmachung eine bedeutende
Anderung vorgenommen. Im Laufe des Jahres 1982 werden nach und
nach Gesamtzahlen for die 10 Mitg/iedstaaten der Gemeinschaft
aufgenommen. Saba/d genOgend Oaten zur VerfOgung stehen, wird das
Basisjahr 197 5, das die Grund/age for diese Veroffentlichung bildet,
durch das Jahr 1980 ersetzt werden. Zu einem spateren Zeitpunkt ist
vorgesehen, Oaten for die beiden beitrittswilligen Lander Portugal und
Spanien sowie for die Vereinigten Staaten und Japan hinzuzufOgen.
Es werden vier Arten van Oaten in Eurostatistik veroffentlicht. Auf den
Seiten 5 und 6 findet sich ein Artikel ,, Kurz natiert~ der sich mit den
jOngsten Tendenzen bei den verfOgbaren Oaten befa/3t. Die Seiten 15
: ·
bis 20 enthalten eine schematische Darstellung der wichtigsten
wirtschaft/ichen Reihen tor die Gemeinschaft und die Mitgliedstaaten.
Die Seite 23 ist die erste van 56 Seiten mit ,, Gemeinschaftstabellen~
Dieser Abschnitt enthlilt von Eurastat auf der Grund/age von
Gemeinschaftskriterien harmonisierte Oaten. Die neuesten Oaten sind
varlaufig und in einigen Fallen van Eurostat geschatzt. Schlie/3/ich
enthlilt die Veroffentlichung noch einen Abschnitt ,, Landertabellen
~der
eine Auswahl der in jedem Land am haufigsten verwendeten
Konjunkturindikatoren enthlilt. Hierbei handelt es sich um nationale
Reihen auf der Grund/age nationaler Definitianen. Zu Vergleichszwecken
ist auch eine Tabelle for die Vereinigten Staaten enthalten.
In alien Fallen stehen auf Anfrage Zeitreihen Ober die Cronos-Datenbank
des Eurostar zur VerfOgung. Es werden aul3erdem statistische Bulletins
Ober Arbeitslosigkeit, Preise, industrielle Produktion, Zahlungsbilanzen,
Aul3enhandel und Energie monatlich ader vierte/jahrlich veroffent/icht. In
Eurostatistik
se/bst ist ein absolutes Minimum an Erlauterungen zur
Methodik enthalten. AusfOhrliche lnformationen Ober Definitionen und
Methodik sind bei Eurostat erhaltlich.
Eurostatistik
wird am Ende eines jeden Monats in einer gemeinsamen
Ausgabe for Deutsch, Englisch und Franzosisch veroffentlicht. DarOber
hinaus steht auf Anfrage eine Erganzung mit Obersetzung der Titel und ·
der Erlauterungen ins Danische, Griechische, ltalienische und
I nhaltsverzeich n is
.Kurz notierr ... . Schaubilder ... .
GEMEINSCHAFTSTABELLEN ... .
1. Volkswirtschaftliche Gesamtrechnungen
-ESVG .. ... .
Veranderung des Volumens ... . Veranderung der Preise ... .
2. Beschiftigung ... .
Bev61kerung ... . Beschaftigung ... .
3. Arbeitslosigkeit ... .
4. lndizes der industriellen Produktion ... .
lndustrie, Baugewerbe ... . Erzeugung nach Kategorien ... . Erzeugung nach Produktionsbereichen ... . Konjunkturempfindliche Bereiche ... .
5. Meinungsumfrage in der lndustrie (1) ... .
6. Produktionsstatistik ... .
lndustrieerzeugnisse ... . Landwirtschaftliche Erzeugnisse ... .
7. AuBenhandel ... .
Hauptindikatoren ... . Handel mit Drittlandern ... . lnnergemeinschaftlicher Handel ... . Handel nach Uindern ... .
8. Praise ... .
lndizes der Verbraucherpreise ... . lndizes der Erzeugerpreise ... . lndizes der L6hne und Gehalter in der lndustrie ..
9. Finanzstatistik ... .
Wechselkurse ... . Wichtigste Finanzstatistiken ... .
10. Zahlungsbilanz ... .
Wichtigste Salden ... .
L..ANDERTABELLEN ... .
Belgique/Belgiij ... .
Dan mark ... .
BR Deutschland ... .
E/\/\AD.A
... .
France ... .Ireland ... .
Seite
5
15
21
23
23
24
25
25
26
'28
31
31
32
33
35
37
41
41
45
46
46
4955
6,1
65
65
68
69
70
70
72
74
74
79
85
86
87
88
89
90
Italia. . .
91
Luxembourg . . . 9 2
Nederland . . . 93
United Kingdom . . . 94
United States . . . 9 5
(1) Die in diesem Teil des Bulletins enthaltenen Angaben stellen die Ergebnisse der Konjunkturerhebung bei den Unternehmem in der Gemeinschaft dar. Ausfuhrlichere Oaten warden in .Europ~ische Wirt-schatt· verOffentlicht.
4
Zeichen und Abkurzungen
0
1-4
&+a
%
'k,
T4/f0
%,T12/f0
%,SALDO
*
1975= 100
EUR 9= 100
EUR
10= 100
MIO
MRO
T
TROEE
GWH
M3
OM
FF
LIT
HFL
BFR
LFR
UKL
IRL
OKR
USO·
ECU
SZR
EG
Eurostat
EUR9
EUR 10
UEBL/BLEU
ACP
ESVG
NACE
SITC
NichtsWeniger als die Halfte der verwendeten Einheit Kein Nachweis vorhanden
Von
1
bis 46
und 8 ProzentProzentualer Zuwachs eines Vierteljahres gegenOber dem entsprechenden Vierteljahr des Vorjahres
Prozentualer Zuwachs eines Monats gegenOber dem entsprechendenMonat des Vorjahres Saldo zwischen den positiven Antworten (Zunahme. Verbesserung der Situation) und den negativen Antworten (Abnahme,
Verschlechterung der Situation) der
Konjunkturbefragung bei den Unternehmern in der Gemeinschaft
Saisonbereinigt (Landertabellen) Basisjahr ·
Prozentuale Angaben im VerMltnis zur Gemeinschaft der 9 (
=
100)Prozentuale Angaben im Verhaltnis zur Gemeinschaft der 1 0 (
=
1 00) MillionMilliarde Metrische Tonne Tonne Roh61einheiten Gigawattstunde
=
1
oa
kWh Kubikmeter Deutsche Mark Franzosischer Franc ltalienische Lira Hollandischer Gulden Belgischer Franc Luxemburgischer Franc Pfund- Sterling lrisches Pfund Danische Krone US-Dollar Europaische Wahrungseinheit Sonderziehungsrechte Europaische Gemeinschaft[en] Statistisches Arnt der Europaischen GemeinschaftenGesamtheit der Mitgliedslander der Europaischen Gemeinschaften bis 1 980 Gesamtheit der Mitgliedslander der Europaischen Gemeinschaften ab · 1 981 Belgisch-luxemburgische Wirtschaftsunion · Lander Afrikas. der Karibik und des Pazifiks -Abkommen von Lome
Europaisches System Volkswirtschaftlicher Gesamtrechnungen
Allgemeine Systematik der Wirtschaftszweige in den Europaischen Gemeinschaften
Eurostatistik · Kurz notiert
1 . Arbeitslosigkeit : Seit sechs Monaten keine wesentliche
Aenderung
Der Stand der Arbeitslosigkeit in der Gemeinschaft im Zeitraum
1980 bis Marz 1983 ist durch nur zwei Zahlenangaben
ausrei-chend beschrieben :
6 Millionen Arbeitslose Anfang 1 980.
12 Millionen Arbeitslose im Marz 1983.
Seit Marz des Jahres ist eine gewisse Stabilisierung
festzustel-len, da die saisonbereinigte Zahl der Arbeitslosen bei rund
12
Millionen. darunter 7 Millionen Manner und 5 Millionen Frauen.
zum Stillstand gekommen ist.
Die seit
6
Monaten festzustellenden Schwankungen sind
haupt-sachlich auf jahreszeitliche EinflOsse zurOckzufOhren.
In den
USA vollzieht sich ein ungewohnlich starker ROckgang
der Arbeitslosenzahl. lnnerhalb von 9 Monaten IJanuar bis
September
1983) ist sie um rund 1 Million gesunken. und zwar
von
10.4 Millionen im Jahr 1983 auf 9.3 Millionen im
Sep-tember.
Japan zeigt mit rund
1, 5
Millionen nach wie vor einen Oberaus
niedrigen Stand der Arbeitslosenzahl.
Der Anteil der Arbeitslosen von weniger als
25 Jahren in der
Gemeinschaft wird sowohl tor September als auch fur Oktober
1 983 auf 410/o geschatzt. Auch fur die jOngeren Arbeitslosen
gilt die Feststellung, dass die Arbeitslosigkeit bei Frauen im
allgemeinen hoher ist als bei Mannern. Rund ein Drittel der
mannlichen -
gegenOber ungefahr der Halfte der weiblichen
-Arbeitslosen waren weniger als
25 Jahre alt. Der Anteil junger
Arbeitsloser ist in Luxemburg
(540/o). Italian (500/o), Frankreich
(450/o). den Niederlanden (41 Ofo)
und im Vereinigten K6nigreich
(410/o) am hochsten.
2. Der Index der Verbraucherpreise im Zeitraum Januar bis
Oktober 1983 :
Die meisten Staaten schneiden besser ab als
1982.
Seit Beginn des Jahres (im Zeitraum Januar bis Oktober
1983)
ist der Index der Verbraucherpreise (EUR
1 OJ um 7. 1 0/o
ange-stiegen. wahrend die Steigerung im gleichen Zeitraum
1982
8. 1 0/o betrug. Das lnflationstempo hat nicht unerheblich
nach-gelassen. Unter den Mitgliedstaaten. die in der
lnflationsbe-kampfung
am
erfolgreichsten
waren.
sind . Deutschland
(-48.80/o gegenOber dem gleichen Zeitraum in 1982).
Dane-mark (-42.00/o) und die Niederlande ( -41.30/o) zu erwahnen.
Sehr gut gehalten haben sich auch Luxemburg
(-22.20/o),
Italian
(20.3%). Belgien (-20.00/o) und das Vereinigte
Konig-reich ( -
7. 80/o). Dagegen ist die Inflation in Griecheland um
10. 70/o und in Frankreich um 9. 10/o angestiegen. Die Erhohung
des Index der Verbraucherpreis fOr den Zeitraum vom
1.
Januar
1 983 bis zum 31 . Oktober 1 983 erreicht in den einzelnen
Mitgliedstaaten im einzelnen folgende Werte (in Klammern
ent-sprechende Steigerung im gleichen Zeitraum
1 982) :
D
2, 10/o (4, 10/o)
l
11.00/o (13,80/o)
NL
2. 70/o (4.60/o)
GR
16.60/o (150/o)
VK
4.70/o (5, 10/o)
EUR
10
7, 10/o
(8,
10/o)
DK
5. 10/o (8,80/o)
USA
3.60/o (4, 50/o)
8
L
F
6,40/o (8,00/o)
7,00/o (9,00/o)
8,40/o (7. 70/o)
Japan
ESP
p
2,60/o (3.10/o)
9,30/o (11.10/o)
25, 70/o (14.90/o)
3. Index der industriellen produktion im September 1983 :
Betrichtliche Steigerung
Der Gemeinschaftsindex der industriel/en Produktion (EUR
10)
fur September
1983 belauft sich auf 11 5,4. Das entspricht
einem Anstieg um
1, 10/o gegenOber September 1982.
Der saisonbereinigte Index fur EUR
10 betragt 113,3 fur den
Monat September und liegt damit nicht wesentlich unter dem
gegenwartig fur August errechneten Index um
113.8.
Der Tendenzindikator (Mittelwert der letzten drei Monate im
Vergleich zu den vorangegangenen drei Monaten) zeigt -
wie
bereits im vergangenen Monat -
einen signifikanten Anstieg
von
1 ,40/o was einer Steigerung entspricht wie sie seit 1 9 7 9
nicht mehr verzeichnet werden konnte. In allen Landern der
Gemeinschaft deuten die letzten Tendenzindikatoren eine
wei-tere Aufwartsbewegung an.
4. Stahl
Im Oktober
1 983 ist die Rohstahlerzeugung der Gemeinschaft
(ohne Griechenland) zum dritten Mai in aufeinanderfolgenden
Monaten (um
4, 10/o saisonbereinigt) angestiegen. Mit 10,2
Mio t wurde das Produktionsergebnis vom Oktober
1982 um
20. 70/o Obertroffen. Der Ausstoss der ersten zehn Monate
1 983 blieb jedoch im Durchschnitt um 5.80/o hinter dem des
entsprechenden Vorjahresabschnitts zurock.
Der Auftragseingang
(Massenstahl) hat sich
im August
gegenOber Juli
1983 -
nach Saisonbereinigung -
um
3,40/o
auf
5,4 Mio t verringert. Er war damit um 21.50/o hoher als im
August
1982, jedoch um 9.20/o niedriger als im August 1981.
6. Energieverbrauch zur Elektrizititserzeugung 1982
Die ElektriziUltserzeugung der Gemeinschaft
wies
1982
diesel-ben Merkmale auf. wie
1 981 :
die Gesamterzeugung blieb nahezu unverandert (
-0. 20/o
gegenOberdemVorjahrj;
die Diversifizierung der Energiequellen machte kraftige
Fort-schritte.
Der zuletzt genannte Aspekt wird durch folgendes
Zahlenmate-rial erhellt :
erhebliche Steigerung (
+
1 2, 90/o) des Kernenergieeinsatzes;
-
schwache Zunahme (
+
1,30/o) des Steinkohleneinsatzes;
-
deutlicher ROckgang des Einsatzes von Mineralolprodukten
and Naturgas
(-10,40/o bzw. -2. 70/o).
Unter den eingesetzten Energietragern steht an erster Stelle die
Steinkohle mit
36, 70/o, dann folgen Kernenergie mit 22. 70/o
sowie Mineralolprodukte mit
16.8 0/o.
6. EG-Aussenhandel
6
zweiten Ouartal nach einem Zeitraum rocklaOfiger Bewegung.
sich Wertmassig zu erhohen. Der Aufschwung hat im dritten
Ouartal angehalten, · und die Ausfuhr war um 7% hoher als im
gleichen Ouartal 1982 (bezogen auf die um Belgien/Luxemburg
verminderte EG. · da for den Bereich noch kein Zahlenmaterial
vorliegt). Die Steigerungen gegenuber dem entsprechenden
Vorjahresmonat betrugen im August und September 9 bzw.
11
%.
Die Septemberzahlen waren im Fall Frankreichs. ltaliens.
lrlands und Danemarks besonders gut; alle genannten Staaten
verzeichneten Zuwachse von mehr als 20 %.
Die Gemeinschaftseinfuhr aus Drittlandern scheint nicht weiter
zu sinken. Nach einem Nullwachstum im zweiten Vierteljahr
stieg der Einfuhr um 3% im dritten Ouartal. Einerseits zeigten
Deutschland. die Niederlande. Irland und Danemark deutliche
Anzeichen eines Aufschwungs beim Einfuhrwachstum.
Anderer-seits ist die Einfuhr aus Drittlandern nach Frankreich. ltalien und
Griechenland nach wie vor im Sinken begriffen.
Die Kluft zwischen Gemeinschaftseinfuhr und
Gemeinschafts-ausfuhr verringert sich auch weiterhin, wobei Frankreich. Italian
und (in dem Zeitraum. fur den Oaten vorliegen)
Belgien/luxem-burg besonders schnelle Fortschritte im Hinblick auf eine
Redu-zierung ihres Handelsdefizits machen.
7. tnnergemeinschaftlicher Handel
Notice
Eurostatistics -
data for short-term economic analysis
is one of three
key Eurostat publications designed to give the reader an overview of the
most important quantitative information available for the Community and
Member States. The other publications in this series are Basic Statistics
giving data for a specific year, and Eurostat review with its summary of
the Community in figures over the past 10 years.
A monthly publication with current economic data must be continually
adapted and updated. At the beginning of 1982 a major modification
took place with the inclusion of data for Greece and a change in
presentation. Totals for the 10-member Community are being
progressively introduced in 1982. Once sufficient data are available,
the base year 197 5 which is fundamental to this publication will be
replaced with 1980. At a later stage it is planned to add data for the
two applicant countries, Portugal and Spain, as well as for the United
States and Japan.
Four kinds of information are published in Eurostatistics. Pages 9 and
1 O offer an article 'In brief' which looks at the latest trends in the data
available. Pages 15 to 20 provide the reader with a visual presentation
of the most important economic series for the Community and the
Member States. Starting on page 2 3 there are 5 6 pages of 'Community
tables'. This section contains data harmonized by Eurostat on the basis
of common criteria. The most recent data are provisional and in some
cases estimated by Eurostat. Finally there is a section Tables by
country' which contains a selection of economic indicators most often
used in each country. These are national series based on national
definitions. For comparison a table for the United States is also
included.
For all series, historical data are available on request from Eurostat's
data bank Cronos. Statistical bulletins on unemployment, prices,
industrial production, balance of payments, external trade and energy
are also published monthly or quarterly. Eurostatistics itself contains an
absolute minimum of methodological notes. Detailed information on
definitions and methodology may be obtained from Eurostat.
Contents
'In brief ... .
Graphics ... .
COMMUNITY TABLES ... .
1. National accounts ESA ... .
Volume ... .
Price ... .
2. Employment ... .
Population ... .
Employment ... .
3. Unemployment ... .
4. Index of industrial production ... .
Industry, construction ... .
Production by category ... .
Production by branch ... .
Branches in difficulty ... .
5. Opinions in industry
1 . . . .6. Output ... .
Industrial products ... .
Agricultural products ... .
7. External trade ... .
Main indicators ... .
Extra-Community trade ... .
Intra-Community trade ... .
Trade by country ... .
8. Prices ... .
Consumer prices ... .
Producer prices ... .
Wages and salaries in industry ... .
9. Financial statistics ... .
Exchange rates . . .
Main financial statistics ... .
10. Balance of payments ... .
Main balances ... .
TABLES BY COUNTRY ... .
Belgique/Belgie ... .
Dan mark ... .
BR Deutsch land ... .
EMMA
France ... .
Page
9
15
21
23
23
24
25
25
26
28
31
31
32
33
35
37
41
41
45
46
46
49
55
61
65
65
68
69
70
70
72
74
74
79
85
86
87
88
89
Ireland . . .
90
Italia. . .
91
Luxembourg . . .
92
Nederland . . .
93
United Kingdom . . .
94
United States . . .
9 5
(1) The data included in this section of the bulletin are results from a short-term-trends enquiry conducted among heads of interprises in the Community. More detailed data appear in European Economy.
8
Symbols and abbreviations
0
1-4
6+8
•t.
01.,
T4/TO
0/,,
T12/TO
'/o,
BALANCE
*
1975= 100
EUR 9= 100
EUR 10= 100
MIO
MRD
T
TOE
GWH
M3
OM
FF
LIT
HFL
BFR
LFR
UKL
·1RL
OKR
USO
ECU
SOR
EC
Eurostat
EUR
9EUR 10
UEBl/BlEU
ACP
ESA
NACE
SITC
Nil
Data less than half the unit used
No data available
from 1 to 4
6 and 8
Per cent
Percentage increase on the corresponding
quarter ofthe previous year
Percentage increase on the corresponding
month of the previous year
Balance between positive replies (increase,
improvement in the situation) and negative
replies (reduction. worsening of the situation) in
the short-term-trends enquiry conducted among
heads of enterprises in the Community
Seasonally adjusted (Tables by country)
Reference year
Data for countries expressed as a percentage of
the Community of 9 total
Data for countries expressed as a percentage of
the Community of 1 0 total
Million
Thousand million
Tonne
Tonne of oil equivalent
Gigawatt hour (
=
1
Q6kWh)
Cubic metre
Deutschmark
French franc
Italian lira
Dutch guilder
Belgian franc
Luxembourg franc
Pound sterling
Irish pound
Danish crown
US dollar
European currency unit
Special Drawing Right
European Communities
Statistical Office of the European Communities
Total of the member countries of the EC until
1980
Total of the member countries of the EC from
1981
Beige-Luxembourg Economic Union
African, Caribbean and Pacific countries of the
Lome Convention
European System of Integrated Economic
Accounts
Eurostatistics: In brief
1 . Unemployment: No significant change for six months
Two figures are enough to illustrate unemployment in the
Community between
1980 and March 1983:
6 million unemployed at the beginning of 1980
12 million unemployed in M~rch 1983.
Since March there has been a certain degree of stabilization,
with the seasonally adjusted figures remaining at around
1 2 million unemployed, comprising 7 million men and 5 million
women.
Over the last six months the fluctuations have mainly been due
to seasonal trends.
In the
United States the number of unemployed is plummeting
spectacularly, moving from
10.4 million in January 1983 to
9. 3 million in September, a drop of nearly 1 million in
9
months.
In
Japan the number of unemployed is still extremely low, at
approximately 1.5 million.
For both September and October
1983 the proportion of
unemployed aged under
25 in the Community is estimated at
41 Ofo.
Here, too, the rate for women has, as a rule, proved
higher than for men. Approximately a third of unemployed men,
but almost half of unemployed women, are less than
2 5
years
old. The proportion of young unemployed is highest in
Luxem-bourg
(540/o), Italy (500/o), France (450/o), the netherlands
(410/o) and the United Kingdom (410/o).
2.
The
consumer
price
index
from
January
to
October 1983: For the majority of the countries figures are
better than in 1982
Since the start of the year (i.e. from January to October
1 983)
the consumer price index for EUR
1 0 has increased by 7 .1 0/o
as against
8.10/o in the same period in 1982. The inflation rate
has thus slowed considerably. Amongst the countries most
successful in combating inflation were the Federal Republic of
Germany
(-48.80/o compared with the same period in 1982),
Denmark (-420/o), the Netherlands (-41.30/o), and very
satis-factory figures were recorded in Luxembourg
(-22.20/o), Italy
(-20.30/o), Belgium (-200/o) and the United Kingdom
( - 7. 80/o). By contrast. inflation increased by 10. 70/o in Greece
and by
9.10/o in France. The increases in the consumer price
index for the
period
between
1 January 1 983 and
31 October 1983 were as follows for the various countries (the
figures in brackets are for the same period in
1 982):
D
2.10/o (4.10/o)
I
11 .00/o ( 13.80/o)
NL
2.70/o (4.60/o)
GR
16.60/o (150/o)
UK
4. 70/o (5.10/o)
EUR 10 7 .10/o (8.10/o)
DK
5.10/o (8.80/o)
USA
3.60/o (4. 50/o)
B
6.40/o (8.00/o
Japan
2.60/o (3.10/o)
L
7 .00/o (9.0%)
ESP
9.30/o (11.10/o)
F
8.40/o (7.7%)
P
25.70/o (14.90/o)
3. Index of industrial production in september 1983: A
considerable increase
The index of industrial production for the Community (EUR 10)
was
11 5.4 for September, representing an increase of 1.10/o
over September 1982.
After seasonal adjustment, the EUR
1 0
index for September
stood at
113.3, a level not significantly lower than the current
value of
113.8 for August.
The trend indicator (the ratio of the last three months to the
preceding three months) shows a significant increase of
1 .40/o
as in the previous month. This is the highest rate of increase
since
1979. For all the Community countries the most recent
trend indicators show an upward tendency.
4.
Steel
In October
1 983 Community production of crude steel
(exclud-ing Greece) rose for the third consecutive month (by
4.1 0/o after
seasonal adjustment). At
10.2 million tonnes it is 20. 70/o
above the figure for October
1 982 but the sum of the first ten
months of the year shows a fall of
5.80/o compared with the
same period in the previous year.
In August
1983 new orders (ordinary steels) amounting to
5.4 million tonnes represented a fall of 3.40/o after seasonal
adjustment. This figure is
21 . 50/o higher that for August 1 9 8 2
but 9.20/o lower than for August 1981.
5.
Energy: Energy consumption for production of electricity
in 1982
Production of electrical energy in the Community in
19~2
showed the same characteristics as in
1981:
-
virtual stagnation of total production
(0.20/o down on the
previous year)
-
accelerating diversification of sources.
The latter aspect is well illustrated by the following figures:
a large increase (
+
1 2.90/o) in the use of nuclear energy
-
a slight increase in the use of hard coal (
+
1.30/o)
-
a marked decline in the use of petroleum products and
natural gas ( -
10.40/o and - 2. 70/o respectively).
In terms of total distribution by energy sources, hard coal is in
first place
(36. 70/o followed by nuclear energy (22. 70/o) and
petroleum products
(16.8%).
6. Extra-Community Trade
10
Community imports from third countries appear to have stopped
declining. After zero year on year growth in the second quarter,
imports were 30/o up in the third quarter. On the one hand,
Germany, the Netherlands, Ireland and Denmark are showing
clear signs of a recovery in import growth. On the other hand,
imports from third countries by France. Italy and Greece are still
on a downwards path.
The gap between Community imports and Community exports
continues to narrow, with France. Italy and (in the period for
which data is available) Belgium-Luxembourg making
particu-larly rapid progress in reducing their trade deficits.
7. Intra-Community Trade
Avertissemr:,nt
Eurostatistiques -
donnees pour !'analyse de la conjoncture
est /'une
des trois publications cles d'Eurostat, destinees
a
donner au lecteur un
aper9u des informations quantitatives les plus importantes disponibles /
concemant la Communaute et les £tats membres. Les autres
publications de cette serie sont les Statistiques de base fournissant des
donnees pour une annee specifique determinee et la Revue de
l'Eurostat
qui passe en revue dix ans de la Communaute sous forme de
tableaux chiffres.
Une publication mensuelle contenant des donnees economiques
conjoncturelles d'actualite doit etre continuellement adaptee et mise
a
jour. Au debut de 1982, une modification importante est intervenue
avec /'inclusion de donnees concemant la Grece et un changement de
presentation. Des totaux pour la Communaute de dix membres seront
progressivement introduits en 1982. Lorsque /'on disposera de
donnees en nombre suffisant, /'annee 1 9
7
5 - annee de reference
pour cette publication - sera remplacee par 1980. I{ est prevu
ulterieurement d'ajouter les donnees concernant les deux pays
candidats
a
/'adhesion -
a
savoir /'Espagne et le Portugal - ainsi que
pour les Etats-Unis et le Japon.
Eurostatistiques
publie quatre types d'informations. Les pages 1 3 et 14
contiennent un article , En bref
»
dans lequel les dernieres tendances
pouvant etre degagees
a
partir des donnees disponibles sont
examinees. Les pages 15
a
20 fournissent au lecteur une presentation
visuelle des series economiques les plus importantes pour la
Communaute et les £tats membres. Des , tableaux communautaires
»
sont presentes sur 56 pages
a
partir de la page 23. Cette section
contient des donnees harmonisees par Eurostat sur la base de criteres
communs. Les donnees les plus recentes sont provisoires et, dans
certains cas, estimees par Eurostat. Entin, la section , tableaux par
pays
»
contient une selection des indicateurs economiques les plus
souvent utilises dans chaque pays. Ce sont des series nationales
fondees sur des definitions nationales. A des fins de comparaison, un
tableau concernant les Etats-Unis est egalement inclus.
Pour toutes les series, des donnees historiques sont disponibles sur
demande aupres de la banque de donnees d'Eurostat, CRONOS. Les
buf letins statistiques sur le chomage, les prix, la production industriel/e,
la balance des paiements, le commerce exterieur et /'energie sont
egalement publies sur une base mensuelle ou trimestrielle. En soi,
Eurostatistiques
contient un minimum de notes methodologiques. Une
information detail/ee concernant les definitions et la methodologie
peut-etre obtenue aupres d'Eurostat.
Table des matieres
«
En bref
» ... .
Graphiques ... .
TABLEAUX COMMUNAUTAIRES ... .
1 . Comptes nationaux SEC ... .
Evolution en volume ... .
Evolution des prix ... .
2. Emploi ... .
Population . . .
Emploi ... .
3.
Chomage ... .
4. Indices de la production industrielle ... .
lndustrie, construction ... .
Production par categorie ... .
Production par branche ... .
Production des branches sensibles ... .
6.
Opinions dans l'industrie (
1) ... .
6.
Production ... .
Produits industrials ... .
Produits agricoles ... .
7.
Commerce exterieur ... .
Principaux indicateurs ... .
Commerce extracommunautaire ... .
Commerce intracommunautaire ... .
Commerce par pays ... .
8.
Prix ... .
Prix a
la consommation ... .
Prix
a
la production ... .
Salaires dans l'industrie ... .
9. Statistiques financieres ... .
Taux de change ... .
Principales statistiques financieres ... .
1 0. Balance des paiements ... .
Principaux soldes ... .
TABLEAUX PAR PAYS ... .
Belgique/Belgiij ... .
Dan mark ... .
BR Deutschland ... .
EMMA
... .
France ... .
Ireland ... .
Italia ... .
Luxembourg ... .
Nederland ... .
Page
13
15
21
23
23
24
25
25
26
28
31
31
32
33
35
37
41
41
45
46
46
49
55
61
65
65
68
69
70
70
72
74
74
79
85
86
87
88
89
90
91
92
93
United Kingdom . . .
94
United States. . . .
95
(1) Les donnees contenues dans cette partie du Bulletin representent les resultats de l'enqu~te de conjoncture aupres des chefs d'entreprise de la Communaute. Des donnees plus detaillees paraissent dans
«
Economie europeenne».
12
Signes et abreviations
0
1-4
&+8
'lo
1
/o,
T4/TO
'lo,
T12/TO
'Ii.
SOLDE
*
1975= 100
EUR 9= 100
EUR 10.= 100
MIO
MRD
T
TEP
GWH
M3
OM
FF
LIT
HFL
BFR
LFR
UKL
IRL
DKR
USO
ECU
ors
CE
EurostatEUR9
EUR 10
UEBL/BLEU
ACP
SEC
NACE
CTCI
Neant
Donnee inferieure
a
la moitie de l'unite utilisee
Donnee non disponible
De 1
a
4
6et 8
Pourcentage
Accroissement en pourcentage d'un trimestre
sur le trimestre correspondant de l'annee
precedente
Accroissement en pourcentage d'un mois sur le
mois correspondant de l'annee precedente
Saide entre les reponses positives
(accroissement. amelioration de la situation) et
les reponses negatives (diminution,
deterioration de la situation)
a
l'enquete de
conjoncture aupres des chefs d'entreprise de la
Communaute
Desaisonnalise (tableaux par pays)
Annee de base
Donnees des pays exprimees en pourcentage
total de la Communaute
a
neuf (
=
1 00)
Donnees des pays exprimees en pourcentage
du total de la Communaute
a
dix
Million
Milliard
Tonne metrique
Tonne equivalent petrole
Gigawattheure
=
1
os
kWh
Metre cube
Deutsche Mark
Franc franc;:ais
Lire italienne
Florin neerlandais
Franc beige
Franc luxembourgeois
Livre sterling .
Livre irlandaise
Couronne danoise
Dollar US
Unite monetaire europeenne
Droits de tirages speciaux
Communautes europeennes
Office statistique des Communautes
europeennes
Ensemble des pays membres des
Communautes europeennes jusqu'a 1 980
Ensemble des pays membres des
Communautes europeennes a partir de 1981
Union economique belgo-luxembourgeoise
Pays d'Afrique, des Cara'fbes et du Pacifique
-Convention de Lame
Systeme europeen de comptes economiques
inteares
Nomenclature generale des activites
economiques dans les Communautes
europeennes
[image:14.590.43.559.224.775.2]I
Eurostatistiques En bref
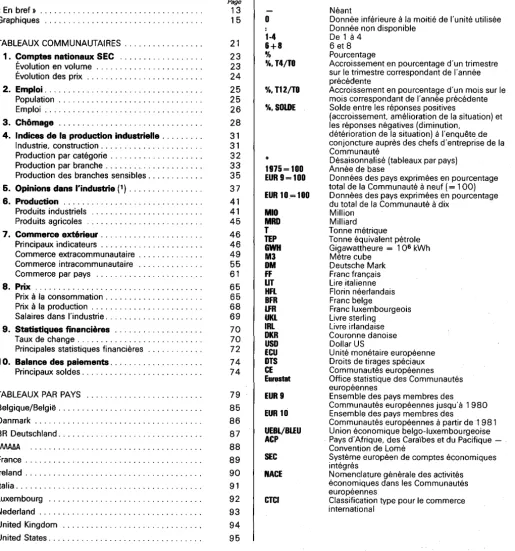
1 . Chomage : Pas de variation significative depuis six mois
Deux chiffres suffiraient
a
decrire la situation du chomage dans
la
Communaute depuis 1980 et jusqu'au mois de mars 1983.
6 millions de chomeurs en debut 1 980
1 2 millions de chomeurs en mars 1983.
Depuis mars, on observe une certaine stabilisation. le chiffre
corrige des variations saisonnieres restant aux alentours de
1 2 Mio de chomeurs dent 7 Mio d'hommes et 5 Mio de
femmes.
Depuis 6 mois, les fluctuations observees sent dues
principale-ment aux mouveprincipale-ments saisonniers.
Aux
USA,
le nombre des chomeurs est en train de baisser
d'une facon spectaculaire. En neuf mois. (janvier-septembre
1 983) on compte environ un million de chomeurs en mains :
10.4 Mio en janvier 1983 et 9.3 Mio en septembre.
Au
Japan le nombre des chomeurs reste toujours
a un niveau
tres bas. aux environs de 1 . 5 Mio.
Pour septembre comme pour octobre 1983. la part des
chO-meurs de moins de 25 ans dans la Communaute est estimee
a
41 0/o. Chez les jeunes chomeurs aussi, ii se confirme que le
chOmage des femmes est generalement plus important que
celui des hommes. Environ un tiers des chomeurs, mais pres de
la moitie des chomeuses. etaient ages de mains de 25 ans.
C'est au Luxembourg (540/o), en ltalie (500/o). en France
(450/o), aux Pays-Bas (410/o) et au Royaume-Uni (410/o) que la
proportion de jeunes chOmeurs est la plus forte.
2. L'indice des prix I\ la consommation janvier-octobre
1983 : La plupart des pays font mieux qu'en 1982
Depuis le debut de l'annee (janvier-octobre 1983) l'indice des
prix
a
la consommation pour EUR-10 a augmente de 7, 10/o
alors que !'augmentation pour la meme periode de 1982 etait
de 8, 1 0/o. Le ralentissement done du rythme d'inflation est
assez significatif. Parmi les pays qui ont mieux reussi dans la
lutte centre !'inflation on peut citer l'Allemagne (-48,80/o par
rapport
a
la meme periode de 1982), le Danemark (-42,00/o).
les Pays-Bas (-41.30/o). De tres bonnes performances ont ete
aussi
realisees
par le
Luxembourg
(- 22. 20/o),
l'ltalie
(-20.30/o). la Belgique (-20,00/o) et Royaume-Uni (- 7 ,80/o).
Par centre !'inflation a augmente de 10, 70/o en Grace et de
9, 10/o en France.
L'augmentation de l'indice des prix
a
la consommation pour la
periode allant du 1
•r
janvier 1 983 au 31 octobre 1 983 etait la
suivante selon les pays.
(Entre parenthese !'augmentation correspondante pour la meme
periode de 1982).
D
2, 10/o (4, 10/o)
NL
2, 7% (4,60/o)
UK
4. 70/o (5, 10/o)
DK
5, 10/o (8.8%)
B6,40/o (8,00/o)
L
7 .00/o (9.0%)
F
8,40/o
(7,
70/o)
I
GR
EUR 10
USA
Japan
ESP
p
11.00/o (13,80/o)
16,60/o (150/o)
7, 1 0/o (8, 1 0/o)
3,60/o (4,50/o)
2.
60/o (3. 10/o)
9.30/o (11,10/o)
25,70/o (14,90/o)
3. L'indice de la production industrielle en septembre
1983 : Hausse significative
L 'indice de la production industrielle pour la Communaute
(EUR 10) du mois de septembre s'etablit
a
11 5.4. Cela
corres-pond
a
une hausse de 1, 10/o par rapport
a
septembre 1 982.
L'indice corrige des variations saisonnieres pour EUR 10 est au
niveau 113.3 pour le mois de septembre soit un niveau qui
n'est pas significativement inferieur
a
celui actuellement observe
pour le mois d'aout 113,8.
L 'indicateur de tendance (rapport des trois derniers mois aux
trois mois precedents) indique -
comme le mois dernier
-une hausse significative de 1 ,40/o, ce qui correspond
a
un
rythme de hausse que l'on n'avait pas pu observer depuis
1979. Pour tous les pays de la Communaute les derniers
indicateurs de tendance sent orientes
a
la hausse.
4. Acier
En octobre 1983. pour le troisieme mois consecutif. la
produc-tion communautaire d'acier brut (sans la Grece) a connu une
hausse {4.10/o desaisonnalisee). Avec 10.2 mio.t elle est
supe-rieure de 20. 70/o
a
la production d'octobre 1 982 mais les
10 premiers mois de l'annee se soldent par une diminution de
5,80/o par rapport
a
la meme periode de l'annee precedente.
En aout 1983. avec 5.4 mio.t les commandes nouvelles
{aciers courants) ont enregistre une baisse desaisonnalisee de
3,40/o. Ce chiffre est superieur de 21.50/o
a
celui d'aout 1982
mais inferieur de 9. 20/o
a
celui d' aout 1 9 81 .
5. Energia : Consommation d'energie pour la production
d'energie electrique en 1982
En ce qui concerne la production d'energie electrique dans la
Communaute, l'annee 1 982 presente les memes
caracteristi-ques que 1 981.
a
savoir :
une stagnation, ou presque, de la production totale (-0,2%
par rapport
a
l'annee precedente)
une progression dynamique de la diversification des
sour-ces.
Ce dernier aspect est mis en evidence par les chiffres suivants :
un fort accroissement de l'energie nucleaire (
+
12.9%)
-
un accroissement modeste de la houille (
+
1.3%)
-
une nette diminution des produits petroliers et du gaz
natural (respectivement - 10,40/o et - 2, 70/o).
Apres repartition totale par source d'energie. on retrouve ainsi
au premier rang la houille (36, 70/o) suivie par l'energie nucleaire
{22,70/o) et par les produits petroliers (16,80/o).
6. Commerce avec les pays tiers
Apres une periode de recession. les exportations
communautai-res vers les pays tiers, ont repris en valeur au cours du
deuxieme trimestre. Cette reprise s'est poursuivie au trimestre
suivant. au les exportations depassaient de 70/o le niveau atteint
14
au troisieme trimestre de 1982. (Ce chiffre ne prend pas en
compte la Belgique et le Luxembourg, pour lesquels les
don-nees ne sont pas encore disponibles.) En aout et en septembre.
les exportations etaient superieures de 9 et de 11
%
respective-ment aux niveaux enregistres les m!mes mois de l'annee
precedente. En septembre. la France. l'ltalie. l'lrlande et le
Danemark ant enregistre des resultats particulierement positifs
puisque, dans tous ces pays. la progression a depasse les
20%.
La diminution des importations en provenance de pays tiers ne
s'est pas poursuivie. Si. au deuxieme trimestre. aucune
progres-sion n'a ate enregistree par rapport
a
la periode correspondante
de l'annee precedente. les importations ant augmente de 3%
au cours du troisieme trimestre. Si la reprise des importations
se confirme tres nettement en Allemagne. aux Pays-Bas, en
lrlande et au Danemark. les importations en provenance de
pays tiers regressent toujours en France. en ltalie et en Grace.
L'ecart entre les importations et les exportations de la
Commu-naute continue
a
se resserrer. La France, l'ltalie et (au cours de
la periode couverte par les donnees disponibles) la Belgique et
le Luxembourg sont en train de combler tres rapidement leur
deficit commercial.
7. Commerce intracommunautaire
14
13
12
11
10
9
8
1
6
5
4
3
2
130
125
120
-;'
115
110
105
100
REGISTRa ARBEITSLOSIGKEIT
REGISTERED UNEMPLOYMENT
CHOMAGE ENREGISTRE
EUR 10
MIOINSGESAMT
TOTAL
TOTAL
INSGESAMT,SAISONBEREINIGT
TOTAL,SEASONALLY ADJUSTED
TOTAL,DESAISONNALISE
----
---·
MAENNER,SAISONBEREINIGT
MEN,SEASONALLY ADJUSTED
HOMMES,DESAISONNALISE
...
FRAUEN,SA.ISONBEREINIGT
WOMEN,SEASONALLY ADJUSTED
FEMMES,DESAISONNALISE
_...---·-_
...
---
--·-
---
...
-
...
--
...
-·
...
--
-
...
...
...
...
---
...
...
...
.
...
_
...
1_9r:,9
1.980
1.981.
1.982
1.983
INDUSTRIELLE PRODUKTION
TENDENZ EUR 10
INDUSTRIAL PRODUCTION
TREND EUR 10
1915=100
PRODUCTION INDUSTRIELLE
TENDANCE EUR 10
-~
;
...
-•••
1.9~9
INDUSTRIE NACE 1-4
INDUSTRY NACE 1
-
4
GRUNDST. U. PRODUKTIONSGUETER INTERMEDIATE GOODS
INVESTITIONSGUETER
INVESTMENT GOODS
VERBRAUCHSGUETER
CONSUMPTION GOODS
1.980
1.981.
EINFACH-LOQARITHMISCHE SKALA SEMI-LOQARITHMIC SCALE
INDUSTRIE NACE 1-4
BIENS INTERMEDIAIRES
BIENS D'INVESTISSEMENT
BIENS DE CONSOMMATION
1.982
1.983
ECHELLE SEMI-LOQARITHMIQUE
14
13
12
11
10
9
8
1
6
5
4
3
2
130
125
120
115
110
105
MEINUNGSUMFRAGE
.
OPINIONS
OPINIONS
IN DER INDUSTRIE (NACE 2-4l IN INDUSTRY (NACE 2-4l DANS L'INDUSTRIE <NACE 2-4l
,c SALDO ,c BALANCE ,c SOLDE
EUR 10
PRODUKTIONSAUSSICHTEN PRODUCTION EXPECTATIONS PERSPECTIVES DE PRODUCTION AUFTRAGSBESTAND ORDER BOOKS CARNETS DE COMMANDES
---·-
LAGERBESTAENDE AN STOCKS OF FINISHED PRODUCTS STOCKS DE PRODUITS FINIS FERTIGERZEUGNISSEN56 50
40 40
30 30
20
...
~...
--·,
•
...
2010
...
100 0
-10 -10
-20 -20
-30 -30
-40 -40
-50 -50
-60 -60
-10 -10
1-9~9
1-980
1-981-
1-982
1-983
AUSSENHANOEL
EXTERNAL TRADE
COMMERCE EITERIEUR
SAISONBEREINIGT SEASONALLY ADJUSTED DESAISONNALISE EUR 10 MAD ECU
EINFUHR EXTRA-EG IMPORTS EXTRA-EC IMPORTS EXTRA-CE AUSFUHR EXTRA-EG EXPORTS EXTRA-EC EXPORTS EXTRA-CE
30 30
28 28
26 26
24 24
22 22
20 20
18 18
16 16
14 14
12 12
1-9~9
1-980
1-981-
1-982
1-983
VERBRAUCHERPREISE
CONSUMER PRICES
PRIX A LA CONSOMMATION
VERAENOERUNG VARIATION VARIATION
"T12tTO
EUR 10
15 15
'14 14
13 13
12 12
11 11
10 10
9 9
8 8
1 1
1.90-:,9
1.980
1.981.
1.982
1.983
WECHSELKURSE
EXCHANGE RATES
TAUX DE CHANGE
1 ECU = ••• SZR 1 ECU =•••SOR 1 ECU = ••• OTS
1 ECU =•••USO 1 ECU =•••USO 1 ECU =•••USO
1.5 1.5
1.4 1.4
1.3 1.3
1.2 1.2
1.1 1.1
1 1
o.s
0.9o.a
0.818
3500
3000
2500
2000
1150
1500
1250
1000
150
600
500
400
300
250
200
115
150
125
100
15
50
40
30
25
...
REGISTRa ARBEITSLOSIGKEIT
SAISONBEREINIGT
D
+++++++++++++++
NL
• +"
+.,.++++++++++++
.... ++ ++
+++ +++ +++ . . .
B
...
.
..
.
.·
.
..
.
" + ..
....
X JfJC ... JI:
+ + •,,"
1.980
EINFACH-LOQAAITHMISCHE SKALA
REGISTERED UNEMPLOTMENT
CHOMAGE ENREGISTRE
F
SEASONALLY ADJUSTED
1 OOO
, ... I
DESAISONNALISE
++ ++ ++ ++ ++
UK
++ ++ ++ ++..
IRL
• + • + • • + •DK
••••••••
GR
+ + + X
".
+ +
1.981.
SEMI-LOQAAITHMIC SCALE
.... + +++ +++ +++ +++ +
""'""+ +++ +++
• +.
1.982
+++ +++ +++ ... ... +++ ++
...
..
" ~ + + +.
1.983
ECHELLE SEMI-LOQAAITHMIQUE
3500
3000
2500
2000
1150
1500
1250
1000
150
600
500
400
300
250
200
115
150
125
100
15
50
40
30
150
140
130
120
110
100
90
85
150
140
130
120
110
100
90
85
INDUSTRIELLE PRODUKTION
TENDENZ NACE 1·4
D
1.9--=J9
1.980
EINFACH·LOGARITHMISCHE SKALA
INDUSTRIELLE PRODUKTION
TENDENZ NACE 1-4
f I I I I I I I I I I I 1 1 I
NL
+++ +++ +++ +++B
JrJr++++.,..,.~
.,. .,.
INDUSTRIAL PRODUCTION
TREND NACE 1·4
1915=100
F
...
+++++++++++++++
I
EUR 10
,;,++++++
,..
1.981.
SEMI-LOGARITHMIC SCALE
INDUSTRIAL PRODUCTION
TREND NACE 1-4
1915=100
PRODUCTION INOUSTRIELLE
TENDANCE NACE 1·4
++ ++ ++ ++ ++UK
1.982
1.983
ECHELLE SEMI·LOGARITHMIQUE
PRODUCTION INDUSTRIELLE
TENDANCE NACE 1-4
+++ +++ +++ +++
L
++++++++++IRL •••••••• DK
••••••••
GR
EUR 10
,t."" .. """" +
·-""~"'t
~
... ._... ... Jr./1.9--=J9
1.980
1.981.
EINFACH·LOGARITHMISCHE SKALA SEMI-LOGARITHMIC SCALE
1.982
\
\
...
...
1.983
ECHELLE SEMI· LOGARITHM.IQUE
150
140
130
120
110
100
90
85
150
140
130
120
110
100
90
20
40,0
350
300
215
250
225
200
180
160
140
120
100
400
350
300
215
250
225
200
180
160
140
120
100
VERBRAUCHERPREISE
GESAMTINDEX
D
1.9--=i9
1.980
EINFACH-LOQARITHMISCHE SKALA
VERBRAUCHERPREISE
GESAMTINDEX
CONSUMER PRICES
GENERAL INDEX
1915=100
F
""'"""'"' I
EUR 10
PRIX A LA CONSOMMATION
INDICE GENERAL
++ ++ ++ ++ ++
UK
_...
....
...,..._....
...
...
" ' " ' ~
...~
....
1.981.
SEMI-LOQARITHMIC SCALE
CONSUMER PRICES
GENERAL INDEX
1915=100
++ ....
"""'+++++++++"++
.... +t ++ ++ ++ ++ ++ ++ ++ ++
....
1.982
1.983
ECHELLE SEMI-LOQARITHMIQUE
PRIX A LA
CONSOMMATION
!NOICE GENERAL
NL
+++ +++ - +++B
+++ +++ +++ +++L
++ ++ ++ ++ ++IRL
• + + + • • + +DK
... +••++••GR++ ++ X
X ++ ++,,_Jt
,I' ++ ++
,c+ ++ ~
1.9--=J9
.
+ +.
++ ++ l'
" + + +)f ll:
• +"
~ ++ ++ :ir+ ++ +IC
++ ++ ~
,.
1.980
EINFACH-LOQARITHMISCHE SKALA
EUR 10
... .lr + + + X
.. +
" + +
,l
x" ++ ++ ,c:+ ++ iJil:
,c,+ ++ .,,.
. ++ ++ )t
,l
1.981.
SEMI-LOQARITHMIC SCALE
+ +.
++ ++.,,.
....
"'"'++++~++++
.,r ++ ++
1.982
'< X
,/" ++ ++ ~ ++ ++
.It ++ ++
1.983
EC.HELLE SEMI- LOQARITHMIQUE
400
350
300
215
250
225
200
180
160
140
120
100
400
350
300
215
250
225
200
180
160
140
120
GEM El NSCHAFTSTABELLEN
VOLKSW.GESAMTRECHN. ESVG
NATIONAL ACCOUNTS ESA
COMPTES NATIONAUX SEC
EUR10
I
BELGKlUE BELGI~I
DANMARKI
DEUTSCHlAND BRI
EMMAI
FRANCEI
IRELANDI
ITALIAI
WXEMBOURGI
NEDERLANDI
KINGDOM UNnED001 - BRUTIOINLANDSPRODUKT
GROSS DOMESTIC PRODUCT
PRODUIT INTERIEUR BRUT
VERAENDERUNG DES VOLUMENS
CHANGE IN WLUME
EVOLUTION EN VOLUME
EUR 10 ... 100
1975
I
100.0 3,9 2,1 25.5 1.9 21.8 0,7 17,8 0,2 5.4 20.61975 - 100
19791
114.9 112.3 113,7 116,6 121.7 115.3 119.3 116,2 111,6 112,7 109.91980 116,2 115, 1 113.5 119.0 123.7 116,2 121,5 120,8 112.4 113.3 107,6
1981 115,8 113.9 113.5 118.9 123.2 116.4 123,6 120,6 108,7 112,1 105.1
1982 116.2 112.8 116.4 117,9 123,2 118,9 124,5 120.3 109,5 111.1 106.3
%, T4/TO
1980 I +5.2 +5,7 +5,7 + 1.6 +3.6 +10.4 +2.3
II +0.9 +1,5 +0.8 -0.1 +2.0 +5.0 -3.5
Ill +1.2 +0.8 +1.4 +2.0 +0,1 +6.3 -1,6
IV -1.8 -1.9 -0,3 +3.8 -0,6 -4.8 -2,7
1981 I -1,6 -3.3 -1.4 -1.7 -1.9 -0.6 -2.4
II -0,6 -1.4 +0.1 +o.o -0.1 -0.4 -2.3
Ill -0.2 -1.7 +0.7 +1.8 +0.5 +0.7 -2.9
IV +0.7 -3.0 +0.7 -1.2 +1,8 +0,9 -0.8
1982 I +0.8 -1.8 -0.3 +2.3 +2.7 + 1.5 -0.4
II +0.9 -1.1 -0.2 +2.5 +0.5 +0.9
Ill +0.1 -1.3 -2.0 +1.3 -1.0 +2.5
IV -0.1 -0.7 -2.1 +1.4 -2.4 +2.7
1983 I -0.8 +1,3 -3.4
II +0.4 -3,6
002 - PRIVATER VERBRAUCH
CONSUMPTION BY HOUSEHOLDS
CONSOMMATION PRIVEE
VERAENDERUNG DES VOLUMENS
CHANGE IN WLUME
EVOLUTION EN VOLUME
EUR 10 =- 100
1975
I
100.0 3,8 1.9 25.2 2.1 21,7 0,8 18.8 0.2 4.9 20.61976 - 100
"" I
111.2 110,5 109.2 111.1 118,7 114.4 117,0 109,0 108,6 113,8 106.21979 115,0 115,3 111,5 114.4 122,2 117,7 119,7 114.8 112,5 116.4 110,3
1980 116,5 117.3 107.4 116.4 121.8 119.1 118.5 119.7 116.1 115.6 109.4
1981 116,7 115.2 105,6 115.2 122.2 121.8 118.3 119.5 116,9 112.6 109.4
%, T4/TO
1980 I +3.8 +2.5 +3.7 +2.4 +5.4 +1,8 +4.1
II +0.1 +4.5 -1.0 +1.3 +5.6 -0,8 -3,6
Ill +2.2 +3.0 +2.4 + 1.8 +4.7 -1.7 +0,6
IV +1.0 +0,5 + 1.2 +1.4 +2.0 -2.4 -0,6
1981 I -1.1 -1,6 -0,3 -2,6 -0.5
II -0.3 -0.5 +2.8 -2,6 +1,2
Ill -0.7 -1.2 +2.3 -2,6 +0.5
IV -1,6 -1.6 +2.7 -2,5 +0.6
1982 I -0.4 -1.4 +4.2 -1.8 -0.7
II -2.3 -2,0 +2.7 +0.3
Ill -1.9 -3.0 +2,5 +1.8
IV +0.2 -2.5 +2.3 +3.0
1983 I -0.3 +1.3
II +0.7
003 - BRUTIOANLAGENINVESTITIONEN
GROSS FIXED CAPITAL FORMATION
FORMATION BRUTE DE CAPITAL FIXE
VERAENDERUNG DES VOLUMENS
CHANGE IN VOLUME
EVOLUTION EN VOLUME
EUR 10 - 100
1975
I
100,0 4.2 2.2 25.1 1.9 24,0 0,8 17.3 0,2 5.3 19,11976 - 100
19791
111.4 102.7 114.1 123,7 131,6 105,3 157,8 107,8 105.8 109,9 102,81980 113.7 108.5 98.5 126,0 120,7 106,0 144.4 118,0 105.9 107,1 101.6
1981 110,3 105,0 83.5 121.2 116.4 104,0 153.1 117.7 105.1 99.6 94.4
1982 113,7
%, T4/TO
1980 I +8.7 +9.4 +14.1 -7.0 +6.6 +6.4 +27.1 +4.6
II +2.8 +14.4 +1.3 -4.9 +3,7 +7,3 -7.4 -0.7
Ill +2.8 -8.8 +2.2 -11.1 +0.2 +15.7 -7.3 -4,8
IV -0.6 -6.7 -1.8 -11.7 -0.1 +8.8 -12.9 -8,5
1981 I -4.0 -18.0 -6.6 -23.0 -1.3 +4.1 -13.9 -12.3
II -2,7 -12,9 -1,1 -10,1 -1.1 -1,0 -12,5 -10,2
Ill -1,6 -18.0 -1,7 +4.2 -0.1 +0.3 -5.9 -6,3
IV -3.6 -17,5 -6,2 -11.4 -1.8 -0.7 -4,7
1982 I -2,8 -13,0 -7,8 +20.8 -0,7 -4.4 +4.3
II -2.4 -9,1 -7,6 +2,0 -3,0 +0.4
Ill -2.8 -7,1 +0,7 -7.4 +3.8
IV -0,5 +0.2 -0.8 +0.8 -6.3 +3.5
1983 I +0.2 +0.5 -8.1