The Propulsion Committee
Final Report and Recommendations to the 25th ITTC
1. INTRODUCTION
1.1 Membership and Meetings
The members of the Propulsion Committee of the 25th International Towing Tank Confer-ence are as follows:
• Dr. Ki-Han Kim (Chairman), Office of Naval Research (ONR), U.S.A.
• Dr. Stephen Turnock (Secretary), Uni-versity of Southampton, U.K.
• Professor Jun Ando, Kyushu University, Japan
• Dr. Paolo Becchi, CETENA, Italy
• Professor Emin Korkut, Technical Uni-versity of Istanbul, Turkey
• Dr. Anton Minchev, FORCE Technol-ogy, Denmark
• Ms. Elena Ya Semionicheva, Krylov Shipbuilding Research Institute, Russia
• Dr. Suak-Ho Van, Maritime and Ocean Engineering Research Institute (MO-ERI), Korea
• Dr. Wei-Xin Zhou, China Ship Scien-tific Research Center (CSSRC), China. Four Committee meetings were held as fol-lows:
• Technical University of Istanbul, Tur-key, 1-3 February 2006
• CETENA, Italy, 25-27 September 2006
• David Taylor Model Basin, USA, 18-20 April 2007
• FORCE Technology, Denmark, 23-25 October 2007.
1.2 Recommendations of the 24th ITTC
The 24th ITTC recommended the following work for the 25th ITTC Propulsion Committee: 1. Update the state-of-the-art for propulsion
systems emphasizing developments since the 2005 ITTC conference.
(a) Comment on the potential impact of new developments on the ITTC, (b) Emphasize new experimental
tech-niques and extrapolation methods and the practical application of computa-tional methods to performance predic-tion and scaling,
(c) Identify the need for R&D for improv-ing methods of model experiments, numerical modelling and full-scale measurements.
2. Review the following ITTC recommended procedures:
• 7.5-01-02-01: Terminology and No-menclature of Propeller Geometry (Harmonize with ISO standard)
• 7.5-02-03-01.1: Propulsion Test
• 7.5-02-03-02.1: Propeller Open Water Test
• 7.5-02-03-02.3: Guide for Use of LDV
• 7.5-02-05-02: High Speed Marine Ve-hicles Propulsion Test.
(b) In the review and update of the existing propeller open water test procedure 7.5-02-03-02.1 its applicability to new types of propulsors should be taken into account.
(c) Identify the requirements for new pro-cedures.
(d) Support the Specialist Committee on Uncertainty Analysis in reviewing the procedures handling uncertainty analy-sis.
3. Critically review examples of validation of prediction techniques. Identify and specify requirements for new benchmark data. 4. Review the development and progress in
unconventional propulsors such as tip-rake, transcavitating and composite propellers (hydroelasticity and cavitation erosion sus-ceptibility taken into account).
5. Review propulsion issues in shallow water and formulate recommendations for re-search.
6. Review the methods for predicting the per-formance of secondary thrusters and com-pare with operational experience.
7. Finalise the benchmark tests for waterjets and analysis of the data.
1.3 General Remarks
The Propulsion Committee addressed all the tasks assigned to it with different degrees of completeness. The initial review of the above recommendations revealed that there is an overlapping aspect in Recommendations 1.(a) and 1.(b) above. The Committee recom-mended to the Advisory Council that the origi-nal 1.(a) be dropped and 1.(b) be modified to read, “Emphasize new propulsion concepts and experimental techniques and extrapolation methods and the practical application of com-putational methods to performance prediction
and scaling.” Both changes were approved by the Advisory Council.
The Propulsion Committee reviewed five procedures recommended by the ITTC. For the Guide for Use of LDV (7.5-02-03-02.3), the Committee decided that the current members do not possess expertise to provide proper guidance for use of LDV, thus limiting the scope of review for this task to reviewing pa-pers on the applications of LDV and PIV. In view of increasing use of LDV and PIV in the cavitation tunnel and in the towing tank, the Committee recommends that a Specialist Committee on LDV/PIV be established to pro-vide proper guidance for experimentalists. The review of the High Speed Marine Vehicles Propulsion Test (7.5-02-05-02) was challeng-ing because of insufficient information in the existing document as well as in the literature. In this case mostly clarifications were made with no significant changes to the actual proce-dure. However, it should be recognised that a number of aspects of this procedure would benefit from more detailed research especially on the effect of shaft inclination on actual ef-fective wake analysis.
There was a limited amount of recent mate-rial available in the public domain for work related to shallow water effects and in the per-formance of secondary thrusters. This has also limited the work of the Committee.
2. UPDATE THE STATE-OF-THE-ART FOR PROPULSION SYSTEMS EMPHASISING DEVELOPMENTS SINCE THE 2005 ITTC
CONFERENCE
2.1 Introduction
Several major international conferences were held since the 24th ITTC conference in 2005; CAV2006 (Sep. 2006, the Netherlands), Propellers/Shafting ’06 (Sep. 2006, U.S.A.), 26th Symposium on Naval Hydrodynamics (Sep. 2006, Italy), T-POD 2006 (Oct. 2006, France), 9th International Conference on Nu-merical Ship Hydrodynamics (Aug. 2007, U.S.A.), FAST 2007 (Sep. 2007, China). Most relevant papers from these conferences and from other technical journals and conferences were reviewed and reported.
Advances in computational analysis of fluid flow, application of new materials to propul-sion devices and developments in instrumenta-tion were reported and have a direct effect on the way on which ITTC members conduct their propulsion related activities. Advances in computational tools and computer hardware enabled researchers to be able to compute the steady ship propulsion characteristics for fully-appended ship hull with propeller operating and highly separated unsteady flow around propellers that have only been feasible through experiments until recently. These advances would contribute to the development of more efficient propellers with less cavitation and ef-ficient hull forms with improved powering per-formance.
Although there were few new propulsion concepts or systems reported since the 24th ITTC Conference in 2005, continued im-provements in the design, analysis and experi-mental methods were reported for tip-rake pro-pellers, surface-piercing propro-pellers, super-cavitating propellers, and composite propellers. The progress in these unconventional propul-sors is reviewed in Section 5.
Some new developments were reported in waterjets, podded propulsors and advanced blade section concepts. These new develop-ments are reported in this Section.
2.2 Overview of New Developments
2.2.1 Axial-Flow Waterjet Significant
ad-vancements in waterjet technology have been reported in two areas; capability of computa-tional tools for design and analysis and com-pact wajerjet technology.
Kerwin (2006) presented a review of the current state-of-the-art experimental and com-putational hydrodynamics as applied to the de-sign and analysis of waterjet propulsion sys-tems. He concluded that a range of computa-tional tools is beneficial - from fast and simple to computationally intensive. Progress in re-search might well benefit from greater interac-tion between the developers of different com-putational approaches.
Kerwin, et al. (2006) presented a unified ap-proach to hydrodynamic design/analysis prob-lem for a wide class of propulsors including ducted, podded and waterjets. The approach consists of a coupled axisymmetric flow/lifting surface representation of the total flow field. Once the approach is verified and validated, it can be used for a fast parametric study of wa-terjets, ducted propellers, and podded propel-lers with multiple blade rows.
signifi-cantly smaller transom footprint than the mixed flow pump. Therefore, for a given transom area, one can install more number of axial-flow waterjets or conversely, for the same total thrust, the use of axial-flow pumps can allow for a significantly reduced transom size and thus a significant reduction in wave drag for a high-speed ship.
Figure 2.1 Comparison of mixed-flow (left) and axial-flow (right) waterjet dimensions (Lavis, et al., 2007).
Lavis, et al. (2007) designed an axial-flow waterjet pump for a notional high-speed sealift ship that would be propelled by four 90-inch diameter axial-flow waterjets, each absorbing 57,330 hp. An extensive model-scale evalua-tion was performed at DTMB facility. A 7.5-inch model pump (1/12th scale) was tested in the cavitation tunnel (see Figure 2.2) and a self-propulsion test was conducted in the towing tank using a demi-hull of a representative large catamaran using two surrogate model pumps.
Figure 2.2 Pump performance testing at 24-inch water tunnel at DTMB using 7.5-24-inch di-ameter axial-flow pump (Lavis, et al., 2007).
Brewton, et al. (2006) presented computa-tions of steady performance (thrust, torque and efficiency) and detailed flow in the axial-flow pump designed by Lavis, et al. (2007) using RANS code with a mixing-plane approach.
Figure 2.3 shows the computer image of the axial-flow waterjet. Figure 2.4 shows a com-parison between the computations and meas-urements of headrise and efficiency as a func-tion of flow rate. The agreement between RANS computations and measurements is very good.
Figure 2.3 Axial-flow waterjet pump for RANS flow computations (Brewton, et al., 2006).
Figure 2.4 Comparison of headrise and pump efficiency between RANS computations and measurements (Brewton, et al., 2006).
validation efforts, they also computed the per-formance of the axial-flow pump designed by Lavis, et al. (2007). The computed torque val-ues were significantly lower than the experi-ments. The authors attributed the discrepancy to the lack of proper modelling of the gap flow and to the simple viscous model in their BEM code. Further verification and validation is re-quired to confirm this.
Bulten and Verbeek (2007) presented a de-velopment of an axial-flow waterjet at Wärtsila company. The cavitation performance of the axial-flow pump in terms of cavitation margin was significantly better than the equivalent mixed-flow pump with similar efficiency. Based on the extensive computational and ex-perimental efforts, Wärtsila developed two commercial axial-flow pump series LJX and WLD and made them available in the market.
The U.S. Navy is engaged in the develop-ment of axial-flow pump technologies for ap-plications to large high-speed naval ships. Fung, et al. (2007) developed a notional mono-hull design of a high-speed sealift ship with different bow and stern configurations to eva-luate the powering performance of different propulsor configurations, including the axial-flow and mixed-axial-flow waterjets, podded propul-sors and the conventional open propellers with shafts and struts. Resistance tests showed that the hull form for the axial-flow waterjet was most favorable (Cusanelly, et al., 2007). Pow-ering tests confirmed that waterjets performed better for higher speed range than conventional open propellers and that for lower speed range the conventional open propellers performed better. Figure 2.5 shows the stern of the model hull with four axial-flow waterjets and inlets. Figure 2.6 shows the model powering test in the towing tank at 39 knots full-scale speed.
2.2.2 Podded Propulsors Following the
first podded propulsor conference in 2004 (T-POD 2004), the second one (T-(T-POD 2006) was held in 2006 in France where continued pro-gresses in the design and analysis capabilities, open-water and propulsion test procedures,
powering performance predictions were pre-sented.
Figure 2.5 Axial-flow waterjets and inlets for a notional high-speed sealift ship (Cusanelly, et al., 2007).
Figure 2.6 Powering test of a high-speed sea-lift ship with four axial-flow waterjets (Cu-sanelly, et al., 2007).
2.2.3 Advanced Blade Sections: Conven-tional propellers are inefficient at high speed primarily due to significant blade cavitation. Increasing demand for high speed ships moti-vates the development of efficient propulsors at both low and high speed. Several papers on advanced blade sections that would perform well in both low and high speed regimes have recently been presented. Figure 2.7 shows a general trend of efficiency as a function of ship speed for different types of propulsors (Black, et al., 2006).
Figure 2.7 Overall propulsive coefficient ver-sus ship speed for different propulsor types (Black, et al., 2006).
Black, et al. (2006) developed new blade section concepts that have the efficiency char-acteristics of conventional submerged sub-cavitating propellers at low and intermediate speeds but can transition to a super-cavitating mode for high speed operation without encoun-tering thrust breakdown (see Figure 2.8).
Figure 2.8 Geometric parameters for advanced blade section definition (Black, et al., 2006).
Using the 2-D section shape in Figure 2.8, a notional new propeller design was developed for a Patrol Craft (see Figure 2.9). The new de-sign retained the same skew, chord, rake and spanwise loading as the parent propeller. The computational results for the required horse-power for the new propeller compared to the non-cavitating parent propeller are shown in Figure 2.10. At 20 knots, both propellers were predicted to operate at the same efficiency and RPM. At 39 knots, the parent propeller requires 23% more horsepower than the new design.
Figure 2.9 Patrol Craft with 4 parent propellers (Black, et al., 2006).
Figure 2.10 Required shaft horsepower versus speed for a Patrol Craft propeller (Black, et al., 2006).
dual-cavitating hydrofoil section developed by Shen (1996) that is capable of operating effi-ciently at low- and mid-speeds in subcavitating (fully wetted) mode, and at high-speeds in the supercavitating mode (see Figure 2.11). The authors developed a numerical tool based on BEM to predict the hydrodynamic and hydro-elastic response of propellers in subcavitating, partially cavitating, and supercavitating condi-tions. The authors applied the numerical tool to predict the performance of the well-known Newton-Rader (1961) propeller that has blade sections similar to the dual-cavitating blade sections. The predicted cavitation patterns, blade forces, stress distributions, blade deflec-tions, and dynamic characteristics in various cavitating conditions were in good agreement with measurements.
Figure 2.11 Comparison of SCP/SPP blade section (upper) and the dual-cavitating blade section (lower) (Young and Shen, 2007).
2.2.4 Full Scale Measurements Despite
the importance of the full scale data, published data are scarce due to the cost and difficulties associated with full scale tests.
The most notable full-scale measurements were performed recently as part of the ERO-CAV (EROsion on Ship Propellers and Rud-ders - the Influence of CAVitation on Material Damages) project. Full scale cavitation obser-vation and erosion data for five ships were ob-tained in this project. An executive summary of the EROCAV Project can be found in the 24th ITTC report of the Specialist Committee on Cavitation and Erosion on Propellers and Ap-pendages on High Powered/High Speed Ships. Ligtelijn, et al. (2004) presented valuable results of a three-year research project, named CoCa (Correlation of Cavitation), in which cor-relation of propulsive performance, propeller
cavitation and propeller-induced hull-pressure fluctuations were studied. The focus of the pro-ject was on cavitation. Full scale experiments were carried out first, followed by model tests and computations in which the circumstances encountered on full scale were approximated as closely as possible. Five different ships used in this project are listed in Table 2.1. All model tests were performed in MARIN. Propulsion tests were conducted in the deep-water towing tank and the cavitation observations and hull-pressure pulse mmeasurements in the depres-surized towing tank. All the measurements are presented in normalized values.
Table 2.1 Ship type and propulsion system in CoCa project (Ligtelijn, et al., 2004)
Ship’s name Ship type Propulsion
P&O Nedlloyd
Tasman Containership 5,000TEU Single FPP 54,900kW
P&O Nedlloyd
Shackleton Containership 6,800TEU Single FPP 65,880kW
Costa Atlantica Cruise ship Twin Azipod
2x17,600kW
Amsterdam Dredger Twin CPP, Nozzle
2x7,000kW
Uilenspiegel Dredger Twin CPP, Nozzle
2x5,670kW
Although the level of correlation varied among different ships and test conditions, the speed-power correlations were in general satis-factory for all five ships, with the exception of the containership results in ballast condition. The speed-power relation for the cruise ship, Costa Atlantica, is shown in Figure 2.12 and the correlation between the prediction and trials appears to be very good.
Figure 2.12 Speed-power correlation for cruise ship, Costa Atlantica (Ligtelijn, et al., 2004).
Loaded Condition
(b) Ballast Condition
Figure 2.13 Speed-power correlation for con-tainer ship, Tasman, at loaded (upper) and bal-last (lower) conditions (Ligtelijn, et al., 2004).
For the pressure pulse level, the cruise ship with podded propulsion showed a good correla-tion as shown in Figure 2.14. The first blade-rate harmonic component of the fluctuating pressure in normalized form is presented in this figure. In case of the container ship, Tasman, pressure pulses at model scale were signifi-cantly higher than the full scale measurements as shown in Figure 2.15. The wake scaling ef-fect is believed to be a dominant factor for
higher pressure pulses for model scale than that for full scale.
Figure 2.14 Hull-pressure fluctuations (1st blade rate) for cruise ship, Costa Atlantica, at 100% MCR (Ligtelijn, et al., 2004).
Figure 2.15 Hull-pressure fluctuations for con-tainer ship, Tasman at 100% MCR (Ligtelijn, et al., 2004).
Bobanac, et al. (2005) developed a cost ef-fective method for the observation and re-cording of full scale propeller cavitation (see Figures 2.16 and 2.17). The design enables relatively cheap and fast mounting/dismounting without necessity for expensive ship docking. The window with an optical prism, flat with the bottom plating, improves view angles without disturbing the ship wake.
Figure 2.17 Observation windows for twin-screw vessel (Bobanac, et al., 2005).
Figure 2.18 compares the model and full-scale cavitation patterns for a small fast ship at two engine rpms (1,500 and 1,800). The au-thors concluded that cavitation patterns on model propellers did not correlate well with the full scale observations for a fast small ship.
Figure 2.18 Comparison of model and full scale cavitation patterns for a fast small ship; LHS for 1500 rpm and RHS for 1800 rpm, (a) model (b) full scale (Bobanac, et al., 2005).
Sampaio, et al. (2005) presented full scale trials for three different hull/propeller rough-ness conditions. The trials were performed with Brazilian patrol vessel ‘Guaporé’. The length and breadth of the vessel are 46.5m and 7.5m, respectively. Twin, three-bladed propellers of 1.44m diameter are installed. Nominal power of each shaft is 2,503hp at 642.5rpm. Ship trial conditions are summarized in Table 2.2.
Table 2.2 Trial conditions
Trial I II III
Date (2001) 08/07 08/08 11/19 Draft, fwd m 2.15 2.15 2.20 Draft, aft m 1.95 1.95 1.95 Draft, mean m 2.05 2.05 2.08 Displaced Vol. m3 272 272 276.8 Displacement ton 278.3 278.3 283.3 Wetted Area m2 297.4 297.4 299.3 Trial I was carried out with the hull and pro-pellers in fouled condition. For trial II, propel-lers were cleaned by a diver. Trial III was car-ried out just after a periodic maintenance dock-ing. The full-scale tests consisted of a series of runs in calm seas without strong currents. Dur-ing the test the propeller revolution was kept constant for a specific distance/time interval required for a constant advance speed. The re-duction of power with the maintenance proce-dure is clearly seen in Figure 2.19. Although the hull surface condition was not described in the paper, it is clear that the fouling on hull and propeller surface greatly reduces the powering performance.
Figure 2.19 Comparison of speed-power for three different hull/propeller conditions (Sam-paio, et al., 2005).
2.2.5 Scale Effects: Tzabiras (2004)
extended to solve the free-surface problem em-ploying a moving grid approach based on a conformal mapping technique which allows rapid grid adjustment under a specified bound-ary. The transport equations are solved accord-ing to a marchaccord-ing procedure based essentially on 2D computations. This is attainable due to the existence of the dominant velocity compo-nent parallel to ship axis as well as to the Dirichlet boundary condition for the pressure on the free-surface. The steady-state method has been applied successfully to solve the resis-tance and self-propulsion problems for a Se-ries-60 CB=0.6 hull at various Froude and
Rey-nolds numbers. Calculated results for the inte-grated resistance and propulsion characteristics show satisfactory agreement with measure-ments at model scale. Computations at full scale demonstrate that the Froude hypothesis is valid.
Krasilnikov, et al. (2007) studied scale ef-fects for ducted propeller performance using a RANS solver with a hybrid structured and un-structured grids for scale effects. The results indicated that when changing from model to full-scale conditions the duct thrust increased for all studied arrangements at all considered propeller loadings. The scale effect on duct thrust was more pronounced at lighter loadings where the relative contribution of viscosity was larger. It was also found that the blade area ra-tio of the propeller did not seem to have strong influence on increase in full-scale duct thrust. The change of full scale propeller thrust and torque compared to model scale was a complex, combined effect of the following factors: the increase in average flow velocity through the duct at higher Reynolds numbers; the decrease in thickness of the boundary layer on the inte-rior duct surface resulting in different local blade loading at the tip and ultimately, to dif-ferent flow picture around the blade tip and its effect on duct characteristics; and changes in both lift and drag of blade sections due to an increase in Reynolds number.
2.2.6 Self-Propulsion Predictions Using CFD The CFD Workshop Tokyo 2005 (Hino
Ed., 2005) provided a forum for computational analysts to evaluate the maturity of various CFD codes in predicting calm water resistance and self-propulsion performance of three hull-forms; container ship, VLCC, and naval com-batant. Comparative computations of the flow characteristics for the KRISO container ship, KCS, without the rudder at self propulsion point were part of the workshop. The test con-ditions were Fn = 0.26 and Rn = 1.4x10⁷ at even
keel (fixed trim and sinkage). Four groups par-ticipated in this category. They were Hamburg Ship Model Basin (HSVA), Potsdam Model Basin (SVA), KRISO (Korea Research Insti-tute of Ships and Ocean Engineering, now MOERI, Korea) and Osaka Prefecture Univer-sity (OPU).
Chao (2005) at HSVA used the commercial RANS code, COMET, for viscous flow compu-tations using the RNG k-ε turbulence model with the standard wall function. He also used the potential-flow Quasi-Continuous Method (Lan, 1974) for the propeller flow. The propel-ler effect was computed using the body force concept with the actual propeller geometry tak-en into account. The body forces are distrib-uted in the swept volume of the rotating propel-ler blades as functions of the axial, radial and tangential directions. The self-propulsion characteristics such as (1-t) and (1-wt) were
computed and compared with the experiments in Table 2.3. The predicted propeller torque in both open and behind conditions was higher than the measurements. Consequently the pre-dicted open water efficiency (ηo), the relative
rotative efficiency (ηr) and the quasi propulsive
efficiency (ηD) are slightly lower than the
mea-surement.
alone were investigated for three different mesh configurations for grid convergence tests. For the simulation of self-propulsion, computa-tions were performed only on the coarse (0.27M grid cells) and medium size meshes (2.15M grid cells) only. The self-propulsion characteristics are compared in Table 2.3. The propeller open water efficiency was signifi-cantly lower than the experiments. The thrust deduction factor (1-t) was higher and the wake fraction (1-wt) was lower, thus giving a higher
hull efficiency.
Kim, et al. (2005) at KRISO used their in-house RANS code, WAVIS for self propulsion simulation of KCS. WAVIS is a finite volume based multi-block RANS code. The realizable k-ε turbulence model with a wall function is employed for the turbulence closure. The free surface is captured with the two-phase level set method and body forces are used to model the effects of a propeller without resolving the de-tailed blade flow. The propeller forces are ob-tained using an unsteady lifting surface method based on potential flow theory. The self-propulsion point is obtained iteratively through balancing the propeller thrust, and the ship hull resistance. The unsteady lifting surface code is also iterated until the propeller induced veloc-ity is converged in order to obtain the propeller force. The authors did not present the self-propulsion factors in their paper presented to the workshop, but presented them in a later pa-per (Kim, et al., 2006). The numerical self-propulsion factors are in excellent agreement with experiment as shown in Table 2.3.
Tahara, et al. (2005) at OPU applied the RANS code, FLOWPACK, to their self-propulsion simulations. FLOWPACK code adapted a free surface tracking approach and is coupled with a propeller program (Nakatake, 1981) based on an infinite-blade propeller the-ory (Yamazaki, 1968). Propeller effects are in-cluded in the RANS equations by a thin body force approach. The body force distribution was iteratively determined by a propeller per-formance calculation based on the above-mentioned theory. Computational results of
[image:11.595.307.544.452.703.2]the self-propulsion factors are in good agree-ments with experiagree-ments as shown in Table 2.3. Hino (2006) at NMRI also calculated self-propulsion factors of KRISO Container Ship using the RANS code, SURF, developed in-house. A body force model is employed to take into account the propeller effect. The body force distributions are calculated using a sim-plified propeller model based on an infinite-blade propeller theory. The propeller open wa-ter performance predicted by the simple theory was satisfactory. The overall accuracy of the self-propulsion factors is good as compared with experiments in Table 2.3. Figure 2.20 shows the measured and computed axial veloc-ity distribution behind a propeller. Although the computed accelerating flow is weaker than the measurements, general flow feature is well predicted. (Note: In Hino’s paper, the experi-mental and computational values of (1-t) and (1-wt) were switched in his Table 7.)
Table 2.3 Computational results of the self-propulsion factors
(Kim, et al., 2006 and Hino, 2006).
1-t 1-wt ηo ηr J rpsn η
Exp. 0.853 0.792 0.682 1.011 0.728 9.50 0.740 HSVA 0.865 0.789 0.667 0.981 0.725 9.56 0.717 SVA 0.910 0.765 0.614 1.007 0.708 9.50 0.735 KRISO 0.846 0.779 0.671 1.023 0.729 9.38 0.746 OPU 0.852 0.789 0.631 1.074 0.718 9.53 0.732 NMRI 0.850 0.810 0.659 1.010 - - 0.770 Mean 0.865 0.786 0.648 1.019 0.720 9.49 0.732 S.D. 0.026 0.016 0.025 0.034 0.009 0.08 0.020
(Measured) (Computed)
2.2.7 Propeller-Rudder-Hull
Interac-tions: Propeller-rudder and
propeller-rudder-hull interactions are becoming increasingly im-portant to further improve ship performance. Advancements in measurement techniques and computational capabilities enable the investiga-tion of these complex interacinvestiga-tions that affect ship performance.
Felli, et al. (2006) investigated the free-running propeller-rudder interaction with a fo-cus on the tip vortex/rudder interaction. They used LDV phase sampling technique and high frame-rate CMOS camera to visualize the complex unsteady downstream flow details in the Italian Navy Cavitation Tunnel (CEIMM). For a computational method, they used an ex-tended BEM method originally developed by Greco and Salvatore (2004).
An all-movable rudder with a simple rec-tangular planform with symmetric NACA 0020 profile and a four-bladed propeller with 0.272m diameter were used for the study (see Figure 2.21). The propeller was placed 0.4D ahead of the rudder. The rudder was placed off-center by 0.05m to the starboard side.
Figure 2.21 Overview of propeller-rudder in-stallation (Felli, et al., 2006).
Figure 2.22 shows the image of the propel-ler tip vortices along the rudder taken by a high-speed camera. The image shows details of tip vortex deformation as it moves along the rudder surface and eventually reconnects after passing the rudder trailing edge.
Takada, et al. (2002) developed a simulation method of free-surface flow around hull and
rudder with propeller effects using the RANS code, FS-MINTS, employing a multi-block grid technique. Propeller effects are included as body forces calculated by the unsteady Quasi-Continuous Method. Self-propulsion factors of a modern full ship with rudder are accurately estimated.
Figure 2.22 Chordwise evolution of propeller tip vortices at t=0.0155 sec (Felli, et al., 2006).
Simonsen and Stern (2005) studied hull-propeller-rudder interaction with respect to ship manoeuvring using the RANS code, CFDSHIP-IOWA coupled with a simplified propeller model based on an infinite-blade the-ory. Computations are performed for an open-water propeller for the Series 60 ship sailing straight ahead and for the appended tanker Esso Osaka in different maneuvering conditions. The results are compared with experimental data, and the tanker data are further used to study the interaction among the propeller, hull, and rudder. A comparison between the calcu-lated and measured data for the Series 60 ship shows a fair agreement, where the computation captures the trends in the flow. For the tanker, the flow study reveals a rather complex flow field in the stern region, where the velocity dis-tribution and propeller loading reflect the flow changes caused by the different maneuvering conditions.
are in excellent agreement with experimental measurements. Detailed comparisons of com-putational results with experiments are pre-sented in Section 4.2.
For high-speed ships, rudder cavitation is increasingly becoming an important mainte-nance issue. Paik, et al. (2008) investigated unsteady cavity patterns around the gap of the semi-spade rudders for a large container ship (see Figure 2.23). Several model-scale partial rudders with different thickness-to-chord ratios and gap sizes were investigated. Tests were conducted in the cavitation tunnel in a uniform flow without the propeller. The size of the par-tial rudder is 0.8 m (chord length at the mid-section) x 0.6 m (height) and the tunnel section size is 0.6 m x 0.6 m. Since the partial rudder occupies the entire tunnel height, blockage ef-fects will be significant on the cavitation per-formance. Figure 2.24 shows a snapshot of unsteady gap cavitation for two different de-signs. They also measured the flow field using PIV and surface pressures using pressure tabs. However, their analyses and the presentation of the results were confusing. Correct interpreta-tion of the results would require careful analy-sis of the data, including the effect of the tunnel blockage.
[image:13.595.81.262.521.635.2]Figure 2.23 Partial model of a semi-spade rud-der (chordlength = 0.8 m, height = 0.6m) (Paik, et al., 2008).
Figure 2.24 Snapshot of unsteady cavitation on partial rudders with different thickness (α=4o and σ=1.0) (Paik, et al., 2008).
2.2.8 Anti-Fouling Paint: In order to
maintain the efficiency of a ship it is important to keep the propeller and the hull free from fouling. Current anti-fouling paints containing toxic components Tri Butyl Tin (TBT – SPC). International Maritime Organisation (IMO, 2001) and European Council and Parliament (EC) issued a regulation removing their use for ships completely by 2008 (EC, 2003). As a re-sult, new environmentally friendly anti-fouling systems have been introduced to the market. Atlar, et al. (2005) reported that more than 150 full-scale propellers have been coated with such a paint type. Mutton, et al. (2005) re-ported that the coatings on the propeller surface of a research vessel, Bernicia, are almost intact after 37 months in service without cleaning. The roughness of propeller blade surface will affect the propeller efficiency. Atlar, et al. (2002, 2003) have calculated that a tanker pro-peller coated with foul release coating dis-played a 6% gain in the efficiency of the same full-scale propeller without coating.
surface roughness corresponding to in-service propellers.
2.3 Propeller Numerical Modelling
2.3.1 Bubble-Propeller Interaction: Hsiao,
[image:14.595.314.538.338.684.2] [image:14.595.74.271.414.594.2]et al. (2006) developed a numerical model for gas diffusion across the bubble wall and incor-porated in a multi-bubble dynamics code. The code was used to study bubble nuclei popula-tion dynamics in the propeller flow field that was obtained using a RANS solver. Bubble nuclei populations were propagated in this field. Large visible bubbles are seen to cluster in the tip vortices and in the wakes of the blades (see Figure 2.25). The bubble size becomes larger downstream of the propeller than the original upstream size due to a net influx of originally dissolved gas into the bubble. Bubble explosive growth and collapse, are an essential ‘catalyst’ to enable significant diffusion.
Figure 2.25. Bubble entrainment in the low pressure regions. Bubble sizes are to scale in section (b), They are enhanced by a factor of 5 in sections (a) and (c) (Hsiao, et al., 2006).
In conjunction with microbubble drag reduc-tion efforts in Japan, Kawamura, et al. (2007) investigated the effects of bubbles on the pro-peller efficiency. A two-fluid multiphase flow model was developed with the governing equa-tions including the mass and momentum con-servation of the mixture and the bubble phases. The validation of model was carried out using
experimental data for a 2D hydrofoil. Figure 2.26 compares the numerical predictions with measured lift and drag coefficients. For a giv-en angle of attack, experimgiv-ental data showed that the lift is reduced and drag is increased with increasing void fraction. Although the magnitudes are significantly different, the trend was correctly predicted by the numerical model. It was shown that bubbles are relatively accel-erated around the leading edge of a hydrofoil or a propeller blade, and that the acceleration of liquid is reduced due to the bubble acceleration. This effect lowers the peak of the negative pressure at the leading edge resulting in the de-crease in the lift and the inde-crease in the drag coefficients.
The same numerical model was applied to the prediction of the propeller open water effi-ciency in bubbly flow. As shown in Figure 2.27, the efficiency decreases with increasing void fraction. The numerical predictions showed the same trend, but for a given void fraction, the numerical model significantly un-der-predicted the efficiency when compared to the experiments. For improving the quantita-tive accuracy it is probably necessary to in-clude the effect of bubbles on the boundary layer characteristics, which is not included in the present model. The sensitivity to the as-sumed bubble size must also be investigated in the future.
Figure 2.27 Measured and computed effi-ciency of the model propeller in single phase and bubbly flows (Kawamura, et al., 2007).
The results of bubble effects on propeller performance may have a significant implication on the microbubble drag reduction efforts. The negative bubble effects on propeller perform-ance should be minimized in order to achieve maximum net power reduction resulting from microbubble drag reduction.
2.3.2 Effects of Turbulence Model:
Ka-wamura, et al. (2004) investigated the influ-ence of the turbulinflu-ence model on cavitating and non-cavitating propeller open water character-istics using the commercial RANS code FLU-ENT. Computations for a conventional propel-ler were carried out using a two-layer RNG k-ε, standard k-ω and SST k-ω model. Thrust and torque coefficients were compared with meas-urements. The calculated torque coefficients were affected by turbulence model and the
dis-crepancy between calculated and measured tor-que coefficients was smallest in the case of the standard k-ω model.
Li, et al. (2006) studied the influence of tur-bulence model on the prediction of model- and full-scale propeller open water characteristics using RANS code, FLUENT. Three two-equation models, SST k-ω, RNG k-ε and Real-izable k-ε model were selected to study the scale effects of conventional and highly skewed propellers (see Figure 2.28). At model scale, the performance predicted by all the models is fairly close to each other. Compared to experiments, the prediction error is less than 2% for KTand less than 12% for KQ. For the
conventional propeller at full scale, the per-formance predicted by the SST k-ω model dif-fers marginally from the two k-ε models. For the skewed propeller at full scale, there is nota-ble difference in performance. The SST model predicted that KTis increased by about 5% with
no change in KQ. The k-ε models predicted
slightly decreased KT (~0.8%) and KQ (~5-6%).
The results suggest that the influence of turbu-lence model is dependent on propeller geome-try.
An examination of the local skin friction distribution on blade sections revealed that on-ly the SST k-ω model gives the expected dis-tribution of local skin friction at both scales for both propellers. The k-ε models produce an erroneous skin friction for both propellers at full scale. Careful study is required to explain the doubtful results.
2.3.3 LES for Complex Flow: Several pa-pers presented applications of Large Eddy Simulation (LES) for steady and unsteady pro-peller flows. Bensow, et al. (2006) computed the propeller near-wake flow using LES on a rotating grid. The results were compared with PIV and LDV measurements. LES can provide useful qualitative information about the flow in the near wake concerning e.g. the evolution and interaction of tip and hub vortices with the blade.
Vysohlid and Mahesh (2006) successfully predicted highly unsteady, separated flow around a propeller in crashback operation using unstructured LES in a rotating frame of refer-ence. Crashback is an operational mode where ship is moving forward but propeller is turning backward (negative rotation). Therefore, the sharp trailing edge of the blade becomes the leading edge, thus creating a large separated flow at the leading edge. Furthermore, the propeller is pushing the flow forward against the onset flow, creating a huge unsteady ring vortex around the propeller. Vysohlid and Ma-hesh successfully computed, arguably this most complex of propeller flows, using LES (see Figure 2.29). Previous attempts to compute the crashback flow using unsteady RANS code were not successful. It is likely that RANS is unable to adequately predict crashback because of the pervasiveness of large-scale unsteadiness.
Figure 2.29 Contours of axial velocity and streamlines for crashback J = - 0.7, Re = 480,000 (Vysohlid and Mahesh, 2006).
The mean values, root mean square (RMS) of velocity fluctuations and spectra of thrust, torque and side-forces were in a good agree-ment with experiagree-ment. Table 2.4 shows a comparison of computed mean thrust, torque
and side forces with water tunnel experiments. It is to be noted that the agreement of the RMS values between LES computations and the measurements is remarkable.
Table 2.4 Comparison of mean and RMS val-ues at J = -0.7 (Vysohlid and Mahesh, 2006)
KT KQ Kfy Kfz
Mean (LES) -0.38 -0.072 0.004 -0.002
Mean (Exp.) -0.33 -0.065 0.019 -0.006
RMS (LES) 0.067 0.012 0.061 0.057
RMS (Exp.) 0.060 0.011 0.064 0.068
3. REVIEW ITTC RECOMMENDED
PROCEDURES
• 7.5-01-02-01: Terminology and No-menclature of Propeller Geometry (Harmonize with ISO standard)
• 7.5-02-03-01.1: Propulsion Test
• 7.5-02-03-02.1: Propeller Open Water Test
• 7.5-02-03-02.3: Guide for Use of LDV
• 7.5-02-05-02: High Speed Marine Ve-hicles Propulsion Test.
(a) Determine if any changes are needed in the light of current practice.
(b) In the review and update of the existing propeller open water test procedure 7.5-02-03-02.1 its applicability to new types of propulsors should be taken into account.
(c) Identify the requirements for new pro-cedures.
3.1 7.5-01-02-01: Terminology and
Nomenclature of Propeller Geometry
3.1.1 Review of Terminology: The
Propul-sion Committee reviewed the terminology and nomenclature of propeller geometry described in the ITTC document 7.5-01-02-01. In gen-eral, the document presented an extensive list of terminologies and nomenclatures for propel-ler geometry with clear explanations. However, minor but important changes and clarifications in the definition of some terms were recom-mended in a separate report submitted to the ITTC Advisory Council.
The Propulsion Committee also reviewed the ISO Standard described in the document BS EN ISO 3715-1: 2004 entitled Ships and marine technology — Propulsion plants for ships — Part 1: Vocabulary for geometry of propellers. This document was adopted as Eu-ropean and British Standards. In general, the vocabulary used for propeller geometry is de-fined well. However, there is a philosophical difference between the two documents. The propeller vocabulary in the ISO Standard is written from a manufacturing view point whe-reas the ITTC definitions are written from a hydrodynamic view point.
Careful comparison of the terminology for propeller geometry in the two documents re-vealed some differences in the definition of terms. For example, in the ISO Standard, sev-eral definitions of pitch are were presented such as pitch of pressure side, pitch of mean line, local pitch, pitch of mean line at leading point of blade section, pitch of mean line at trailing point of blade section, mean pitch of blade, mean pitch of propeller, and pitch at a certain radius. The large number of pitch de-finitions does not appear to add significant val-ue to manufacturers nor to towing tank re-searchers. Two definitions in the ITTC docu-ment, i.e. the geometric pitch and hydrody-namic pitch, appear to be sufficient for the ITTC community.
The definitions of skew and rake in the ISO document (Figure 7 of the ISO document) are not as rigorous as the ITTC definition. In the ITTC terminology, the total rake is defined as the sum of the (pure) rake and the skew-induced rake. The ISO document does not separate the two components. The rake of blade sections in the ISO is equivalent to the total rake in the ITTC terminology.
While several terminologies in both docu-ments were related to the expanded cylindrical blade section (for example, the nose-tail line (chord line), camber (mean line), leading and trailing edges and the thickness), neither gave any explanation about how the blade section geometry is defined, particularly in the hydro-dynamically important leading edge area.
There are two ways of defining the cylindri-cal blade section geometric characteristics in the expanded plane that are widely accepted by the propeller community. One way is to add the thickness to the chord line as shown in Figure 3.1 and the other is to add the thickness per-pendicular to the mean line as shown in Figure 3.2 (Abbott and von Doenhoff, 1959). It was recommended in a separate report to the Advi-sory Committee that these two figures be in-cluded in the new ITTC terminology document.
Figure 3.1 Definition of expanded cylindrical blade section geometry with thickness added normal to chord line (nose-tail line).
x
y
( )x t 2 1
( )x t 2
1 f( )x
( )x yU
( )x yL
Leading Edge Upper Surface
(Back or Suction Side)
Lower Surface (Face or Pressure Side) x
Leading Edge Trailing
Edge
Mean Line
Figure 3.2 Definition of expanded cylindrical blade section geometry with thickness added normal to mean line.
3.1.2 Propeller Geometry Definition on
Non-Cylindrical Sections: For propellers
with a highly tapered hub such as podded pro-pulsor or a tip boundary such as ducted propul-sor, the conventional method of describing their geometry in cylindrical sections is not adequate. Neely (1997) presented various me-thods for describing the propeller geometry based on non-cylindrical sections with the co-ordinate system shown in Figure 3.3. He de-rived equations for three non-cylindrical meth-ods; a constant pitch angle method, a method based on geodesic curves, and a constant-pitch method. Each method has a characteristic equ-ation that defines the nose-tail line and offset curves:
Constant Pitch Method: rtanφ=constant
Constant Pitch Angle Method: φ=constant
Geodesic Method: rcosφ=constant
Figure 3.3 Coordinate systems for non-cylindrical sections (Neely, 1997).
While each method produced the identical result for the special case of cylindrical sec-tions, each produced a significantly different result (see Figure 3.4), given the same basic input (pitch, camber, chord, thickness, skew and rake). He recommended that the constant-pitch-angle method be used for defining the propeller geometry on non-cylindrical sections since it was the simplest of the three, particu-larly in the special case of conical sections.
3.1.3 NURBS Surface for Propeller
Ge-ometry: Numerically-controlled (NC)
ma-chines are increasingly used for fabrication of model-scale as well as full-scale propellers. Typically, a propeller design is passed to the manufacturer as a discrete set of x-y-z coordi-nates. The manufacturer must then interpolate the point set in order to define the NC tool paths in between the given points. The designer and manufacturer may have different surface definitions. As a result, the quality of the ma-chined surface may not be what the designer intended. In order to avoid these types of prob-lems, a common interpolation function is re-quired. Then, the surface would be completely and uniquely defined, and anyone who uses the geometry would interpret it in exactly the same manner.
Figure 3.4 Sections generated from the same propeller parameters (Neely, 1997).
( )x yU
( )x yL
( )x t 2 1
( )x t 2 1
( )x f
( )x xU
( )x xL
The Non-Uniform Rational B-Spline (NURBS) surface definition (e.g. Rogers & Adams (1990) and Farin (1990)) is widely ac-cepted as the standard spline functions in the automobile, aerospace and shipbuilding indus-try. Neely (1998) presented an application of NURBS surface for defining the marine propel-ler geometry. Many commercial CAD soft-ware have the ability to generate NURBS sur-faces given discrete data points.
Neely (1998) also provided techniques that would help to avoid common problems in gen-erating propeller surfaces. Various parameteri-zation schemes were discussed with regard to their effect on fitting a curve through points representing the foil geometry. A “half-cosine” parameterization scheme was introduced which is appropriate for airfoil or propeller blade sec-tion geometry. Its effect is to stretch out the leading edge region in parameter space, which results in a smooth curvature variation around the leading edge.
3.2 7.5-02-03-01.1: Propulsion Test
3.2.1 Propulsion Test Procedure Review:
The survey results by the 24th ITTC Propulsion Committee showed that the majority (79%) of the participating tow tank community did not think major changes were required in the Pro-pulsion Test procedure. However, the proce-dure as written is quite general and leaves room for specific interpretations subject to individual tank’s routine practices, instrumentation equipment and model/full scale correlation procedures adopted. The Propulsion Test pro-cedure review was accomplished in two as-pects; minor editorial changes and suggestions for inclusion of special propulsion cases, not addressed in the current procedure.
3.2.2 Editorial Changes: In Section 1
Purpose of Procedure, the third paragraph from top: remove cycloidal propellers and paddle wheels, as these are not typical propulsion sys-tems and seldom subject to self-propulsion test-ing. Include multi-screw propulsion systems
with split (different) power/RPM distribution among various propellers. Typically these may represent hybrid propulsion systems, double ended ferries, and multiple screw systems with propellers of variable diameter/pitch settings.
In Section 2.2 Definition of Variables: Add:
Nozzle Thrust (N) TN
Thruster/Pod Unit Thrust (N) TU
Thruster/Pod Unit Side Force (N) YU
Relative Rotative Efficiency (-) ηR
In Section 3.1.1.1 Hull Model: Add at the end of second paragraph “as well as thrus-ter/pod unit thrust and side force”.
In Section 3.1.2.2 Propeller/Propulsion Unit Model: Add: “It is strongly recommended to couple the thruster and especially pod units to a steering machine, allowing step-wise rudder angle variation. Thus the optimum (minimum shaft power) unit rudder angle determination and adequate measurement of the unit side force could be efficiently executed. Addition-ally this set-up would allow dynamic pod loads measurements during model steering”.
In Section 3.1.3 Measuring Systems: Add: “Pod unit side force”.
In Section 3.2.2 External Tow Force, at the end of the first paragraph: The tow force is a correction to the hull resistance due to differ-ence in friction between ship and model. Therefore, it is considered more feasible to ap-ply the towing force in line with resistance force, i.e. at LCB and VCB. Hence replace “in
the line of the propeller shaft and at the LCB”
with “applied at LCB and VCB”.
the reference to the carriage maximum speed is obsolete and it is recommended to specify the speed accuracy only up to 3 mm/sec.
In Section 3.3 Calibration: Include guidance for calibration of the nozzle strain gauge and pod unit thrust and side force balance.
In Section 3.4.4 Measured Quantities: De-lete the second and third paragraphs, in line with the proposed removal of cycloidal propel-lers and paddle wheels.
In Section 3.4.5 Shaft Tare Test: Delete the last paragraph, in line with the proposed re-moval of cycloidal propellers and paddle wheels.
In Section 3.5 Data Reduction and Analysis: The recommended reduction of wake fraction and relative rotative efficiency is based on the thrust identity. Many experimental facilities use also torque identity approach or both. The majority of full-scale trial performance meas-urements include propeller torque only. For practical correlation purposes the torque iden-tity approach seems equally feasible. Therefore, it is recommended to include both thrust and torque identities.
3.2.3 Special Propulsion Test Cases
(i) Hybrid Propulsion Systems As already
commented in the 24th ITTC Propulsion Com-mittee report, several hybrid (mixed) propulsor arrangements have recently been reported. The basic idea behind these innovative propulsion systems is to decrease the propeller loading, as well as to decrease the rotational losses by ap-plication of the contra-rotating propeller con-cept. Typically the hybrid propulsion systems consist of conventional single (or twin) propel-ler, combined with azipod(s). The latter could be located aside the conventional propeller, or behind it, to utilize the contra-rotating effect. Additional benefit of this concept is the im-proved manoeuvrability.
Minami and Kawanami (2005) and Ka-wanami, et al. (2005) presented an excellent
summary paper on the Japanese Eco-ship pro-ject. The CRP podded propulsor, which was one of the propulsion systems investigated, en-abled very good manoeuvrability and flexible control system in ship operation as well as high propulsion efficiency.
Ukon, et al. (2006) reported the model test results of a combination of podded propulsion with different stern shapes of a 50000 DWT product carrier. Details of the pod open water, ship model resistance and self-propulsion test procedures were also presented. Two analysis approaches were presented: the entire pod unit is considered as a propulsor and is not included in the resistance test, so called “system-base method”; the strut-pod is considered as part of the ship hull (appendages). This was defined as “propeller-base method”. Extrapolating the re-quired power from the self-propulsion test, the correction for Reynolds number effect on the podded propulsor drag should be made by es-timating the resistance of the podded propulsor both in full and model scale. The self-propulsion test was performed by the system-base method using the resistance of the bare hull and lowering the podded propulsor load from the ship self-propulsion point based on the propeller-base method.
Van and Yoon (2002) presented model test equipment and techniques for a cable laying ship equipped with twin azimuthing thrusters as prime movers. Three extrapolation methods with different definitions of thrust and resis-tance were compared. The authors concluded that more justifiable scale effect corrections for the azimuthing thruster components (thruster leg, pod, nozzle) have to be formulated.
Sasaki, et al. (2006) presented a model test procedures for a hybrid pod and conventional propellers as a CRP unit. The paper also in-cluded a summary of the results from the Joint Research Project originally initiated by ABB, Veikonheimo (2006). The project objectives were to compare experimental results, analysis and performance predictions of podded propul-sors among major European towing tanks. The testing scope included unit open water test, propeller alone open water test, pod resistance tests and analysis. The same model propeller was tested in all basins, while each basin man-ufactured its own pod model. Each basin had a different method of scaling the pod drag from model to full scale. Surprisingly the open water test results for the propeller alone showed greatest differences between scaling techniques and torque coefficient variations. This bench-mark project showed that more work should be done when the accuracy level of results within +/- 2% is reached. It was concluded that devel-opment of more harmonized methods between different basins to scale podded propulsion per-formance will give better results.
Sasaki, et al. (2006) also reported a sum-mary of the questionnaire regarding podded and hybrid CRP propulsion initiated and con-ducted by 25th ITTC Specialist Committees on Azimuthing Podded Propulsion. More than 40 organizations responded to the questionnaire. To the question “How do you perform self-propulsion test for a podded propulsor? 76% consider the entire pod unit as a propulsor, while the rest 24% consider the pod unit (hous-ing) as an appendage. Regarding the hybrid CRP podded propulsion, 67% responded that they use propeller open water boat for the for-ward propeller and podded propusor unit for the aft propeller. 17% perform open water test in a cavitation tunnel and the rest 16% use oth-er method.
Finally Sasaki, et al. (2006) reported the procedure for conducting open water and self-propulsion test with hybrid CRP propulsor units as adopted by NMRI. It was proposed to carry out open water test for the entire
propul-sion system (forward and aft propeller), the re-sults of which were analysed as system thrust and torque coefficients;
KTT = KTF + KTA + KTU Total thrust
coef-ficient
KTP = KTF + KTA Propeller thrust
coeffi-cient
KQ =KQF + KQA Torque coefficient
where:
KTF – forward propeller thrust coefficient
KTA – aft propeller thrust coefficient
KTU – pod unit thrust coefficient
KQF – forward propeller torque coefficient
KQA – aft propeller torque coefficient.
Using KTT identity, propeller revolutions,
(1-w) and ηR were defined based on hybrid
system curves behind hull and open water, and final performance prediction was accomplished.
A major problem for conducting and analys-ing open water test for hybrid propulsors is the flow non-uniformity in the propeller plane. To establish this, a series of open water tests was proposed by Sasaki, et al. (2006), including wake measurements in the propeller plane be-hind the propeller open water test boat. Fur-thermore, the wake tests were performed at three different speeds of advance, as well as three to four variable propeller revolutions. It was concluded that wake and wave originating from the forward propeller open water test boat could affect the mean velocity at the pod pro-pulsor disc.
Despite these efforts, there are still no wide-ly accepted standard test procedures and full-scale performance prediction methods currently available for these hybrid propulsors.
to-gether with computations using relevant CFD codes.
(ii) Bollard Pull Test A large number of
specialized ships, such as offshore supply ves-sels, cable laying vesves-sels, salvage and stand-by platform support vessels, escort and harbour tug boats, fishing trawlers, etc. are typically equipped with usually ducted thrusters. Their operational profile very often requires bol-lard/trawl mode of operation, characterized with zero or very low speed of advance. There-fore, an accurate prediction of bollard/trawl pull performance is of equal importance with the propulsive performance prediction at speed. Typically the bollard pull test is conducted as a part of the self-propulsion test, as the ship model, propulsion system, measuring equip-ment and instruequip-mentation are usually the same as those for the self-propulsion test. However, the bollard pull test can be distinguished from the ordinary self-propulsion test by a few major differences:
a) The bollard pull test is performed at variable propeller revolutions, covering a specified range of the engine power, typically from 50% to 100% MCR. This implies that the model propeller operates at different Rn, varying
propor-tionally to the required variation of en-gine power (torque).
b) The concepts of wake and relative rota-tive efficiency are no longer applicable in bollard pull condition, whereas the interaction with the hull is accounted for by the thrust deduction factor in the same manner as for the self-propulsion test. This also implies that propeller/or thrusters/pod unit open water character-istics are not necessarily required for the analysis.
c) At bollard pull condition, the propeller induces very high axial velocities and acts as an axial pump. The flow through propeller disc is accelerated and creates
a current in the towing tank, depending on the tank’s dimensions and the longi-tudinal position of the ship model rela-tive to the tank length.
d) At some conditions with very high loading, the propeller blades may start to ventilate due to air suctions from free surface. This will significantly affect thrust and torque measurements. Fur-thermore, possible propeller cavitation and its influence on bollard pull per-formance cannot be modelled in a stan-dard atmospheric pressure tank.
The bollard pull testing procedure needs to be addressed separately (or as a specific part of the self-propulsion test procedure), with special emphasis on the peculiarities outlined in items a) – d) above.
A series of performance and wake meas-urement tests were carried out in the Institute for Ocean Technology (IOT) towing tank in Canada and INSEAN large cavitation tunnel in Italy (Lababidy, et al., 2006). In the perform-ance tests, both the propeller and the duct thrust were measured at propeller geometric pitch ra-tio of 1.2 and at different propeller revolura-tions (15, 20 and 30 rps.). In the wake measurements, the flow characteristics were investigated using a stereo PIV system for the dynamic position-ing (DP) thruster model wake at planes close to the thruster (X/D=0.3 and 0.5) when operating with and without a nozzle at bollard pull (J=0) and near bollard pull (J=0.4 and 0.45). The measurements provide insight about the per-formance and wake characteristics of the DP thruster under various operating conditions in-cluding the bollard pull. Some details of flow measurements are presented in Section 7.4.
Propulsion efficiencies, both for free sailing ahead and for bollard pull (merit coefficient), are characterized by the propulsor open water characteristics. Different propulsors have dif-ferent characteristics, distinguished by the slope of KT and KQ curves. In an elaborate
(2004) showed that while open and CRP pro-pellers are characterized by almost constant KT
and KQ slopes over the entire J range, the
ducted propeller thrust and torque curves showed different characteristics, especially near the bollard pull conditions, where the thrust curve becomes steep, while the torque curve becomes flat. This indicates that the thrust at bollard condition is sensitive to un-derwater current/vessel speed and propeller rate of turn, while the propeller torque is quite in-sensitive.
Hoekstra (2006) and Zondervan, et al. (2006) presented a RANS-based analysis tool for ducted propeller systems in open water condi-tion including bollard pull. The propeller mod-el was represented as an actuator disc, while the duct maintained its true shape. Systematic numerical simulations at various Reynolds numbers indicated that the scale effect on the duct thrust was modest except for Rn below
5x10⁴, where the scale effect became rather severe. It was found that the scale effect on duct thrust was primarily due to changes in the lift force on the duct, and less for the drag force. It was concluded that no indications have as yet been found that open water model tests could be misleading in evaluating the performance of a ducted propeller system, provided they are carried out at duct Reynolds number (based on duct chord) above 5x10⁴.
3.2.4 Recommendations: The above
ex-amples illustrate and highlight some of the po-tential problems associated with bollard pull testing and full-scale bollard predictions. Therefore, it is recommended that the self-propulsion testing procedure be further ex-tended to include the bollard pull testing for open, CRP and ducted propeller systems.
3.3 7.5-02-03-02.1: Propeller Open Water Test
3.3.1 Overview. The survey carried out by
24th ITTC Propulsion Committee on the open water test procedure also showed that the
ma-jority of the participants indicated that there was no need to update the existing procedure. In response to a question related to open water test at two Reynolds numbers recommended by the ITTC, 6 (32%) answered that they perform open water experiments at only one Reynolds number that is higher than 0.5 million. In re-sponse to the question about Uncertainty Anal-ysis recommended by the ITTC for propulsion and open water tests, the majority (18 out of 19) responded that they do not perform an uncer-tainty analysis as recommended by the ITTC. Six responded that they do uncertainty analysis according to their own procedures that are sim-pler than recommended by the ITTC.
On revisiting the procedure it was decided that the open water testing in a cavitation tun-nel be added to the current procedure together with some editorial changes.
3.3.2 Open Water Testing in Cavitation
Tunnel The current procedure is written only
for towing tank applications in mind. However, open water tests can also be carried out in the cavitation tunnel if the institution does not have a towing tank facility. The procedure should, therefore, be extended to cavitation tunnel ap-plications. However, the open water test re-sults in the cavitation tunnel should be ana-lyzed carefully by properly accounting for the tunnel blockage effects.
water tests should be carried out under atmos-pheric condition and significant blade cavita-tion should be avoided.
Figure 3.5 Typical model propeller geometry with a nose cap for open water testing (Figure 1 of the document, 7.5-02-03-02.1).
3.3.3 Editorial Changes. In Section 1
Pur-pose of Procedure, a sentence is included in the third paragraph as; “Podded propulsor open water test procedure is described in the docu-ment, 7.5-02-03-01.3 Podded Propulsor Tests and Extrapolation.”
In Section 2.1 Data Reduction Equations, the definition of KTP is changed from “Thrust Coefficient” in ducted propeller case is cor-rected as “Ducted Propeller Thrust Coefficient”. The Reynolds Number definition was incorrect. The correct definition is:
Rn = c0.7R(VA2 + (0.7πnD)2)½/ν. (3.1) The section number for Conventional Pro-pellers was incorrect. It should be 3.1.2.1 in-stead of 3.4.1.1.
The Section 3.1.2.1, Conventional Propel-lers is divided into two subsections: 3.1.2.1.1 Towing Tank and 3.1.2.1.2 Cavitation Tunnel. A sentence is added to the end of the first para-graph. “In some cases the nose length may be less than 1.5 D as long as the flow is parallel” is added to the end of the first paragraph. The last sentence at the end of third paragraph is modified as “A typical set up for a towing tank is shown in Fig. 2.”. The captions for Figures 2 and 3 are changed as: “Typical Set Up for Tests
on Conventional Propellers in a Towing Tank” and “Typical Set Up for Tests on Ducted Pro-pellers in a Towing Tank”, respectively.
In Section 3.1.2.1, a new subsection “Cavi-tation Tunnel” and its content are added for the installation of propeller models to carry out open water tests in cavitation tunnels.
In the last sentence of the second paragraph in Section 3.1.2.2 Ducted Propellers is modi-fied as, “A typical set up for a towing tank is shown in Fig. 3.” “Set-up for a cavitation tun-nel is similar to the towing tank set-up” is add-ed.
In Section 3.3.4 Rate of Revolution, the pa-ragraph starting with “The measurement in-strumentation …” are written twice and one should be removed.
In Section 3.3.5 Speed, the paragraph is modified as; “The speed of the propeller model should be measured to within 0.1% of the max-imum carriage speed or within 3 mm/sec, whi-chever is the larger for towing tanks. In the ca-vitation tunnel the speed should be measured within 1% of the maximum tunnel speed.”
In Section 3.4.5 Speed, the paragraph is modified as; “The calibration of the carriage or tunnel speed will depend mainly on how the speed is measured in each facility. The carriage and tunnel speed should be checked regularly and respective records should be stored.”
In Section 3.5 Test Procedure and Data Ac-quisition, the last paragraph is modified as “The propeller open water tests should be con-ducted at least at two Reynolds Numbers; one should be at the Reynolds Number used for the evaluation of the propulsion test, which should be higher than 2x10⁵ and the other should be as high as possible.”
exam-ple, based on the work of Wood and Harris (1920). It should be noted that the key point is that an appropriate tunnel blockage correction is applied, notwithstanding the longevity of the quoted reference.
In Section 3.7 Documentation, the second bullet is modified as; “Particulars of the towing tank or cavitation tunnel, including length, breadth and water depth for towing tank, or test section length, breadth and height for cavitation tunnel”.
3.4 7.5-02-03-02.3: Guide for Use of LDV
Since the membership of the 25th Propul-sion Committee did not have sufficient exper-tise in LDV to review the current LDV guid-ance, it was decided that the Committee would review major LDV papers recently published. As LDV is widely used in the cavitation tunnel and the towing tank for flow measurements around propellers and ship hulls. It is evident that there is an increased use of Particle Image Velocimetry (PIV) and this literature is in-cluded.
3.4.1 Recent Development: Michael and
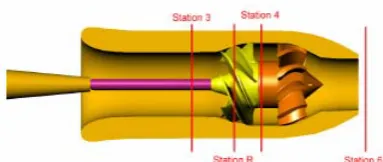
Chesnakas (2004) presented comprehensive LDV measurements of flow around a mixed-flow waterjet pump model (see Figure 3.6). The unit was placed inside a pod and in the open jet of the 36-inch water tunnel of DTMB. Windows in the pod allowed optical access for LDV measurements to be obtained at four sta-tions: in the inlet section, in between the rotor blades, in between the rotor and stator, and at the nozzle exit. The windows were curved to match the inside profile of the pump, thus mi-nimizing the flow disturbance. The thin, 0.76mm, windows ensured that the laser-beams would pass through the curved windows with minimal optical distortion. At the station be-tween the rotor and the stator, the LDV system consisted of two optical probes to measure three components of velocity, i.e. the vertical, axial and cross-stream horizontal component. The measurements revealed some interesting
[image:25.595.329.521.199.280.2]details of the pump flow. Blade wakes are clearly visible. A vortex can be seen close to the tip on the pressure side of the blade. The leakage vortex is formed by flow on the pres-sure side of the blade crossing through the tip gap to the suction side of the blade.
Figure 3.6 LDV measurement stations (Mi-chael and Chesnakas, 2004).
Abdel-Maksoud, et al. (2004) investigated the influence of hub cap shape on propeller ef-ficiency and cavitation inception. They carried out LDV measurements to analyze the differ-ence in velocity field with different hub cap shapes. The measured results were used for CFD validation.
Felli, et al. (2006) measured the evolution of the propeller-rudder wake flow using LDV at different downstream locations. Figure 3.7 shows the measured axial velocity distribution downstream of the propeller at two longitudinal locations, ahead and behind the rudder. The effect of the rudder can be recognized by the defect of the axial velocity in both the upstream and downstream planes. The upstream deficit is caused by the flow blockage of the rudder that induces locally a slowdown of the slip-stream, according to the authors and noted by Molland and Turnock (2007).