O R I G I N A L A R T I C L E : E P I D E M I O L O G Y ,
C L I N I C A L P R A C T I C E A N D H E A L T H
Relationship between fear of falling and mobility varies with
visual function among older adults
Orna A Donoghue,1 Harriet Ryan,3 Eoin Duggan,4Ciaran Finucane,1 George M Savva,1Hilary Cronin,1 James Loughman5,6and Rose Anne Kenny1,2
1The Irish Longitudinal Study on Ageing,2Trinity College Institute of Neuroscience, Trinity College Dublin,3School of Medicine, Royal
College of Surgeons in Ireland,4School of Medicine and Medical Sciences, University College Dublin,5Department of Optometry, School of Physics, Dublin Institute of Technology, Dublin, Ireland; and6African Vision Research Institute, Faculty of Sciences and Health, University of KwaZulu Natal, Durban, South Africa
Aim: The present study examined the association between vision, fear of falling and fear-related activity restriction, and assessed the effect of vision on the relationship between fear of falling and mobility, using data from a nationally representative sample of community-dwelling adults aged≥50 years.
Methods: Participants (n= 5003) completed an interview and health assessment (including Timed Up-and-Go, vision and cognitive tests). Visual acuity and contrast sensitivity were assessed using an Early Treatment Diabetic Retinopathy Study logMAR chart and Functional Vision Analyzer, respectively. Participants self-reported their vision as excellent, very good, good, fair or poor. They were assigned to no fear of falling, fear without activity restriction and fear with activity restriction groups. Logistic regression models examined the relationship between vision, fear of falling and activity restriction. Linear regression models were used to examine the main and interaction effects of fear of falling, self-reported vision, visual acuity, and contrast sensitivity on mobility after adjusting for confounders.
Results: Poorer self-reported vision was independently associated with fear of falling and fear-related activity restriction (P<0.05), but visual acuity and contrast sensitivity were not. Participants with the lowest visual acuity and contrast sensitivity levels, combined with fear-related activity restriction, had slower Timed Up-and-Go than those in the highest visual performance quartiles (P<0.05).
Conclusions: Participants’ perceptions of visual function were related to fear of falling and activity restriction, but this was not explained by other visual factors measured here. However, poorer visual acuity and contrast sensitivity did moderate the relationship between fear-related activity restriction and mobility, highlighting the importance of a comprehensive vision assessment especially in individuals with fear of falling.Geriatr Gerontol Int 2013; ••: ••–••.
Keywords:accidental falls, aged, contrast sensitivity, gait, locomotion.
Introduction
Fear of falling (FOF) has been defined as “a lasting concern about falling that leads to an individual avoid-ing activities that he/she remains capable of perform-ing”.1It affects up to 30% of community-dwelling older adults,2,3and occurs in those with and without a history
of falls. It is more common in females, and is indepen-dently associated with previous falls, depression, poor self-reported health, reduced social activity and impaired mobility.4–8 The consequences of fear-related activity restriction include a decline in physical and social function, which can increase the risk of mobility decline, falls and functional disability.9,10
Visual impairment can include deficits in visual acuity (VA), contrast sensitivity (CS), visual field (VF) and depth perception (DP). Lower VA, CS and VF have been associated with poorer mobility in community-dwelling adults,11–16whereas deficits in VA, CS, VF and DP have been associated with falls, especially recurrent falls.17–21
Accepted for publication 8 September 2013.
Correspondence: Dr Orna Donoghue PhD, The Irish Longitudinal Study on Ageing (TILDA), Lincoln Gate, Trinity College Dublin, Dublin 2, Ireland. Email: [email protected]
1bs_bs_query
2bs_bs_query
3bs_bs_query
4bs_bs_query
5bs_bs_query
6bs_bs_query
7bs_bs_query
8bs_bs_query
9bs_bs_query
10bs_bs_query
11bs_bs_query
12bs_bs_query
13bs_bs_query
14bs_bs_query
15bs_bs_query
16bs_bs_query
17bs_bs_query
18bs_bs_query
19bs_bs_query
20bs_bs_query
21bs_bs_query
22bs_bs_query
23bs_bs_query
24bs_bs_query
25bs_bs_query
26bs_bs_query
27bs_bs_query
28bs_bs_query
29bs_bs_query
30bs_bs_query
31bs_bs_query
32bs_bs_query
33bs_bs_query
34bs_bs_query
35bs_bs_query
36bs_bs_query
37bs_bs_query
38bs_bs_query
39bs_bs_query
40bs_bs_query
41bs_bs_query
42bs_bs_query
43bs_bs_query
44bs_bs_query
45bs_bs_query
46bs_bs_query
47bs_bs_query
48bs_bs_query
49bs_bs_query
50bs_bs_query
51bs_bs_query
52bs_bs_query
53bs_bs_query
54bs_bs_query
55bs_bs_query
56bs_bs_query
57bs_bs_query
58bs_bs_query
59bs_bs_query
60bs_bs_query
61bs_bs_query
62bs_bs_query
63bs_bs_query
JOBNAME: No Job Name PAGE: 2 SESS: 9 OUTPUT: Wed Oct 9 15:41:42 2013 SUM: 8F1EE895 /Xpp84/wiley_journal/GGI/ggi_v0_i0/ggi_12174
Estimates of the effect of vision on FOF and activity restriction have been mixed. No independent relation-ship between self-reported visual impairment and FOF or associated activity restriction was seen in community representative samples;22,23 however, moderate and severe self-reported visual impairments were indepen-dently associated with FOF-related activity restriction among community-dwelling older adults in receipt of home care services.24Deshpande et al. found that psy-chophysically measured visual function, specifically CS and VA, was not linked to FOF; however, reduced CS was associated with FOF-related activity restriction among those without depressive symptoms.25 Finally, longitudinal studies have shown that reduced VA pre-dicts the development of FOF18 and mobility impair-ment26after 5 years.
Currently, studies examining associations between FOF, vision and mobility are limited. Both FOF and poor vision have been associated with impaired mobil-ity, but it is unclear how visual impairment and FOF interact with respect to mobility impairment, and if so, which components of vision are most important. Understanding this would allow specific groups to be identified and targeted for assessment and intervention. Therefore, the aims of the present study were first, to examine the role of vision (self-reported vision, VA and CS) in FOF and FOF-related activity restriction, and second, to examine the influence of vision in the rela-tionship between FOF and mobility, using data from a nationally representative sample of community-dwelling adults aged 50 years and older.
Methods
Study design
The Irish Longitudinal Study on Aging (TILDA) is a prospective cohort study of the social, economic and health circumstances of community-dwelling older adults in Ireland. Analysis is based on the first wave of data, collected between October 2009 and July 2011. The sampling frame is the Irish Geodirectory, a listing of all residential addresses in the Republic of Ireland. A clustered sample of addresses was chosen, and house-hold residents aged ≥50 years and their spouses/ partners (of any age) were eligible to participate. Ethical approval was obtained from the Trinity College Dublin Research Ethics Committee, and participants provided written informed consent.
The study design is described elsewhere.27 Briefly, data collection included: (i) a computer-assisted per-sonal interview that included detailed questions on sociodemographics, wealth, health, lifestyle, social support and participation, use of health and social care, and attitudes to aging; (ii) a self-completion question-naire; and (iii) a detailed health assessment carried out
by research nurses including cognitive, cardiovascular, mobility, strength, bone and vision tests. In total, 8175 individuals aged ≥50 years were interviewed, of whom 5037 attended the health center assessment (61.3%). Inclusion criteria for this analysis was a Mini-Mental State Examination (MMSE) score ≥18, no history of Parkinson’s disease, Alzheimer’s disease or dementia, participation in a health center assessment, and comple-tion of the FOF and activity restriccomple-tion quescomple-tions in the interview (n= 5003).
Outcome measures
Demographics and health
Age, sex and highest level of education attained were recorded. Primary, secondary and tertiary education corresponded to ≤8, 9–13 and≥13 years of education, respectively. Height and weight were measured, and body mass index (BMI) was calculated. Participants self-reported doctor-diagnosed chronic conditions from the following: heart attack or heart failure or angina, stroke, diabetes, chronic lung disease, asthma, arthritis, osteo-porosis, cancer, peptic ulcer, hip fracture, hypertension and high cholesterol. The number of medications was also recorded. Depressive symptoms were assessed using the 20-item Center for Epidemiological Studies Depression (CES-D) scale, where a score of≥16 repre-sents clinically relevant depressive symptoms.28
Fear of falling and falls
Fear of falling was assessed with the question “Are you afraid of falling?”. Those that answered “Yes” were asked “Do you ever limit your activities, for example, what you do or where you go, because you are afraid of falling?”. It should be noted that this latter question might combine both physical and social activity limita-tions. Similar questions have been used in previous studies,3,23,29 and allowed participants to be classified into three groups: (i) no FOF; (ii) FOF, but no activity restrictions (FOF-NAR); and (iii) FOF with activity restrictions (FOF-AR). Participants were also asked how many times they had fallen in the previous year.
Cognitive function
Participants completed the MMSE,30 which assesses global cognition (maximum score 30). A letter fluency task (list as many words as possible beginning with “F” in 1 min) measured expressive language and executive function,31and a computer-based choice reaction time test measured processing speed.32 In this test, partici-pants depressed a button, released it in response to an on-screen stimulus and pressed the appropriate target button (this occurred approximately 100 times). The 1bs_bs_query
2bs_bs_query
3bs_bs_query
4bs_bs_query
5bs_bs_query
6bs_bs_query
7bs_bs_query
8bs_bs_query
9bs_bs_query
10bs_bs_query
11bs_bs_query
12bs_bs_query
13bs_bs_query
14bs_bs_query
15bs_bs_query
16bs_bs_query
17bs_bs_query
18bs_bs_query
19bs_bs_query
20bs_bs_query
21bs_bs_query
22bs_bs_query
23bs_bs_query
24bs_bs_query
25bs_bs_query
26bs_bs_query
27bs_bs_query
28bs_bs_query
29bs_bs_query
30bs_bs_query
31bs_bs_query
32bs_bs_query
33bs_bs_query
34bs_bs_query
35bs_bs_query
36bs_bs_query
37bs_bs_query
38bs_bs_query
39bs_bs_query
40bs_bs_query
41bs_bs_query
42bs_bs_query
43bs_bs_query
44bs_bs_query
45bs_bs_query
46bs_bs_query
47bs_bs_query
48bs_bs_query
49bs_bs_query
50bs_bs_query
51bs_bs_query
52bs_bs_query
53bs_bs_query
54bs_bs_query
55bs_bs_query
56bs_bs_query
57bs_bs_query
58bs_bs_query
59bs_bs_query
60bs_bs_query
61bs_bs_query
62bs_bs_query
63bs_bs_query
64bs_bs_query
65bs_bs_query
66bs_bs_query
67bs_bs_query
68bs_bs_query
69bs_bs_query
70bs_bs_query
71bs_bs_query
72bs_bs_query
73bs_bs_query
74bs_bs_query
75bs_bs_query
76bs_bs_query
77bs_bs_query
78bs_bs_query
79bs_bs_query
80bs_bs_query
81bs_bs_query
82bs_bs_query
83bs_bs_query
84bs_bs_query
85bs_bs_query
86bs_bs_query
87bs_bs_query
88bs_bs_query
89bs_bs_query
90bs_bs_query
91bs_bs_query
92bs_bs_query
93bs_bs_query
94bs_bs_query
95bs_bs_query
96bs_bs_query
97bs_bs_query
98bs_bs_query
99bs_bs_query
100bs_bs_query
101bs_bs_query
102bs_bs_query
103bs_bs_query
104bs_bs_query
105bs_bs_query
106bs_bs_query
107bs_bs_query
108bs_bs_query
mean time from appearance of the stimulus to pressing this button was the choice reaction time. Both verbal fluency and choice reaction time have been shown to be independent predictors of Timed Up-and-Go (TUG) performance.33
Physical function
Maximum grip strength was the highest score from two tests on each hand using a Baseline hydraulic hand dynamometer (Fabrication Enterprises, White Plains, NY, USA). Grip strength declines with age and indicates overall strength.34Mobility was assessed with the TUG test using a chair with armrests and seat height of 46 cm. Participants were asked to rise from the chair, walk 3 m at normal pace, turn around, walk back and sit down again.35 Walking aids were allowed, and no instructions were given about the use of participants’ arms. The time taken from the command “Go” to when the participant sat with their back resting against the back of the chair was recorded using a stopwatch.
Vision
Participants self-reported their vision as excellent, very good, good, fair or poor;36 one participant reported being registered blind and was added to the poor vision group. A history of cataracts and related surgery, glau-coma and age related macular degeneration (ARMD) was also recorded.
VA represents a high contrast letter recognition task, and was assessed using an Early Treatment Diabetic Retinopathy Study (ETDRS) logMAR chart (Precision Vision, La Salle, IL, USA) at a viewing distance of 4 m.37,38 VA was measured psychophysically for both eyes, using the habitual distance vision correction if required. For statistical purposes, the best acuity value measured from either eye was selected and converted to a Visual Acuity Score (VAS).38 This score inverts the logMAR scale using the formula: VAS = 100 – 50×logMAR, so that a VAS of 100 represents a logMAR score of 0 or 20/20 vision. For each letter that is read correctly using the ETDRS chart, there is a corresponding 1-point increase in the VAS. This allows a more intuitive interpretation of the acuity scores, as higher values indicate better acuity. The VAS was sub-sequently expressed in quartiles and deciles.
CS represents the ability to distinguish an object from the background in varying size and contrast conditions. It was measured in the eye with better VA using a Functional Vision Analyser (Stereo Optical, Chicago, IL, USA) under mesopic (3 cd/m2) background illumi-nation conditions. Testing was then repeated for the same background illumination conditions, but in the presence of a radial glare source.39During the test, the respondent viewed a Functional Acuity Contrast
Test (FACT), which comprised sinusoidal gratings pre-sented as Gabor patches at five spatial frequencies of 1.5, 3, 6, 12 and 18 cycles per degree (cpd) respectively. For each spatial frequency, a series of nine patches were presented in order of decreasing contrast (0.15 log unit or 50% loss of contrast between consecutive patches). Respondents were instructed to indicate if the gratings tilted to the left (+15°), right (−15°) or upright (0°), moving from patch 1 to 9 for each spatial frequency tested, in order of increasing frequency. The CS score corresponds to the contrast of the last grating that was accurately identified on each row.
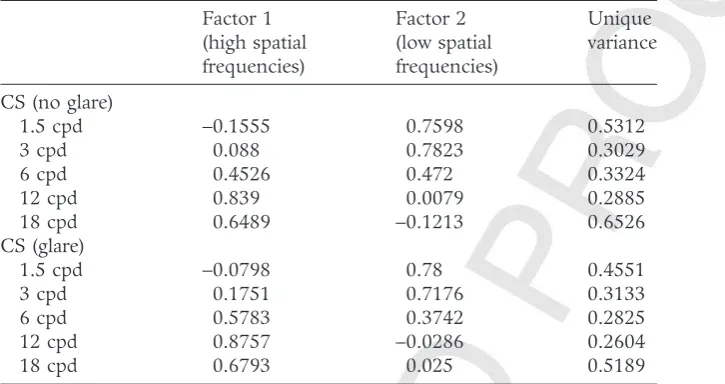
Factor analysis was used to reduce the dimension of the 10 CS scores (each of five frequencies in two glare conditions). As the CS variables are based on ordinal scores, factor analysis using a polychoric correlation matrix was carried out. Two factors were identified and retained based on their eigenvalues and amount of vari-ance explained (69.2% in total). Oblique rotation using the direct oblimin criterion suggested two factors cor-responding to the contrast sensitivity at high spatial frequencies (6, 12, 18 cpd) and low spatial frequencies (1.5, 3, 6 cpd). CS at the middle spatial frequency (6 cpd) loaded onto both factors (Table 1). No factor separated the glare from the “no glare” condition. Two factor scores were derived for each individual corre-sponding to their “high frequency” and “low frequency” CS. Each factor score was divided into quartiles and deciles for use as independent variables in regression analyses.
Statistical analysis
Statistical tests were carried out using Stata v12 (StataCorp LP, College Station, TX, USA). All analyses were weighted with respect to age, sex and education to the Quarterly National Household Survey (2010) to ensure that data were nationally representative. Data were further weighted by health status (self-reported health, disability status) and sociodemographic factors (age, education) to account for those who did not attend a health assessment. Baseline characteristics of each group were compared using regression analysis and χ2-tests.
Logistic regression analysis was used to examine the relationship of vision with FOF and FOF-related activity restriction. VA, CS factors 1 and 2 (all expressed as deciles), and self-reported vision were entered into sepa-rate models, which also included the effects of age, sex and education.
Linear regression was then used to examine the asso-ciations between FOF groups and TUG before and after adjusting for age, sex, education, BMI, chronic condi-tions, medicacondi-tions, history of falls in the previous year, CES-D score, letter fluency, choice reaction time, maximum grip strength and doctor-diagnosed cataracts 1bs_bs_query
2bs_bs_query
3bs_bs_query
4bs_bs_query
5bs_bs_query
6bs_bs_query
7bs_bs_query
8bs_bs_query
9bs_bs_query
10bs_bs_query
11bs_bs_query
12bs_bs_query
13bs_bs_query
14bs_bs_query
15bs_bs_query
16bs_bs_query
17bs_bs_query
18bs_bs_query
19bs_bs_query
20bs_bs_query
21bs_bs_query
22bs_bs_query
23bs_bs_query
24bs_bs_query
25bs_bs_query
26bs_bs_query
27bs_bs_query
28bs_bs_query
29bs_bs_query
30bs_bs_query
31bs_bs_query
32bs_bs_query
33bs_bs_query
34bs_bs_query
35bs_bs_query
36bs_bs_query
37bs_bs_query
38bs_bs_query
39bs_bs_query
40bs_bs_query
41bs_bs_query
42bs_bs_query
43bs_bs_query
44bs_bs_query
45bs_bs_query
46bs_bs_query
47bs_bs_query
48bs_bs_query
49bs_bs_query
50bs_bs_query
51bs_bs_query
52bs_bs_query
53bs_bs_query
54bs_bs_query
55bs_bs_query
56bs_bs_query
57bs_bs_query
58bs_bs_query
59bs_bs_query
60bs_bs_query
61bs_bs_query
62bs_bs_query
63bs_bs_query
64bs_bs_query
65bs_bs_query
66bs_bs_query
67bs_bs_query
68bs_bs_query
69bs_bs_query
70bs_bs_query
71bs_bs_query
72bs_bs_query
73bs_bs_query
74bs_bs_query
75bs_bs_query
76bs_bs_query
77bs_bs_query
78bs_bs_query
79bs_bs_query
80bs_bs_query
81bs_bs_query
82bs_bs_query
83bs_bs_query
84bs_bs_query
85bs_bs_query
86bs_bs_query
87bs_bs_query
88bs_bs_query
89bs_bs_query
90bs_bs_query
91bs_bs_query
92bs_bs_query
93bs_bs_query
94bs_bs_query
95bs_bs_query
96bs_bs_query
97bs_bs_query
98bs_bs_query
99bs_bs_query
100bs_bs_query
101bs_bs_query
102bs_bs_query
103bs_bs_query
104bs_bs_query
105bs_bs_query
106bs_bs_query
107bs_bs_query
108bs_bs_query
JOBNAME: No Job Name PAGE: 4 SESS: 9 OUTPUT: Wed Oct 9 15:41:42 2013 SUM: 96757A6C /Xpp84/wiley_journal/GGI/ggi_v0_i0/ggi_12174
(treated or untreated), glaucoma and ARMD. TUG was not normally distributed and was therefore log trans-formed for analysis.
Next, the visual variables (self-reported vision and quartiles of VA, high and low frequency CS) were added to the regression models separately and simultaneously to assess the independent effect of each aspect of visual function on mobility, and to explore whether visual impairment mediated any of the relationship between FOF and mobility.
Finally, moderation effects were examined by adding interaction terms between FOF and each vision variable to the regression models. Marginal mean TUG times from these models were plotted to graphically explore these interactions after adjusting for all covariates.
Complete data was available for 4498 participants (89.9%), and complete case analysis was used for mul-tivariate analyses. Significance level was set atP<0.05.
Results
Baseline characteristics of the no FOF (n= 3974), FOF-NAR (n= 727) and FOF-AR (n= 302) groups are pro-vided in Table 2. Both FOF groups had more participants aged ≥75 years, were more likely to be female, have greater comorbidities and poorer physical health, mental health, cognitive function, and visual function than the no FOF group (P<0.001). Most pro-nounced differences were observed in the FOF-AR group.
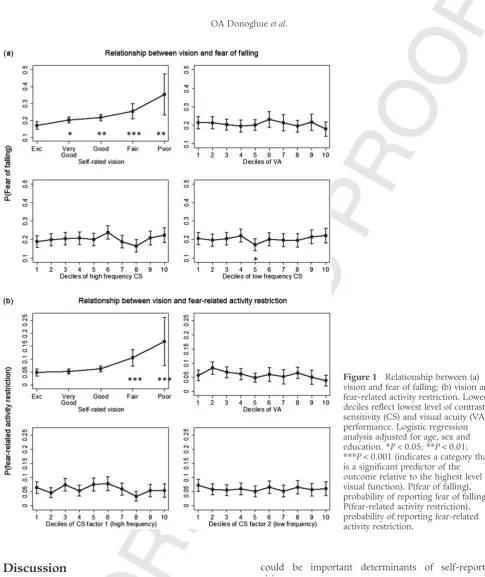
Psychophysical measures of vision (deciles of VA and CS) were not associated with FOF after adjusting for
age, sex and education (P>0.05; Fig. 1). However, there was a statistically significant worsening of FOF with poorer self-reported vision. This was particularly marked among those who rated their vision as “fair” or “poor” (P<0.05). An identical relationship was observed for FOF-related activity restriction.
Both FOF groups had slower TUG times than the no FOF group in univariate and multivariate analysis (P<0.001; models 1 and 2, Table 3). The exponent of additive coefficients for log(TUG) can be interpreted as multiplicative coefficients for TUG, and so the coeffi-cients in Table 3 correspond to those in the FOF-NAR group completing TUG 3.8% more slowly than those without FOF, whereas those with FOF-related activity restriction completed TUG 13.7% more slowly.
Poorer self-reported vision was independently associ-ated with slower TUG after adjusting for all covariates (P<0.05), whereas VA and CS had no independent effect on TUG performance (results not shown). Similar effects were observed when all psychophysical and self-reported vision variables were entered simultaneously (model 3, Table 3). However, adjusting for these vision variables had little effect on the FOF coefficients, and therefore did not explain the relationship between FOF, activity restriction and mobility.
[image:4.667.169.532.121.313.2]Interaction effects for FOF with VA, high frequency and low frequency CS were statistically significant in the FOF-AR group (P<0.001), but interaction effects with self-reported vision were not (Fig. 2). Specifically, mar-ginal interaction plots adjusting for covariates show that individuals with FOF-related activity restriction who were in the lowest quartile of VA and CS had slower TUG than those in the highest quartiles (P<0.05).
Table 1 Rotated factor loadings and unique variance for each contrast sensitivity variable
Factor 1 (high spatial frequencies)
Factor 2 (low spatial frequencies)
Unique variance
CS (no glare)
1.5 cpd −0.1555 0.7598 0.5312
3 cpd 0.088 0.7823 0.3029
6 cpd 0.4526 0.472 0.3324
12 cpd 0.839 0.0079 0.2885
18 cpd 0.6489 −0.1213 0.6526
CS (glare)
1.5 cpd −0.0798 0.78 0.4551
3 cpd 0.1751 0.7176 0.3133
6 cpd 0.5783 0.3742 0.2825
12 cpd 0.8757 −0.0286 0.2604
18 cpd 0.6793 0.025 0.5189
High loadings (≥0.3) are shown in bold. cpd, cycles per degree; CS, contrast sensitivity.
1bs_bs_query
2bs_bs_query
3bs_bs_query
4bs_bs_query
5bs_bs_query
6bs_bs_query
7bs_bs_query
8bs_bs_query
9bs_bs_query
10bs_bs_query
11bs_bs_query
12bs_bs_query
13bs_bs_query
14bs_bs_query
15bs_bs_query
16bs_bs_query
17bs_bs_query
18bs_bs_query
19bs_bs_query
20bs_bs_query
21bs_bs_query
22bs_bs_query
23bs_bs_query
24bs_bs_query
25bs_bs_query
26bs_bs_query
27bs_bs_query
28bs_bs_query
29bs_bs_query
30bs_bs_query
31bs_bs_query
32bs_bs_query
33bs_bs_query
34bs_bs_query
35bs_bs_query
36bs_bs_query
37bs_bs_query
38bs_bs_query
39bs_bs_query
40bs_bs_query
41bs_bs_query
42bs_bs_query
43bs_bs_query
44bs_bs_query
45bs_bs_query
46bs_bs_query
47bs_bs_query
48bs_bs_query
49bs_bs_query
50bs_bs_query
51bs_bs_query
52bs_bs_query
53bs_bs_query
54bs_bs_query
55bs_bs_query
56bs_bs_query
57bs_bs_query
58bs_bs_query
59bs_bs_query
60bs_bs_query
61bs_bs_query
62bs_bs_query
63bs_bs_query
64bs_bs_query
65bs_bs_query
66bs_bs_query
67bs_bs_query
68bs_bs_query
69bs_bs_query
70bs_bs_query
71bs_bs_query
72bs_bs_query
73bs_bs_query
74bs_bs_query
75bs_bs_query
76bs_bs_query
77bs_bs_query
78bs_bs_query
79bs_bs_query
80bs_bs_query
81bs_bs_query
82bs_bs_query
83bs_bs_query
84bs_bs_query
85bs_bs_query
86bs_bs_query
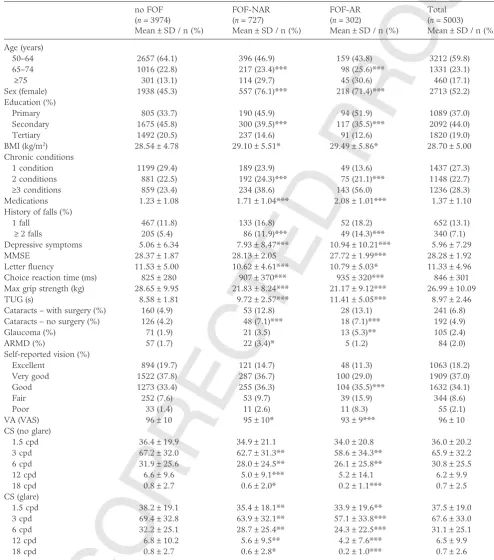
Table 2 Baseline characteristics of no fear of falling, fear of falling with activity restriction and fear of falling with no activity restriction groups
no FOF (n= 3974) Mean±SD / n (%)
FOF-NAR (n= 727)
Mean±SD / n (%)
FOF-AR (n= 302)
Mean±SD / n (%)
Total (n= 5003) Mean±SD / n (%)
Age (years)
50–64 2657 (64.1) 396 (46.9) 159 (43.8) 3212 (59.8)
65–74 1016 (22.8) 217 (23.4)*** 98 (25.6)*** 1331 (23.1)
≥75 301 (13.1) 114 (29.7) 45 (30.6) 460 (17.1)
Sex (female) 1938 (45.3) 557 (76.1)*** 218 (71.4)*** 2713 (52.2) Education (%)
Primary 805 (33.7) 190 (45.9) 94 (51.9) 1089 (37.0)
Secondary 1675 (45.8) 300 (39.5)*** 117 (35.5)*** 2092 (44.0)
Tertiary 1492 (20.5) 237 (14.6) 91 (12.6) 1820 (19.0)
BMI (kg/m2) 28.54±4.78 29.10±5.51* 29.49±5.86* 28.70±5.00
Chronic conditions
1 condition 1199 (29.4) 189 (23.9) 49 (13.6) 1437 (27.3)
2 conditions 881 (22.5) 192 (24.3)*** 75 (21.1)*** 1148 (22.7)
≥3 conditions 859 (23.4) 234 (38.6) 143 (56.0) 1236 (28.3) Medications 1.23±1.08 1.71±1.04*** 2.08±1.01*** 1.37±1.10 History of falls (%)
1 fall 467 (11.8) 133 (16.8) 52 (18.2) 652 (13.1)
≥2 falls 205 (5.4) 86 (11.9)*** 49 (14.3)*** 340 (7.1)
Depressive symptoms 5.06±6.34 7.93±8.47*** 10.94±10.21*** 5.96±7.29
MMSE 28.37±1.87 28.13±2.05 27.72±1.99*** 28.28±1.92
Letter fluency 11.53±5.00 10.62±4.61*** 10.79±5.03* 11.33±4.96 Choice reaction time (ms) 825±280 907±370*** 935±320*** 846±301 Max grip strength (kg) 28.65±9.95 21.83±8.24*** 21.17±9.12*** 26.99±10.09 TUG (s) 8.58±1.81 9.72±2.57*** 11.41±5.05*** 8.97±2.46 Cataracts – with surgery (%) 160 (4.9) 53 (12.8) 28 (13.1) 241 (6.8) Cataracts – no surgery (%) 126 (4.2) 48 (7.1)*** 18 (7.1)*** 192 (4.9)
Glaucoma (%) 71 (1.9) 21 (3.5) 13 (5.3)** 105 (2.4)
ARMD (%) 57 (1.7) 22 (3.4)* 5 (1.2) 84 (2.0)
Self-reported vision (%)
Excellent 894 (19.7) 121 (14.7) 48 (11.3) 1063 (18.2)
Very good 1522 (37.8) 287 (36.7) 100 (29.0) 1909 (37.0)
Good 1273 (33.4) 255 (36.3) 104 (35.5)*** 1632 (34.1)
Fair 252 (7.6) 53 (9.7) 39 (15.9) 344 (8.6)
Poor 33 (1.4) 11 (2.6) 11 (8.3) 55 (2.1)
VA (VAS) 96±10 95±10* 93±9*** 96±10
CS (no glare)
1.5 cpd 36.4±19.9 34.9±21.1 34.0±20.8 36.0±20.2
3 cpd 67.2±32.0 62.7±31.3** 58.6±34.3** 65.9±32.2
6 cpd 31.9±25.6 28.0±24.5** 26.1±25.8** 30.8±25.5
12 cpd 6.6±9.6 5.0±9.1*** 5.2±14.1 6.2±9.9
18 cpd 0.8±2.7 0.6±2.0* 0.2±1.1*** 0.7±2.5
CS (glare)
1.5 cpd 38.2±19.1 35.4±18.1** 33.9±19.6** 37.5±19.0
3 cpd 69.4±32.8 63.9±32.1** 57.1±33.8*** 67.6±33.0
6 cpd 32.2±25.1 28.7±25.4** 24.3±22.5*** 31.1±25.1
12 cpd 6.8±10.2 5.6±9.5** 4.2±7.6*** 6.5±9.9
18 cpd 0.8±2.7 0.6±2.8* 0.2±1.0*** 0.7±2.6
*P<0.05;**P<0.01;***P<0.001. Prevalence is weighted by age, sex and education to the Quarterly National Household Survey (2010) to ensure that data were nationally representative and further weighted by health status and sociodemographic factors to account for those who did not attend a health assessment. Regression analysis for continuous variables; chi squared analysis for categorical variables. No fear of falling (FOF) group was compared to the fear of falling with no activity restriction (FOF-NAR) group and the fear of falling with activity restriction (FOF-AR) group. ARMD, age-related macular degeneration; BMI, body mass index; cpd, cycles per degree; CS, contrast sensitivity; FOF, fear of falling; MMSE, Mini-Mental State Examination; SD, standard deviation; TUG, Timed Up-and-Go; VA, visual acuity; VAS, visual acuity scale.
1bs_bs_query
2bs_bs_query
3bs_bs_query
4bs_bs_query
5bs_bs_query
6bs_bs_query
7bs_bs_query
8bs_bs_query
9bs_bs_query
10bs_bs_query
11bs_bs_query
12bs_bs_query
13bs_bs_query
14bs_bs_query
15bs_bs_query
16bs_bs_query
17bs_bs_query
18bs_bs_query
19bs_bs_query
20bs_bs_query
21bs_bs_query
22bs_bs_query
23bs_bs_query
24bs_bs_query
25bs_bs_query
26bs_bs_query
27bs_bs_query
28bs_bs_query
29bs_bs_query
30bs_bs_query
31bs_bs_query
32bs_bs_query
33bs_bs_query
34bs_bs_query
35bs_bs_query
36bs_bs_query
37bs_bs_query
38bs_bs_query
39bs_bs_query
40bs_bs_query
41bs_bs_query
42bs_bs_query
43bs_bs_query
44bs_bs_query
45bs_bs_query
46bs_bs_query
47bs_bs_query
48bs_bs_query
49bs_bs_query
50bs_bs_query
51bs_bs_query
52bs_bs_query
53bs_bs_query
54bs_bs_query
55bs_bs_query
56bs_bs_query
57bs_bs_query
58bs_bs_query
JOBNAME: No Job Name PAGE: 6 SESS: 9 OUTPUT: Wed Oct 9 15:41:42 2013 SUM: 49611B0B /Xpp84/wiley_journal/GGI/ggi_v0_i0/ggi_12174
Discussion
The findings of the current study show that poorer self-reported vision was independently associated with FOF and FOF-related activity restriction, but that psy-chophysically measured vision (VA, CS) was not. FOF and self-reported vision were also linked to mobility impairment, but mesopic and photopic vision did not explain much of the relationship between FOF and mobility. These findings show that although partici-pants’ perceptions of visual function are related to FOF and activity restriction, other visual (e.g. DP, VF, eye disease) or non-visual factors (e.g. cognitive processing)
could be important determinants of self-reported vision.
[image:6.667.84.570.45.623.2]However, reduced psychophysical visual function was associated with slower TUG in the FOF-related activity restriction group, illustrating the moderating effect of psychophysical vision on the relationship between FOF and mobility. FOF is associated with poorer function across multiple domains (physical, psychological, cog-nitive), and this is more pronounced in those with activity restriction. It is possible that reduced vision compounds the existing deficits in this group, resulting in greater mobility impairment. Viljainenet al. reported that when multiple self-reported sensory deficits
Figure 1 Relationship between (a)
vision and fear of falling; (b) vision and fear-related activity restriction. Lowest deciles reflect lowest level of contrast sensitivity (CS) and visual acuity (VA) performance. Logistic regression analysis adjusted for age, sex and education. *P<0.05; **P<0.01; ***P<0.001 (indicates a category that is a significant predictor of the outcome relative to the highest level of visual function). P(fear of falling), probability of reporting fear of falling; P(fear-related activity restriction), probability of reporting fear-related activity restriction.
1bs_bs_query
2bs_bs_query
3bs_bs_query
4bs_bs_query
5bs_bs_query
6bs_bs_query
7bs_bs_query
8bs_bs_query
9bs_bs_query
10bs_bs_query
11bs_bs_query
12bs_bs_query
13bs_bs_query
14bs_bs_query
15bs_bs_query
16bs_bs_query
17bs_bs_query
18bs_bs_query
19bs_bs_query
20bs_bs_query
21bs_bs_query
22bs_bs_query
23bs_bs_query
24bs_bs_query
25bs_bs_query
26bs_bs_query
27bs_bs_query
28bs_bs_query
29bs_bs_query
30bs_bs_query
31bs_bs_query
32bs_bs_query
33bs_bs_query
34bs_bs_query
35bs_bs_query
36bs_bs_query
37bs_bs_query
38bs_bs_query
39bs_bs_query
40bs_bs_query
41bs_bs_query
42bs_bs_query
43bs_bs_query
combined with FOF, there is an increased risk of devel-oping walking difficulties.40
The ability to maintain dynamic postural stability requires an interaction between the sensory and motor systems. TUG involves transfers, turning and walking, and therefore requires muscle strength and balance; therefore, it was speculated that vision might play a more important role in this task compared with straight line walking. In challenging balance situations, an individual relies on the visual system, particularly CS and DP, to gain information about body positions, movements and the environment to maintain stability.41CS might also reflect the ability to detect and recognise objects in the environment, and see ground level obstacles more accu-rately.42Visual functions, such as VA and CS, decrease with age43,44as do cognitive processes such as executive function, processing speed and visual attention.45,46 Similar cognitive deficits have been observed in recurrent fallers, and could reflect a difficulty in coordination of the
visual, cognitive and motor aspects required to negotiate the everyday environment.47 If an individual with reduced vision, especially CS, does not detect all of the environmental and body position information available, this might predispose them to cautious gait and/or a greater risk of falling. If a vision deficit is combined with FOF or other age-related factors, such as increased risk of osteoporosis, low muscle tone, poorer muscle strength, slow reaction times and postural instability, the risk of mobility impairment, falls and injury could be amplified even further.
[image:7.667.89.581.121.445.2]Owsley et al. found that age and CS at 6 cpd were the best predictors of the ability to detect and identify real-world targets, such as faces, signs and objects.48 Although the present results suggest that CS at both high and low frequencies are important for mobility, we are unaware of any research that has identified which spatial frequencies relate most closely to specific envi-ronmental objects that might affect mobility.
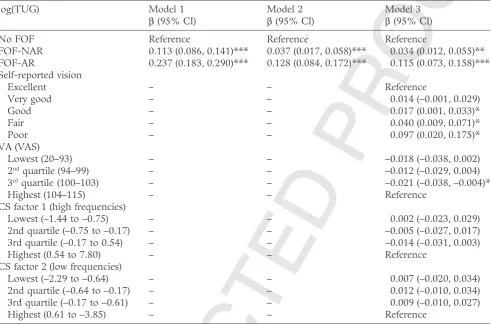
Table 3 Univariate and multivariate linear regression showing relationship between fear of falling, vision and log(Timed Up-and-Go) after adjusting for covariates
log(TUG) Model 1
β(95% CI)
Model 2 β(95% CI)
Model 3 β(95% CI)
No FOF Reference Reference Reference
FOF-NAR 0.113 (0.086, 0.141)*** 0.037 (0.017, 0.058)*** 0.034 (0.012, 0.055)**
FOF-AR 0.237 (0.183, 0.290)*** 0.128 (0.084, 0.172)*** 0.115 (0.073, 0.158)***
Self-reported vision
Excellent – – Reference
Very good – – 0.014 (−0.001, 0.029)
Good – – 0.017 (0.001, 0.033)*
Fair – – 0.040 (0.009, 0.071)*
Poor – – 0.097 (0.020, 0.175)*
VA (VAS)
Lowest (20–93) – – −0.018 (−0.038, 0.002)
2ndquartile (94–99) – – −0.012 (−0.029, 0.004)
3rdquartile (100–103) – – −0.021 (−0.038,−0.004)*
Highest (104–115) – – Reference
CS factor 1 (high frequencies)
Lowest (−1.44 to−0.75) – – 0.002 (−0.023, 0.029)
2nd quartile (−0.75 to−0.17) – – −0.005 (−0.027, 0.017)
3rd quartile (−0.17 to 0.54) – – −0.014 (−0.031, 0.003)
Highest (0.54 to 7.80) – – Reference
CS factor 2 (low frequencies)
Lowest (−2.29 to−0.64) – – 0.007 (−0.020, 0.034)
2nd quartile (−0.64 to−0.17) – – 0.012 (−0.010, 0.034)
3rd quartile (−0.17 to−0.61) – – 0.009 (−0.010, 0.027)
Highest (0.61 to−3.85) – – Reference
*P<0.05; **P<0.01; ***P<0.001. Model 1: Unadjusted linear regression. Model 2: Linear regression adjusted for age, sex, body mass index, education, medications, chronic conditions, history of falls, depressive symptoms, choice reaction time, word fluency, maximum grip strength, history of cataracts (treated or untreated), glaucoma, age related macular degeneration. Model 3: all vision variables entered simultaneously and adjusted as for Model 1.β, coefficient; CI, confidence intervals; cpd, cycles per degree; CS, contrast sensitivity; FOF, fear of falling; FOF-AR, fear of falling with activity restriction; FOF-NAR, fear of falling with no activity restriction; TUG, Timed Up-and-Go; VA, visual acuity; VAS, visual acuity scale.
1bs_bs_query
2bs_bs_query
3bs_bs_query
4bs_bs_query
5bs_bs_query
6bs_bs_query
7bs_bs_query
8bs_bs_query
9bs_bs_query
10bs_bs_query
11bs_bs_query
12bs_bs_query
13bs_bs_query
14bs_bs_query
15bs_bs_query
16bs_bs_query
17bs_bs_query
18bs_bs_query
19bs_bs_query
20bs_bs_query
21bs_bs_query
22bs_bs_query
23bs_bs_query
24bs_bs_query
25bs_bs_query
26bs_bs_query
27bs_bs_query
28bs_bs_query
29bs_bs_query
30bs_bs_query
31bs_bs_query
32bs_bs_query
33bs_bs_query
34bs_bs_query
35bs_bs_query
36bs_bs_query
37bs_bs_query
38bs_bs_query
39bs_bs_query
40bs_bs_query
41bs_bs_query
42bs_bs_query
43bs_bs_query
44bs_bs_query
45bs_bs_query
46bs_bs_query
47bs_bs_query
48bs_bs_query
49bs_bs_query
50bs_bs_query
51bs_bs_query
52bs_bs_query
53bs_bs_query
54bs_bs_query
55bs_bs_query
56bs_bs_query
57bs_bs_query
58bs_bs_query
59bs_bs_query
60bs_bs_query
61bs_bs_query
62bs_bs_query
63bs_bs_query
64bs_bs_query
65bs_bs_query
66bs_bs_query
67bs_bs_query
68bs_bs_query
69bs_bs_query
70bs_bs_query
71bs_bs_query
72bs_bs_query
73bs_bs_query
JOBNAME: No Job Name PAGE: 8 SESS: 9 OUTPUT: Wed Oct 9 15:41:42 2013 SUM: C28F21F2 /Xpp84/wiley_journal/GGI/ggi_v0_i0/ggi_12174
The main strength of the present study was the detailed, psychophysical measures of CS and VA obtained in a large, nationally representative population. However, the study also had some limitations. Given the restraints inherent in a multidisciplinary study of this size (e.g. participant time, cost), a fully comprehensive assessment within each domain was not feasible. There-fore, measures of visual function, such as VF and DP, along with other aspects of sensory function were not obtained, although they have been associated with FOF, falls and mobility in previous research, and therefore might have added to the analysis. Also, only those who attended a health assessment center were included, making the results directly applicable to community-dwelling adults, but not those who are housebound or resident in nursing homes and other facilities. These individuals are likely to have greater mobility limitations and to be in poorer health, so the relationship between FOF, vision and mobility might be different in this group. Finally, CS was tested under mesopic conditions, so the CS results are only directly applicable to low light conditions.
VA is the most commonly measured visual function, but it might not be the best indicator of functional vision. Everyday living involves low contrast conditions, suboptimal lighting and sources of glare, so including CS measurement could provide a more comprehensive visual assessment. Individual variations in CS have direct implications for older adults in terms of environ-mental modifications (floor surfaces, lighting), behav-iors (switching on lights especially at night) and treatment of conditions associated with poor CS (e.g. cataract). Although reduced vision does not affect the mobility of those with no FOF or FOF without activity
restriction, it does make those with FOF-related activity restriction more cautious, as evidenced by slower TUG. Reduced vision and FOF can lead to a self-imposed activity restriction, which can lead to social isolation, mobility limitations, loss of independence and increased fall risk. Therefore, the results of the present study suggest that clinicians should consider a comprehensive vision assessment including VA and CS, particularly in individuals with FOF, to prevent this transition to reduced activity.
Acknowledgments
This work was supported by the Irish Government; Irish Life plc and the Atlantic Philanthropies.
Disclosure statement
The authors declare no conflict of interest.
References
1 Tinetti ME, Powell L. Fear of falling and low self-efficacy: a case of dependence in elderly persons.J Gerontol1993;48: 35–38.
2 Friedman SM, Munoz B, West SK, Rubin GS, Fried LP. Falls and fear of falling: which comes first? A longitudinal prediction model suggests strategies for primary and sec-ondary prevention.J Am Geriatr Soc2002;50: 1329–1335. 3 Rochat S, Büla CJ, Martin Eet al. What is the relationship between fear of falling and gait in well-functioning older persons aged 65 to 70 years?Arch Phys Med Rehabil2010;
[image:8.667.88.579.65.344.2]91: 879–884.
Figure 2 Interaction effects between fear of falling (FOF) and each vision variable with respect to their effect on functional mobility (measured by Timed Up-and-Go [TUG] time). Lowest quartiles reflect lowest level of CS and VA performance.
Linear regression analysis adjusted for age, sex, body mass index, education, medications, chronic conditions, history of falls, depressive symptoms, choice reaction time, word fluency, maximum grip strength, history of cataracts (treated or untreated), glaucoma, age related macular degeneration. cpd, cycles per degree; CS, contrast sensitivity; FOF-AR, fear of falling with activity restriction; FOF-NAR, fear of falling with no activity restriction; VA, visual acuity.
1bs_bs_query
2bs_bs_query
3bs_bs_query
4bs_bs_query
5bs_bs_query
6bs_bs_query
7bs_bs_query
8bs_bs_query
9bs_bs_query
10bs_bs_query
11bs_bs_query
12bs_bs_query
13bs_bs_query
14bs_bs_query
15bs_bs_query
16bs_bs_query
17bs_bs_query
18bs_bs_query
19bs_bs_query
20bs_bs_query
21bs_bs_query
22bs_bs_query
23bs_bs_query
24bs_bs_query
25bs_bs_query
26bs_bs_query
27bs_bs_query
28bs_bs_query
29bs_bs_query
30bs_bs_query
31bs_bs_query
32bs_bs_query
33bs_bs_query
34bs_bs_query
35bs_bs_query
36bs_bs_query
37bs_bs_query
38bs_bs_query
39bs_bs_query
40bs_bs_query
41bs_bs_query
42bs_bs_query
43bs_bs_query
44bs_bs_query
45bs_bs_query
46bs_bs_query
47bs_bs_query
48bs_bs_query
49bs_bs_query
50bs_bs_query
51bs_bs_query
52bs_bs_query
53bs_bs_query
54bs_bs_query
55bs_bs_query
56bs_bs_query
57bs_bs_query
58bs_bs_query
59bs_bs_query
60bs_bs_query
61bs_bs_query
62bs_bs_query
63bs_bs_query
64bs_bs_query
65bs_bs_query
66bs_bs_query
67bs_bs_query
68bs_bs_query
69bs_bs_query
70bs_bs_query
71bs_bs_query
72bs_bs_query
73bs_bs_query
74bs_bs_query
75bs_bs_query
76bs_bs_query
77bs_bs_query
78bs_bs_query
79bs_bs_query
80bs_bs_query
81bs_bs_query
82bs_bs_query
83bs_bs_query
84bs_bs_query
85bs_bs_query
86bs_bs_query
87bs_bs_query
88bs_bs_query
4 Arfken CL, Lach HW, Birge SJ, Miller JP. The prevalence and correlates of fear of falling in elderly persons living in the community.Am J Public Health1994;84: 565–570. 5 Austin N, Devine A, Dick I, Prince R, Bruce D. Fear of
falling in older women: a longitudinal study of incidence, persistence, and predictors. J Am Geriatr Soc 2007; 55: 1598–1603.
6 Scheffer AC, Schuurmans MJ, van Dijk N, van der Hooft T, de Rooij SE. Fear of falling: measurement strategy, prevalence, risk factors and consequences among older persons.Age Ageing2008;37: 19–24.
7 Vellas BJ, Wayne SJ, Romero LJ, Baumgartner RN, Garry PJ. Fear of falling and restriction of mobility in elderly fallers.Age Ageing1997;26: 189–193.
8 Zijlstra GAR, van Haastregt JCM, van Eijk JTM, van Rossum E, Stalenhoef PA, Kempen GIJM. Prevalence and correlates of fear of falling, and associated avoidance of activity in the general population of community-living older people.Age Ageing2007;36: 304–309.
9 Delbaere K, Crombez G, Vanderstraeten G, Willems T, Cambier D. Fear-related avoidance of activities, falls and physical frailty. A prospective community-based cohort study.Age Ageing2004;33: 368–373.
10 Deshpande N, Metter EJ, Lauretani F, Bandinelli S, Guralnik J, Ferrucci L. Activity restriction induced by fear of falling and objective and subjective measures of physical function: a prospective cohort study.J Am Geriatr Soc2008;
56: 615–620.
11 Klein BE, Klein R, Lee KE, Cruickshanks KJ. Performance-based and self-assessed measures of visual function as related to history of falls, hip fractures, and measured gait time. The Beaver Dam Eye Study.Ophthalmology1998;105: 160–164.
12 Kwan MM-S, Lin S-I, Chen C-H, Close JCT, Lord SR. Sensorimotor function, balance abilities and pain influence Timed Up and Go performance in older community-living people.Aging Clin Exp Res2011;23: 196–201.
13 Luiz LC, Rebelatto JR, Coimbra AMV, Ricci NA. Associa-tion between visual deficit and clinical-functional characteristics among community-dwelling older adults (Associação entre déficit visual e aspectos clínico-funcionais em idosos da comunidade).Rev Bras2009;13: 444–450.
14 West CG, Gildengorin G, Haegerstrom-Portnoy G, Schneck ME, Lott L, Brabyn JA. Is vision function related to physical functional ability in older adults?J Am Geriatr Soc2002;50: 136–145.
15 West SK, Rubin GS, Broman AT, Munoz B, Bandeen-Roche K, Turano K. How does visual impairment affect performance on tasks of everyday life? The SEE Project. Salisbury Eye Evaluation. Arch Ophthalmol 2002;
120: 774–780.
16 Laitinen A, Sainio P, Koskinen S, Rudanko S-L, Laatikainen L, Aromaa A. The association between visual acuity and functional limitations: findings from a nation-ally representative population survey.Ophthalmic Epidemiol
2007;14: 333–342.
17 Freeman EE, Muñoz B, Rubin G, West SK. Visual field loss increases the risk of falls in older adults: the salisbury eye evaluation.Invest Ophthalmol Vis Sci2007;48: 4445–4450. 18 Klein BEK, Moss SE, Klein R, Lee KE, Cruickshanks KJ.
Associations of visual function with physical outcomes and limitations 5 years later in an older population: the Beaver Dam eye study.Ophthalmology2003;110: 644–650. 19 Kuang T-M, Tsai S-Y, Hsu W-M, Cheng C-Y, Liu J-H,
Chou P. Visual impairment and falls in the elderly: the shihpai eye study.J Chin Med Assoc2008;71: 467–472.
20 Lord SR, Dayhew J. Visual risk factors for falls in older people.J Am Geriatr Soc2001;49: 508–515.
21 Rossat A, Fantino B, Nitenberg C et al. Risk factors for falling in community-dwelling older adults: which of them are associated with the recurrence of falls?J Nutr Health Aging2010;14: 787–791.
22 Howland J, Lachman ME, Peterson EW, Cote J, Kasten L, Jette A. Covariates of fear of falling and associated activity curtailment.Gerontologist1998;28: 549–555.
23 Kempen G, van Haastregt J, McKee K, Delbaere K, Zijlstra GR. Socio-demographic, health-related and psychosocial correlates of fear of falling and avoidance of activity in community-living older persons who avoid activity due to fear of falling.BMC Public Health2009;9: 170.
24 Fletcher PC, Hirdes JP. Restriction in activity associated with fear of falling among community-based seniors using home care services.Age Ageing2004;33: 273–279. 25 Deshpande N, Metter EJ, Bandinelli S, Lauretani F,
Windham BG, Ferrucci L. Psychological, physical, and sensory correlates of fear of falling and consequent activity restriction in the elderly: the InCHIANTI study.Am J Phys Med Rehabil2008;87: 354–362.
26 Sakari R, Era P, Rantanen T, Leskinen E, Laukkanen P, Heikkinen E. Mobility performance and its sensory, psy-chomotor and musculoskeletal determinants from age 75 to age 80.Aging Clin Exp Res2010;22: 47–53.
27 Kearney PM, Cronin H, O’Regan Cet al. Cohort profile: the irish longitudinal study on ageing.Int J Epidemiol2011;
40: 877–884.
28 Beekman ATF, Deeg DJH, van Limbeek J, Braam AW, de Vries MZ, van Tilburg W. Criterion validity of the Center for Epidemiologic Studies Depression scale (CES-D): results from a community-based sample of older subjects in the Netherlands.Psychol Med1997;27: 231–235. 29 Reelick MF, van Iersel MB, Kessels RPC, Rikkert MGMO.
The influence of fear of falling on gait and balance in older people.Age Ageing2009;38: 435–440.
30 Folstein MF, Folstein SE, McHugh PR. “Mini-mental state”. A practical method for grading the cognitive state of patients for the clinician.J Psychiatr Res1975;12: 189–198. 31 Lezak MD, Howieson DB, Loring DW.Neuropsychological Assessment, 4th edn. New York: Oxford University Press, 2004.
32 Standardising JAR. Chronometery. Clocking the Mind: Mental Chronometry and Individual Differences. Amsterdam: Elsevier, 2006; 237–246.
33 Donoghue OA, Horgan NF, Savva GM, Cronin H, O’Regan C, Kenny RA. Association between timed up-and-go and memory, executive function, and process-ing speed.J Am Geriatr Soc2012;60: 1681–1686.
34 Rantanen T, Guralnik JM, Foley Det al. Midlife hand grip strength as a predictor of old age disability.JAMA1999;
281: 558–560.
35 Podsiadlo D, Richardson S. The timed “Up & Go”: a test of basic functional mobility for frail elderly persons. J Am Geriatr Soc1991;39: 142–148.
36 Klein BEK, Klein R, Lee KE, Cruickshanks KJ. Associa-tions of performance-based and self-reported measures ofvisual function: the Beaver Dam Eye Study.Ophthalmic Epidemiol1999;6: 49–60.
37 Ferris FL, Kassoff A, Bresnick GH, Bailey I. New visual acuity charts for clinical research.Am J Ophthalmol 1982;
94: 91–96.
38 Colenbrander A. Visual standards, aspects and range of vision loss with emphasis on population surveys. Report prepared for the International Council of Ophthalmology at the 29th International Congress of Ophthalmology. Sydney, 2002.
JOBNAME: No Job Name PAGE: 10 SESS: 9 OUTPUT: Wed Oct 9 15:41:42 2013 SUM: 176D488F /Xpp84/wiley_journal/GGI/ggi_v0_i0/ggi_12174
39 Hohberger B, Laemmer R, Adler W, Juenemann AG, Horn FK. Measuring contrast sensitivity in normal subjects with OPTEC 6500: influence of age and glare.Graefes Arch Clin Exp Ophthalmol2007;245: 1805–1814.
40 Viljanen A, Kulmala J, Rantakokko M, Koskenvuo M, Kaprio J, Rantanen T. Fear of falling and coexisting sensory difficulties as predictors of mobility decline in older women.J Gerontol A Biol Sci Med Sci2012;67: 1230–1237. 41 Lord SR, Menz HB. Visual contributions to postural
sta-bility in older adults.Gerontology2000;46: 306–310. 42 Dhital A, Pey T, Stanford MR. Visual loss and falls: a
review.Eye2010;24: 1437–1446.
43 Owsley C, Sekuler R, Siemsen D. Contrast sensitivity throughout adulthood.Vision Res1983;23: 689–699.
44 Glass JM. Visual function and cognitive aging: differential role of contrast sensitivity in verbal versus spatial tasks.
Psychol Aging2007;22: 233–238.
45 Salthouse TA. The processing-speed theory of adult age differences in cognition.Psychol Rev 1996;103: 403– 428.
46 Madden DJ. Aging and visual attention.Curr Dir Psychol Sci
2007;16: 70–74.
47 Anstey KJ, Wood J, Kerr G, Caldwell H, Lord SR. Different cognitive profiles for single compared with recurrent fallers without dementia.Neuropsychology2009;23: 500–508. 48 Owsley C, Sloane ME. Contrast sensitivity, acuity, and the
perception of “real-world” targets.Br J Ophthalmol1987;71: 791–796.
1bs_bs_query
2bs_bs_query
3bs_bs_query
4bs_bs_query
5bs_bs_query
6bs_bs_query
7bs_bs_query
8bs_bs_query
9bs_bs_query
10bs_bs_query
11bs_bs_query
12bs_bs_query
13bs_bs_query
14bs_bs_query
15bs_bs_query
16bs_bs_query
17bs_bs_query
18bs_bs_query
19bs_bs_query
20bs_bs_query
21bs_bs_query
22bs_bs_query
23bs_bs_query
24bs_bs_query
25bs_bs_query
26bs_bs_query
27bs_bs_query
28bs_bs_query