*For correspondence: [email protected]
Competing interest:See page 12
Funding:See page 12
Received:30 November 2018 Accepted:07 May 2019 Published:02 July 2019
Reviewing editor: Heidi Johansen-Berg, University of Oxford, United Kingdom
Copyright Ku¨hn et al. This article is distributed under the terms of theCreative Commons Attribution License,which permits unrestricted use and redistribution provided that the original author and source are credited.
Predicting development of adolescent
drinking behaviour from whole brain
structure at 14 years of age
Simone Ku¨hn
1,2*, Anna Mascharek
1, Tobias Banaschewski
3, Arun Bodke
4,
Uli Bromberg
5, Christian Bu¨chel
5, Erin Burke Quinlan
6, Sylvane Desrivieres
6,
Herta Flor
7,8, Antoine Grigis
9, Hugh Garavan
10,11, Penny A Gowland
12,
Andreas Heinz
13, Bernd Ittermann
14, Jean-Luc Martinot
15, Frauke Nees
3,8,
Dimitri Papadopoulos Orfanos
9, Tomas Paus
16,17,18, Luise Poustka
19,
Sabina Millenet
3, Juliane H Fro¨hner
20, Michael N Smolka
20, Henrik Walter
13,
Robert Whelan
21, Gunter Schumann
6, Ulman Lindenberger
2, Ju¨rgen Gallinat
1,
IMAGEN Consortium
1
Department of Psychiatry and Psychotherapy, University Medical Center
Hamburg-Eppendorf, Hamburg, Germany;
2Center for Lifespan Psychology, Max Planck
Institute for Human Development, Berlin, Germany;
3Department of Child and
Adolescent Psychiatry and Psychotherapy, Central Institute of Mental Health,
Medical Faculty Mannheim, Heidelberg University, Mannheim, Germany;
4Discipline
of Psychiatry, School of Medicine and Trinity College Institute of Neuroscience,
Trinity College Dublin, Dublin, Ireland;
5University Medical Centre
Hamburg-Eppendorf, Hamburg, Germany;
6Medical Research Council - Social, Genetic and
Developmental Psychiatry Centre, Institute of Psychiatry, Psychology &
Neuroscience, King’s College London, London, United Kingdom;
7Department of
Cognitive and Clinical Neuroscience, Central Institute of Mental Health, Medical
Faculty Mannheim, Heidelberg University, Mannheim, Germany;
8Department of
Psychology, School of Social Sciences, University of Mannheim, Mannheim,
Germany;
9NeuroSpin, CEA, Universite´ Paris-Saclay, Gif-sur-Yvette, France;
10Department of Psychiatry, University of Vermont, Burlington, United States;
11
Department of Psychology, University of Vermont, Burlington, United States;
12Sir
Peter Mansfield Imaging Centre School of Physics and Astronomy, University of
Nottingham, Nottingham, United Kingdom;
13Department of Psychiatry and
Psychotherapy, Charite´ – Universita¨tsmedizin Berlin, Berlin, Germany;
14Physikalisch-Technische Bundesanstalt (PTB), Berlin, Germany;
15Institut National de la Sante´ et
de la Recherche Me´dicale, INSERM Unit 1000 “Neuroimaging & Psychiatry”,
University ParisSud, University Paris Descartes, Paris, France;
16Bloorview Research
Institute, Holland Bloorview Kids Rehabilitation Hospital, Toronto, Canada;
17
Department of Psychology, University of Toronto, Toronto, Canada;
18Department
Abstract
Adolescence is a common time for initiation of alcohol use and development of alcohol use disorders. The present study investigates neuroanatomical predictors for trajectories of future alcohol use based on a novel voxel-wise whole-brain structural equation modeling framework. In 1814 healthy adolescents of the IMAGEN sample, the Alcohol Use Disorder Identification Test (AUDIT) was acquired at three measurement occasions across five years. Based on a two-part latent growth curve model, we conducted whole-brain analyses on structural MRI data at age 14,predicting change in alcohol use score over time. Higher grey-matter volumes in the caudate nucleus and the left cerebellum at age 14 years were predictive of stronger increase in alcohol use score over 5 years. The study is the first to demonstrate the feasibility of running separate voxel-wise structural equation models thereby opening new avenues for data analysis in brain imaging. DOI: https://doi.org/10.7554/eLife.44056.001
Introduction
Adolescence is a critically vulnerable time for the development of alcohol drinking habits that may lead to considerable consequences later in life including the development of alcohol addiction. Importantly, the period of adolescence coincides with substantial behavioural changes together with structural and functional brain development. Cortico-striatal regions play an important role in the regulation of behaviour and might therefore play a role in progress and maintenance of habits such as drinking (Heinz, 2002). In particular, it has been proposed that drug addiction involves dysfunc-tions of brain circuitry related to the neurotransmitter dopamine that lead to alteradysfunc-tions in both impulsive and compulsive behaviour (Koob and Kreek, 2007). Since early exposure to drugs may alter brain development during adolescence this may set the stage for cognitive problems in adult-hood, which translate into behavioral consequences throughout life (Jacobus and Tapert, 2013). Hence, it is of particular importance to predict the acceleration of alcohol use as early as possible during adolescence in order to intervene timely.
Nees and colleagues reported that reward-related brain activation aided in the prediction of early-onset drinking in adolescents at age 14 years in a subset of the data used in the present paper (Nees et al., 2012). In a functional imaging study on youth of age 12–14 years, prior to initiation of alcohol use, it was found that teens classified as transitioning to heavy alcohol use by age 18 had less blood oxygen level dependent (BOLD) activation in frontal, temporal, and parietal cortices in a response inhibition task (Norman et al., 2011). These reports support the notion that brain differen-ces present early during adolescence may leave certain youth vulnerable to addictive behaviors. In an earlier publication on the same data set, we focussed on the prediction of changes in alcohol-related problems between age 14 and 16 years based on gyrification of the orbitofrontal cortex (Ku¨hn et al., 2016). We argued that it is important to use behavioral difference scores when aiming at predicting prospective behavior rather than absolute measures at the prospective time point only. In applying difference scores rather than absolute measures, all available information can be taken into account to evaluate potentially problematic behaviour.
Results
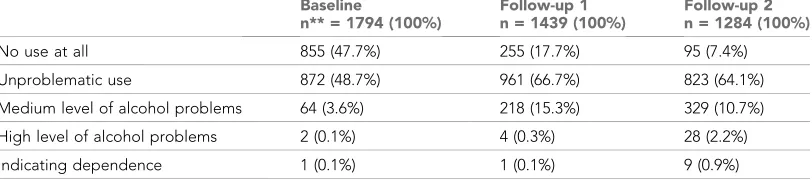
We started the analyses with estimating the two-part latent growth curve model on the clinical data only containing an intercept and a linear growth factor for both alcohol use vs. non-use as well as for the alcohol use score.Table 1 shows the classification of the AUDIT-scores concerning severity of use (Figure 1).
In the discrete part of the model, a linear growth model demonstrated better fit to alcohol use vs. non-use than an intercept-only model, Dc2 (Koob and Kreek, 2007) (3, N = 1814)=653.63, p<0.001. Inclusion of a quadratic growth factor did not improve model fit, Dc2(Koob and Kreek, 2007) (1, N = 1814)= 0.74, p=0.390, therefore we refrained from a quadratic growth factor.
eLife digest
Puberty is a time of transformation. Physical changes in the body occur alongside changes in personality and behaviour. Compared to children, adolescents tend to be risk-takers and novelty-seekers. They crave new sensations and experiences, as well as social interaction with their peers. It is around puberty that many people try alcohol for the first time. But it is not clear why people differ in their drinking habits, and why a small minority of young adults go on to become dependent on alcohol.Part of the answer may lie in changes in the brain. Differences in the size and structure of brain regions contribute to differences in behaviour between individuals. During adolescence, the brain undergoes extensive re-modelling. It forms new connections, while also pruning away connections that are unused. Could differences in brain structure at puberty lead to differences in alcohol consumption in early adulthood?
Ku¨hn et al. scanned the brains of about 1,800 healthy adolescents at the age of 14 and then again at 19 (within the context of the IMAGEN study). At three time points, the teenagers also filled in questionnaires about their use of alcohol. Two areas of the brain – the caudate nucleus and the left cerebellum – were larger at age 14 in teenagers who would increase their alcohol consumption by age 19. The larger the areas at age 14, the bigger the increase in alcohol consumption over time. Notably, there was no relationship between the size of either brain area at the age of 14 and how much alcohol the individuals drank at the same age.
These results may help us to understand why some young adults develop harmful drinking habits, whereas most do not. The findings are part of a large and complex picture. Other factors, such as social influences, also shape alcohol consumption. However, the findings of Ku¨hn et al. suggest that differences in brain structure may make some individuals more likely to increase how much alcohol they drink than others. Understanding these biological differences could help researchers to develop measures to prevent addiction in young adults.
[image:3.612.170.576.557.647.2]DOI: https://doi.org/10.7554/eLife.44056.002
Table 1.Severity of alcohol use at three measurement occasions according to AUDIT.* Baseline
n** = 1794 (100%)
Follow-up 1 n = 1439 (100%)
Follow-up 2 n = 1284 (100%)
No use at all 855 (47.7%) 255 (17.7%) 95 (7.4%)
Unproblematic use 872 (48.7%) 961 (66.7%) 823 (64.1%)
Medium level of alcohol problems 64 (3.6%) 218 (15.3%) 329 (10.7%)
High level of alcohol problems 2 (0.1%) 4 (0.3%) 28 (2.2%)
Indicating dependence 1 (0.1%) 1 (0.1%) 9 (0.9%)
*Note: Categorization is based on the interpretation guideline of the World Health Organization: Cut-offs scores are: 0–7 = unproblematic use, 8–15: simple advice focused on the reduction of hazardous drinking warranted, 16–19: brief counseling and continued monitoring warranted, above 20: further diagnostic for alcohol dependence strongly warranted.
**Note: 20 individuals had missing data, in total adding up to 1814.
In the continuous part of the model, a linear growth model likewise demonstrated a better fit to alcohol use scores than an intercept-only model,Dc2(Koob and Kreek, 2007)(3, N = 1814)=860.58, p<0.001. Inclusion of a quadratic growth factor did not improve model fit, Dc2(Koob and Kreek, 2007)(1, N = 1814)= 0.58, p=0.450. Therefore, we accepted the model with intercept and a linear growth factor on the clinical data as our working model. We then added the nuisance covariates age, sex, scanner and total brain volume to the model by predicting the slope of the continuous part of the model (no matter whether the regression paths were significant or not), since it is com-mon practice in neuroimaging studies to control for these nuisance variables. The final model on the
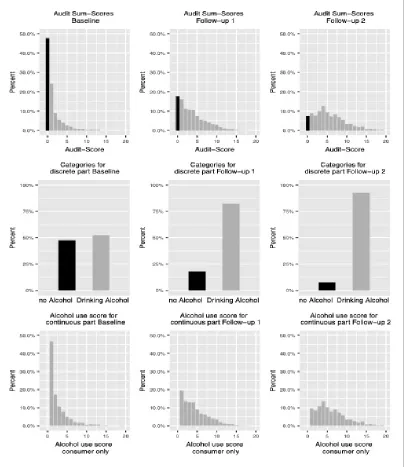
Figure 1.Preparation of AUDIT Sum-Scores for two-part latent growth mixture model. Upper row: data from original scale (Sum Score), zeros are shown in black and indicate non-drinking individuals. Middle row: Transformation of data into consumer and non-consumer without fine-grading of alcohol use scores. Bottom row: Alcohol use score (AUDIT Sum-Score) for individuals who drink at all. Note that to enhance readability of the figure, sum-scales (upper and bottom row) are truncated at a score of 20.
clinical data, not yet including the brain data (since this varied for each voxel of the brain) demon-strated an acceptable model fit,c2= 444, df = 65, RMSEA = 0.057, CFI = 0.785, SRMR = 0.065.
Concerning the latent intercept and slope for both parts of the model, intercepts were cantly different from zero and variances of the intercepts for both parts of the model were signifi-cant, suggesting significant interindividual heterogeneity around the estimated mean level of alcohol drinking use vs. non-use and the alcohol use score at age 14 (for estimates seeTable 2). The covari-ance between the intercepts of the two parts of the model was 0.124, p<0.001, indicating that ado-lescents with a higher propensity to engage in alcohol drinking also engaged in it more frequently and vice versa.
[image:5.612.38.577.360.700.2]Turning to the growth parameters, for the continuous part of the model the estimated mean of the slope was not significantly different from zero, indicating that, on average, no change in drinking habits emerged over time. However, the variance was significantly different from zero, indicating interindividual differences in change of drinking behaviour between participants. For the discrete part of the model both the mean and the variance of the slope were significantly different from zero, indicating change on average as well as interindividually. The positive mean of the slope indicated an increasing propensity for drinking across time. Intercept and slope covaried significantly ( 0.033, p<0.001) within the discrete part of the model, however, numerically the correlation coefficient was so small that we do not think the association necessitates in-depth interpretation. No significant cor-relation emerged between intercept and slope for the continuous part of the model, indicating that a relation between alcohol use score at age 14 and change in this behavior was not captured in our model.
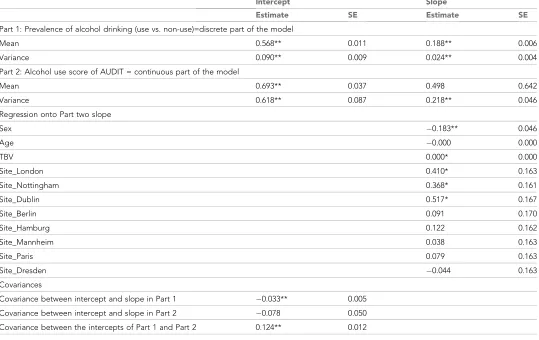
Table 2.Estimated parameters in probability of use vs. non-use and alcohol use score with nuisance variables on the clinical data (not yet including brain data)
Intercept Slope
Estimate SE Estimate SE
Part 1: Prevalence of alcohol drinking (use vs. non-use)=discrete part of the model
Mean 0.568** 0.011 0.188** 0.006
Variance 0.090** 0.009 0.024** 0.004
Part 2: Alcohol use score of AUDIT = continuous part of the model
Mean 0.693** 0.037 0.498 0.642
Variance 0.618** 0.087 0.218** 0.046
Regression onto Part two slope
Sex 0.183** 0.046
Age 0.000 0.000
TBV 0.000* 0.000
Site_London 0.410* 0.163
Site_Nottingham 0.368* 0.161
Site_Dublin 0.517* 0.167
Site_Berlin 0.091 0.170
Site_Hamburg 0.122 0.162
Site_Mannheim 0.038 0.163
Site_Paris 0.079 0.163
Site_Dresden 0.044 0.163
Covariances
Covariance between intercept and slope in Part 1 0.033** 0.005
Covariance between intercept and slope in Part 2 0.078 0.050
Covariance between the intercepts of Part 1 and Part 2 0.124** 0.012
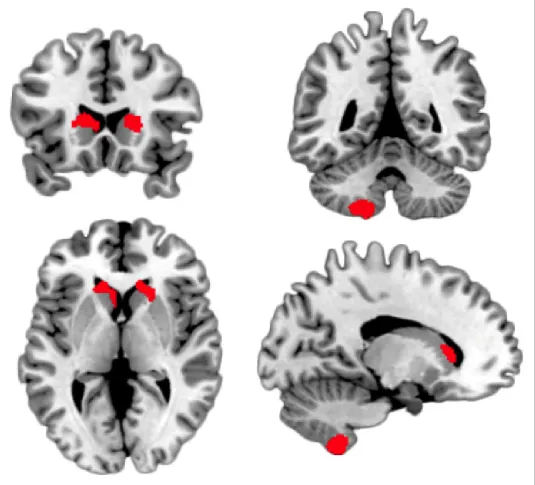
Based on this two-part latent growth curve model on the clinical data, we entered the brain data and conducted a whole-brain analysis on grey matter probability maps at age 14 years predicting change in alcohol use score, that is the latent slope in the continuous part of the model, over time from each voxel in the brain (Figure 2). Within the model an increase in alcohol use score is reflected as a positive and a decrease in alcohol use score as a negative latent slope mean. We found a posi-tive association within bilateral caudate nucleus (around 14, 24, 7 and 17, 24, 6) and left cerebellum (Lobule VIII/IX, around 16,–53, 56), where higher grey matter volume predicts greater change in alcohol use scores (p<0.001, cluster >100 voxels,Figure 3). We repeated the same analysis on log-transformed data, to address the problem of skewness in the data with almost identical results. The same analysis on white matter probability maps did not result in any significant clusters. Neither did repeating the same analyses when investigating a regression path between white or grey matter voxels and the change in alcohol use vs. non-use. Moreover, we conducted the same whole-brain analysis while predicting the latent intercept of the continuous part of the model, which reflects how high individuals score on AUDIT on average. Here also no significant clusters emerged, neither for white nor grey matter maps.
Discussion
The goal of the present study was to unravel structural brain predictors at age 14 of the trajectory of alcohol use scores over the course of adolescence, namely between the age of 14 and 19 years. For this reason, we used a two-part latent growth curve model since it decomposes the semicontinuous outcome measure into a dichotomous use vs. non-use and a continuous alcohol use score part. The mean and variance of the intercepts for both parts of the model were significant, and the covariance between both intercepts was significant, indicating that adolescents with a higher propensity to engage in alcohol drinking also engaged in it more frequently and vice versa. For the continuous part of the model, the estimated mean of the slope was not significantly different, indicating that, on average, no change in drinking habits emerged. However, the variance was significant, indicating interindividual differences in change of drinking behaviour between participants. For the discrete part of the model, both the mean and the variance of the slope were significantly different from zero.
Since we were most interested in early brain-predictors of the intraindividual changes of alcohol use scores we computed a separate SEM for each brain voxel acquired at baseline (age 14 years). To obtain a brain map we plotted the resulting statistics of the regression path between brain and changes in alcohol use score back into brain space where we observed that higher grey matter vol-ume in bilateral caudate nucleus and in left cerebellum was associated with a stronger increase (slope) in alcohol use scores. No associations were observed between grey matter brain data and the slope or intercept of the dichotomous use vs. non-use or the intercept of the continuous part of the model, nor in the white matter of the brain.
Neurodevelopmental changes in caudate and cerebellum
Caudate nucleus and cerebellum as a predictor of alcohol problems
The present finding of a predictive value of bilateral caudate volume for the trajectory of alcohol use during adolescence fits nicely to previous studies in search of brain structural predictors of drinking. [image:7.612.39.576.64.548.2]One study on 40 adolescents using FreeSurfer showed that at baseline (12–17 years of age) par-ticipants who transitioned into heavy drinking after 3 years showed smaller left cingulate, pars trian-gularis, and rostral anterior cingulate volume, and less right cerebellar white matter volumes (Squeglia et al., 2014).
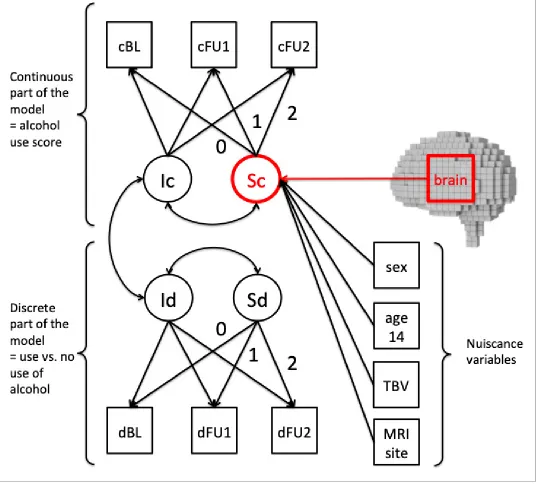
Figure 2.Two-part latent growth mixture model. c = continuous, d = discrete, BL = baseline, FU = follow up, I = intercept, S = slope, TBV = total brain volume, MRI site was not a single indicator as depicted for reasons of simplicity, but consisted of 9–1 separate indicators dummy coding the different scanners used.
Other studies focussed on activation of the striatum, for example during an fMRI reward para-digm, reporting increases in brain activation in caudate nucleus at reward delivery in participants who had their first drink during puberty as compared to those who started after puberty ( Boecker-Schlier et al., 2017). In another study focussing on brain function, 43 postpubertal participants (aged 18–21 years) were followed over a year and classified into moderate and heavy drinkers or transitioners who started drinking heavily. In a cue-reactivity paradigm showing alcohol stimuli, tran-sitioners showed higher activation in bilateral caudate nucleus, orbitofrontal cortex medial frontal cortex/anterior cingulate and left insula (Dager et al., 2014). However, the two latter results have not been corrected for grey matter volume, and it could well be that the stronger brain activation
Figure 3.Brain regions showing a significant regression path from brain voxel to the latent slope of alcohol use score increase over time. The higher the grey matter volume the larger the slope increase.
observed in caudate (among others) was actually driven by higher grey matter volume (to correct for these structural effects dedicated toolboxes have been developed;Casanova et al., 2007).
Of note, it is very interesting that the cluster in caudate nucleus and cerebellum found to be pre-dictive of the future changes in alcohol use scores were not related to the mean level of alcohol use scores in each individual, since we observe no significant regions in the analysis where the latent intercept of the continuous part of the model predicts the respective brain voxels. This indicates that the grey matter volume in caudate nucleus and cerebellum has a value in predicting changes, but not the average alcohol use in general at the timepoint analysed. On the basis of the present analy-ses, one might argue that preventive measures at this age should focus on the development of alco-hol use rather than on drinking habits at the age of 14, as the results suggest that specific characteristics of those brain regions prepare the ground for future alcohol consumption.
Prediction of the start of alcohol drinking
The fact that the brain-based prediction of the latent slope of the dichotomous part of the model showed no significant resulting clusters indicates that, using the presented methods, brain data is
not indicative for the prognosis when individuals start drinking. In this sense, the present results could be regarded as in line with a previous publication from the IMAGEN data set (Whelan et al., 2014) in which it was shown that brain information (at age 14 years) added only moderately in the prediction of binge drinking at age 16 years. Moreover, rather unspecific brain measures have been added in the analyses, namely overall regional grey matter volume and the ratio of grey and white matter volume. In a different data set (Squeglia et al., 2017), likewise only diffuse regions added to the prediction of initiation of alcohol use during adolescence. This later observation makes the pre-diction of the changes in alcohol use scores over time from very distinct brain regions the more remarkable. While we learned from previous studies that brain characteristics might not be the key factor in explaining the start of alcohol consumption in adolescence, we learn from the present study that brain structural characteristics are of relevance when considering the development of alcohol use in adolescence.
Caudate nucleus and psychiatric disease
Interestingly, a recent meta-analysis on brain imaging studies focussing on brain structural alterations across psychiatric disorders has revealed consistency in increases within bilateral striatum when com-paring psychiatric patients to controls (Goodkind et al., 2015). From this meta-analysis on cross-sec-tional data, it is unclear whether these striatal increases in psychiatric patients were already present during adolescence or whether they occurred around disease onset or over the course of the dis-ease. But it is interesting that the direction of the effect and the localisation bear resemblance to the results of our study, although we focussed on trajectories of alcohol use which were, for most of the participants, far from the actual diagnosis of alcohol addiction.
Novel methodological approach: whole-brain structural equation
modeling
Conclusion
The present study revealed structural brain predictors (at 14 years of age) of the trajectory of alcohol use scores between the age of 14 and 19 years. A two-part latent growth curve model was utilized to decompose the semicontinuous AUDIT outcome measure into a dichotomous use vs. non-use and a continuous alcohol use scale part. We predicted the slope of use vs. non-use and of alcohol use scores by voxel-wise grey and white matter probability maps at baseline. To obtain brain maps as a result, we plotted the statistics of the regression path between brain and slope back into brain space. We observed that higher grey matter volume in bilateral caudate nucleus and in left cerebel-lum at age 14 years was associated with a stronger increase in alcohol use scores. This finding fits well to previous studies pointing at an association between increases in striatum and psychiatric dis-ease. Potentially this is due to neurodevelopmental interindividual differences since adolescence is a period of brain structural in- and decreases. Our finding may reflect a deceleration of pruning or an overproduction that surpasses the normal developmental overproduction of synapses. Future research with repeated neuroimaging measurements is needed to solve this neurodevelopmental question.
Materials and methods
Participants
We used data of 1794 healthy 14-year-old adolescents (mean age = 14.4, SD = 0.45 years; 54% males) who were recruited within the scope of the IMAGEN project, a European multi-centre genetic-neuroimaging study in adolescence (Schumann et al., 2010). The selection of the partici-pants was based on the fact that structural imaging data at age of 14 years was present. At the time of analyses reported here (age 14 years), retest data at age 16–17 years was present for 1439 partici-pants (mean age = 16.6, SD = 0.64 years; 55% males) and at age 19 years for 1284 participartici-pants (mean age = 19.0, SD = 0.77 years; 53% males). Written informed consent was obtained from all par-ticipants as well as from their legal guardians. The adolescents were recruited from secondary schools. The study was approved by all local ethics committees separately (in Germany this was accomplished by the medical ethics committee of the University of Heidelberg, reference number: 2007-024N-MA) and approved by the head teachers of the respective schools. Participants with a medical condition or neurological disorders were excluded. All participating subjects were assessed by means of self-rating and two external ratings (by their parents and a psychiatrist specialized in pediatrics) based on ICD-10 as well as DSM-IV (The Development and Well-Being Assessment Inter-view, DAWBA;Goodman et al., 2000).
Questionnaire
We administered the Alcohol Use Disorder Identification Test (AUDIT,Babor and Higgins-Biddle, 2001) at Baseline (age 14 years), Follow-up 1 (age 16–17 years) and Follow-up 2 (age 19 years) to identify alcohol use. We computed the total score by adding the scores of all 10 items.
Scanning procedure
Structural MRI was performed on 3 Tesla scanners from three manufacturers (Siemens: five sites; Phi-lips: two sites; and General Electric: two sites). The details of the entire MR protocol are described elsewhere (Schumann et al., 2010). In this study, we used the T1-weighted images. These high-reso-lution anatomical MRIs were obtained using a three-dimensional magnetization prepared gradient-echo (MPRAGE) sequence based on the ADNI protocol ( http://adni.loni.usc.edu/methods/docu-ments/mri-protocols/; modified for the IMAGEN study to give a 1.11.11.1 mm3voxel size).
Voxel-based morphometry
For the present report, structural MR data of 2072 adolescents were available. We excluded all par-ticipants where the image quality was suboptimal, most likely due to movement. The visual quality control was carried out by 10 independent raters.
The affine registered grey matter (GM) and white matter (WM) segmentations were used to build a customized DARTEL (diffeomorphic anatomical registration through exponentiated lie algebra) tem-plate. Then warped GM and WM segments were created. Modulation was applied in order to pre-serve the volume of a particular tissue within a voxel by multiplying voxel values in the segmented images by the Jacobian determinants derived from the spatial normalization step. In effect, the anal-ysis of modulated data tests for regional differences in the absolute amount (volume) of GM/WM. Images were smoothed with a FWHM (full-width at half maximum) kernel of 8 mm.
Structural equation modelling
Analyses were conducted within a structural equation modeling (SEM) framework using MPlus and R. We implemented a two-part latent growth curve model (Muthen, 2001; Olsen and Schafer, 2001) since the AUDIT scores were zero inflated. In a two-part latent growth curve model, zeros are valid values with its own meaning and not just proxies for missingness. Information that is contained by zeros and the specific values of the non-zeros is qualitatively different and might even be differen-tially influenced by covariates (cf., Olsen and Schafer, 2001). In a two-part latent growth curve model, the presence or absence of a behavior and, if present, the manifestation of a specific behav-ior can be modeled simultaneously in one model. In our study, the original distribution of the alcohol use variable (AUDIT-score) was decomposed into two parts (seeFigure 1). Then, each was modeled by separate, but correlated, growth functions (see Figure 2). For the discrete part of the model scores of zero were separated from the rest of the distribution by creating a binary indicator variable that distinguished any positive alcohol use score (=1) from nouse (=0) (lower part ofFigure 2). For the continuous part of the model, the continuous indicator variables representing the AUDIT score, given that it was above zero, were used (upper part ofFigure 2). In this latter part of the model, substance non-use within each time point was treated as missing data, following standard assump-tions of data missing at random (MAR;Little and Rubin, 1987). In that way participants who did not drink alcohol throughout the study contributed little information to the growth parameter estimates, but all information to alcohol use was used to estimate the growth parameters. We used Maximum Likelihood estimator for our analyses.
We controlled for the effects of age at baseline, sex, total brain volume (TBV) and site (by dummy coding eight of all nine neuroimaging sites, for simplicity we represent this by only one manifest vari-able inFigure 2) onto the slope of the continuous part of the growth model. As criteria for model fit we report Root Mean Square Error of Approximation (RMSEA), Comparative Fit Index (CFI), and Standardized Root Mean Square Residual (SRMR). Values of the CFI above 0.90 denote a well-fitting model, whereas for the RMSEA and the SRMR values less than 0.08 may be interpreted as accept-able model-fit.
Acknowledgements
This work received support from the following sources: the European Union-funded FP6 Integrated Project IMAGEN (Reinforcement-related behaviour in normal brain function and psychopathology) (LSHM-CT- 2007–037286), the Horizon 2020 funded ERC Advanced Grant ‘STRATIFY’ (Brain network based stratification of reinforcement-related disorders) (695313), ERANID (Understanding the Inter-play between Cultural, Biological and Subjective Factors in Drug Use Pathways) (PR-ST-0416–10004), BRIDGET (JPND: BRain Imaging, cognition Dementia and next generation GEnomics) (MR/N027558/ 1), the FP7 projects IMAGEMEND(602450; IMAging GEnetics for MENtal Disorders) and MATRICS (603016), the Innovative Medicine Initiative Project EU-AIMS (115300–2), the Medical Research Council Grant ’c-VEDA’ (Consortium on Vulnerability to Externalizing Disorders and Addictions) (MR/ N000390/1), the Swedish Research Council FORMAS, the Medical Research Council, the National Institute for Health Research (NIHR) Biomedical Research Centre at South London and Maudsley NHS Foundation Trust and King’s College London, the Bundesministeriumfu¨r Bildung und Forschung (BMBF grants 01GS08152; 01EV0711; eMED SysAlc01Z 1311A; Forschungsnetz AERIAL 01EE1406A, 01EE1406B), the Deutsche Forschungsgemeinschaft (DFG grants SM 80/7–2, SFB 940/ 2), the Medical Research Foundation and Medical research council (grant MR/R00465X/1). Further support was provided by grants from: ANR (project AF12-NEUR0008-01 - WM2NA, and ANR-12-SAMA-0004), the Fondation de France, the Fondation pour la Recherche Me´dicale, the Mission Inter-ministe´rielle de Lutte-contre-les-Drogues-et-les-Conduites-Addictives (MILDECA), the Assistance-Publique-Hoˆpitaux-de-Paris and INSERM (interface grant), Paris Sud University IDEX 2012; the National Institutes of Health, Science Foundation Ireland (16/ERCD/3797), U.S.A. (Axon, Testoster-one and Mental Health during Adolescence; RO1 MH085772-01A1), and by NIH Consortium grant U54 EB020403, supported by a cross-NIH alliance that funds Big Data to Knowledge Centres of Excellence. SK has been funded by a Heisenberg grant from the German Science Foundation (DFG KU 3322/1–1, SFB936/C7), the European Union (ERC-2016-StG-Self-Control-677804) and the Jacobs Foundation (JRF 2016–2018). FN has been funded by a Heisenberg grant from the German Science Foundation (NE 1383/14–1).
Additional information
Competing interests
Christian Bu¨chel: Reviewing editor,eLife. Tobias Banaschewski: Has served as an advisor or consul-tant to Bristol-Myers Squibb, Desitin Arzneimittel, Eli Lilly, Medice, Novartis, Pfizer, Shire, UCB, and Vifor Pharma; he has received conference attendance support, conference support, or speaking fees from Eli Lilly, Janssen McNeil, Medice, Novartis, Shire, and UCB; and he is involved in clinical trials conducted by Eli Lilly, Novartis, and Shire; the present work is unrelated to these relationships. The other authors declare that no competing interests exist.
Funding
Funder Grant reference number Author
Horizon 2020 Framework
Pro-gramme Simone Ku¨hn
H2020 European Research Council
Simone Ku¨hn
Seventh Framework
Pro-gramme Simone Ku¨hn
Bundesministerium fu¨r Bildung
und Forschung Simone Ku¨hn
Max-Planck-Gesellschaft Open-access funding Simone Ku¨hn
Jacobs Foundation JRF 2016-2018 Simone Ku¨hn
Author contributions
Simone Ku¨hn, Software, Formal analysis, Funding acquisition, Visualization, Writing—original draft, Writing—review and editing; Anna Mascharek, Formal analysis, Writing—original draft, Writing— review and editing; Tobias Banaschewski, Arun Bodke, Uli Bromberg, Christian Bu¨chel, Erin Burke Quinlan, Sylvane Desrivieres, Herta Flor, Antoine Grigis, Hugh Garavan, Penny A Gowland, Andreas Heinz, Bernd Ittermann, Jean-Luc Martinot, Frauke Nees, Dimitri Papadopoulos Orfanos, Luise Poustka, Sabina Millenet, Juliane H Fro¨hner, Michael N Smolka, Henrik Walter, Robert Whelan, Data curation, Writing—review and editing; Tomas Paus, Ju¨rgen Gallinat, Data curation, Writing—original draft, Writing—review and editing; Gunter Schumann, Conceptualization, Data curation, Writing— review and editing; Ulman Lindenberger, Data curation, Formal analysis, Writing—review and editing
Author ORCIDs
Simone Ku¨hn https://orcid.org/0000-0001-6823-7969 Anna Mascharek https://orcid.org/0000-0001-7923-080X Christian Bu¨chel https://orcid.org/0000-0003-1965-906X
Dimitri Papadopoulos Orfanos https://orcid.org/0000-0002-1242-8990 Ulman Lindenberger https://orcid.org/0000-0001-8428-6453
Ethics
Human subjects: Written informed consent was obtained from all participants as well as from their legal guardians. The adolescents were recruited from secondary schools. The study was approved by the local ethics committees (in Germany this was accomplished by the medical ethics committee of the University of Heidelberg, reference number: 2007-024N-MA) and approved by the head teachers of the respective schools.
Decision letter and Author response
Decision letterhttps://doi.org/10.7554/eLife.44056.010 Author responsehttps://doi.org/10.7554/eLife.44056.011
Additional files
Supplementary files .Transparent reporting formDOI: https://doi.org/10.7554/eLife.44056.008
Data availability
This study uses human brain data which cannot be completely de-identified. Moreover, it was not part of the written consent of the participants for the data to be publicly shared. Researchers may access the dataset through a request to the IMAGEN consortium: https://imagen-europe.com/ resources/imagen-project-proposal/.
References
Babor TF, Higgins-Biddle JC. 2001.The Alcohol Use Disorders Identification Test. World Health Organization. Boecker-Schlier R, Holz NE, Hohm E, Zohsel K, Blomeyer D, Buchmann AF, Baumeister S, Wolf I, Esser G,
Schmidt MH, Meyer-Lindenberg A, Banaschewski T, Brandeis D, Laucht M. 2017. Association between pubertal stage at first drink and neural reward processing in early adulthood.Addiction biology22:1402–1415. DOI: https://doi.org/10.1111/adb.12413,PMID: 27345375
Brain Development Cooperative Group. 2012. Total and regional brain volumes in a population-based normative sample from 4 to 18 years: the NIH MRI study of normal brain development.Cerebral Cortex22:1– 12.DOI: https://doi.org/10.1093/cercor/bhr018,PMID: 21613470
Casanova R, Srikanth R, Baer A, Laurienti PJ, Burdette JH, Hayasaka S, Flowers L, Wood F, Maldjian JA. 2007. Biological parametric mapping: A statistical toolbox for multimodality brain image analysis.NeuroImage34: 137–143.DOI: https://doi.org/10.1016/j.neuroimage.2006.09.011,PMID: 17070709
Dager AD, Anderson BM, Rosen R, Khadka S, Sawyer B, Jiantonio-Kelly RE, Austad CS, Raskin SA, Tennen H, Wood RM, Fallahi CR, Pearlson GD. 2014. Functional magnetic resonance imaging (fMRI) response to alcohol pictures predicts subsequent transition to heavy drinking in college students.Addiction109:585–595. DOI: https://doi.org/10.1111/add.12437,PMID: 24304235
Durston S, Hulshoff Pol HE, Casey BJ, Giedd JN, Buitelaar JK, van Engeland H. 2001. Anatomical MRI of the developing human brain: what have we learned?Journal of the American Academy of Child and Adolescent Psychiatry40:1012–1020.DOI: https://doi.org/10.1097/00004583-200109000-00009,PMID: 11556624 Goddings AL, Mills KL, Clasen LS, Giedd JN, Viner RM, Blakemore SJ. 2014. The influence of puberty on
subcortical brain development.NeuroImage88:242–251.DOI: https://doi.org/10.1016/j.neuroimage.2013.09. 073,PMID: 24121203
Goodkind M, Eickhoff SB, Oathes DJ, Jiang Y, Chang A, Jones-Hagata LB, Ortega BN, Zaiko YV, Roach EL, Korgaonkar MS, Grieve SM, Galatzer-Levy I, Fox PT, Etkin A. 2015. Identification of a common neurobiological substrate for mental illness.JAMA Psychiatry72:305–315.DOI: https://doi.org/10.1001/jamapsychiatry.2014. 2206,PMID: 25651064
Goodman R, Ford T, Richards H, Gatward R, Meltzer H. 2000. The development and Well-Being assessment: description and initial validation of an integrated assessment of child and adolescent psychopathology.Journal of Child Psychology and Psychiatry41:645–655.DOI: https://doi.org/10.1111/j.1469-7610.2000.tb02345.x, PMID: 10946756
Heinz A. 2002. Dopaminergic dysfunction in alcoholism and schizophrenia–psychopathological and behavioral correlates.European Psychiatry17:9–16.DOI: https://doi.org/10.1016/S0924-9338(02)00628-4,PMID: 1191 8987
Jacobus J, Tapert SF. 2013. Neurotoxic effects of alcohol in adolescence.Annual Review of Clinical Psychology
9:703–721.DOI: https://doi.org/10.1146/annurev-clinpsy-050212-185610,PMID: 23245341
Kievit RA, Davis SW, Mitchell DJ, Taylor JR, Duncan J, Henson RN, Cam C, Cam-CAN Research Team. 2014. Distinct aspects of frontal lobe structure mediate age-related differences in fluid intelligence and multitasking. Nature communications5:5658.DOI: https://doi.org/10.1038/ncomms6658,PMID: 25519467
Koob G, Kreek MJ. 2007. Stress, dysregulation of drug reward pathways, and the transition to drug dependence. American Journal of Psychiatry164:1149–1159.DOI: https://doi.org/10.1176/appi.ajp.2007.05030503, PMID: 17671276
Ku¨hn S, Witt C, Banaschewski T, Barbot A, Barker GJ, Bu¨chel C, Conrod PJ, Flor H, Garavan H, Ittermann B, Mann K, Martinot JL, Paus T, Rietschel M, Smolka MN, Stro¨hle A, Bru¨hl R, Schumann G, Heinz A, Gallinat J, IMAGEN Consortium. 2016. From mother to child: orbitofrontal cortex gyrification and changes of drinking behaviour during adolescence.Addiction Biology21:700–708.DOI: https://doi.org/10.1111/adb.12240, PMID: 25913102
Ku¨hn S, Du¨zel S, Eibich P, Krekel C, Wu¨stemann H, Kolbe J, Martensson J, Goebel J, Gallinat J, Wagner GG, Lindenberger U. 2017. In search of features that constitute an "enriched environment" in humans: Associations between geographical properties and brain structure.Scientific Reports7:11920.DOI: https://doi.org/10.1038/ s41598-017-12046-7,PMID: 28931835
Little RJA, Rubin DB. 1987.Statistical Analysis with Missing Data. New York: John Wiley and Sons.
Madhyastha T, Peverill M, Koh N, McCabe C, Flournoy J, Mills K, King K, Pfeifer J, McLaughlin KA. 2018. Current methods and limitations for longitudinal fMRI analysis across development.Developmental Cognitive
Neuroscience33:118–128.DOI: https://doi.org/10.1016/j.dcn.2017.11.006,PMID: 29196032
McArdle JJ, Hamgami F, Jones K, Jolesz F, Kikinis R, Spiro A, Albert MS. 2004. Structural modeling of dynamic changes in memory and brain structure using longitudinal data from the normative aging study.The Journals of Gerontology Series B: Psychological Sciences and Social Sciences59:P294–P304.DOI: https://doi.org/10.1093/ geronb/59.6.P294,PMID: 15576857
Muthen BO. 2001.Two-Part Growth Mixture Modeling. University of California.
Nees F, Tzschoppe J, Patrick CJ, Vollsta¨dt-Klein S, Steiner S, Poustka L, Banaschewski T, Barker GJ, Bu¨chel C, Conrod PJ, Garavan H, Heinz A, Gallinat J, Lathrop M, Mann K, Artiges E, Paus T, Poline JB, Robbins TW, Rietschel M, et al. 2012. Determinants of early alcohol use in healthy adolescents: the differential contribution of neuroimaging and psychological factors.Neuropsychopharmacology37:986–995.DOI: https://doi.org/10. 1038/npp.2011.282,PMID: 22113088
Norman AL, Pulido C, Squeglia LM, Spadoni AD, Paulus MP, Tapert SF. 2011. Neural activation during inhibition predicts initiation of substance use in adolescence.Drug and Alcohol Dependence119:216–223.DOI: https:// doi.org/10.1016/j.drugalcdep.2011.06.019,PMID: 21782354
Olsen MK, Schafer JL. 2001. A Two-Part Random-Effects model for semicontinuous longitudinal data.Journal of the American Statistical Association96:730–745.DOI: https://doi.org/10.1198/016214501753168389
Ostby Y, Tamnes CK, Fjell AM, Westlye LT, Due-Tønnessen P, Walhovd KB. 2009. Heterogeneity in subcortical brain development: A structural magnetic resonance imaging study of brain maturation from 8 to 30 years. Journal of Neuroscience29:11772–11782.DOI: https://doi.org/10.1523/JNEUROSCI.1242-09.2009,PMID: 1 9776264
Ritchie SJ, Booth T, Valde´s Herna´ndez MD, Corley J, Maniega SM, Gow AJ, Royle NA, Pattie A, Karama S, Starr JM, Bastin ME, Wardlaw JM, Deary IJ. 2015. Beyond a bigger brain: Multivariable structural brain imaging and intelligence.Intelligence51:47–56.DOI: https://doi.org/10.1016/j.intell.2015.05.001,PMID: 26240470 Schumann G, Loth E, Banaschewski T, Barbot A, Barker G, Bu¨chel C, Conrod PJ, Dalley JW, Flor H, Gallinat J,
Garavan H, Heinz A, Itterman B, Lathrop M, Mallik C, Mann K, Martinot JL, Paus T, Poline JB, Robbins TW, et al. 2010. The IMAGEN study: reinforcement-related behaviour in normal brain function and
psychopathology.Molecular Psychiatry15:1128–1139.DOI: https://doi.org/10.1038/mp.2010.4, PMID: 21102431
Squeglia LM, Rinker DA, Bartsch H, Castro N, Chung Y, Dale AM, Jernigan TL, Tapert SF. 2014. Brain volume reductions in adolescent heavy drinkers.Developmental Cognitive Neuroscience9:117–125.DOI: https://doi. org/10.1016/j.dcn.2014.02.005,PMID: 24632141
Squeglia LM, Ball TM, Jacobus J, Brumback T, McKenna BS, Nguyen-Louie TT, Sorg SF, Paulus MP, Tapert SF. 2017. Neural predictors of initiating alcohol use during adolescence.American Journal of Psychiatry174:172– 185.DOI: https://doi.org/10.1176/appi.ajp.2016.15121587,PMID: 27539487