Bulletin of the New Zealand Society for Earthquake Engineering, Vol. 48, No. 3, September 2015
1
Corresponding Author, Ph. D. Candidate, Department of Civil and Natural Resources, University of Canterbury, Private Bag 4800, Christchurch, [email protected]
2
Professor, Department of Civil and Natural Resources, University of Canterbury, Private Bag 4800, Christchurch, Christchurch, [email protected] (Member)
3
Associate Professor, Department of Civil and Natural Resources, University of Canterbury, Private Bag 4800, Christchurch, Christchurch, [email protected] (Member)
ANALYTICAL SIMUATION OF SEISMIC COLLAPSE OF RC FRAME
BUILDINGS
Mohammad E. Koopaee
1, Rajesh P. Dhakal
2and
Gregory MacRae
3(Submitted March 2015; Reviewed June 2015; Accepted July 2015) ABSTRACT
Application of a fibre-element nonlinear modelling technique for seismic collapse capacity assessment of RC frame buildings in comparison with conventional lumped plasticity models is investigated in this paper. Constitutive material models of concrete and steel for fibre elements are adopted to enable simulation of the loss in vertical load carrying capacity of structural columns. Inclusion of the nonlinear second order 𝑃 − ∆ effects accelerated by degrading behaviour of steel and concrete materials in the fibre model allows prediction of the sidesway mode of collapse. The model is compared with nonlinear lumped plasticity models in which stiffness and strength degradation is replicated through degrading parameters in structural components. Static cyclic analyses of an example cantilever column and a portal frame indicate that the variation of axial loads in columns may result in accelerated degradation and failure of structural components which is not taken into account by lumped plasticity models. Moreover, incremental dynamic analysis of a ten-storey RC frame shows that the lumped plasticity model may overestimate building collapse capacity when vertical failure of structural components occurs prior to sidesway instability.
INTRODUCTION
As collapse of buildings is the primary source of casualties in earthquakes, protection against collapse has been explicitly stated as an important objective of seismic design codes for many years. Nevertheless, except for some recent guidelines, such as [1], the majority of building codes and guidelines have been silent on methods to quantify collapse probability of structural systems. The lack of explicit, reliable methods to quantify collapse creates a burden to the application of probabilistic performance-based seismic design methods, to understand the necessity and significance of modern code requirements, as well as to development and adoption of contemporary seismic systems and components. In response to the need for methods to quantify collapse potential of buildings, several studies in the last decade have been devoted to collapse potential prediction of buildings [2-7]. These studies have generally been focused on three aspects of collapse assessment: (i) structural modelling, (ii) selection of ground motions for collapse assessment and (iii) uncertainty estimations. While the significance of each aspect of the collapse assessment is acknowledged, this paper concentrates on the improvement of the structural modelling for prediction of the collapse probability of buildings.
Collapse of a building during and shortly after an earthquake is the consequence of loss of the building’s structural system integrity due to excessive deformation or force demand initiated in one, or several, component(s) of the building’s structural system. Excessive seismic demand triggers strength and stiffness deterioration in structural components and may lead to partial or complete collapse of buildings. Observations of collapsed buildings in past earthquakes have shown that collapse of buildings is generally due to the following modes of structural failure: (i) sidesway collapse and (ii) vertical collapse [8]. Sidesway collapse is the consequence of successive reduction of load-carrying capacity of structural components that are part of the building’s lateral load-resisting
system, to the extent that second-order 𝑃 − ∆ effects accelerated by component deterioration overcome gravity load resistance. In contrast, vertical collapse is the result of direct loss of gravity load-carrying capacity in one or several structural components. Both modes of structural collapse, particularly in modern structures, occur in a highly nonlinear range which requires advanced structural models to simulate the failure phenomena.
Most of the studies on the development of structural models for simulation of collapse consider the modelling of sidesway collapse which is characterised by deterioration of lateral stiffness and strength at large drifts. Experimental studies have shown that hysteretic behaviour of structural components depends upon numerous structural parameters that affect the deformation and energy dissipation characteristics which are challenging to model objectively. Research on the development of reliable structural models, by introduction of improved hysteretic models and tools, dates back to many years ago. A summary of the advancements in the collapse simulation of structural systems and tools is presented in [8]. Moreover, a summary of various hysteresis models and their pros and cons can be found in [5, 9-11].
(http://nisee.berkeley.edu/spd) for RC components [15], and in part for steel structures at SAC database. FEMA-356 [16] provides the related information for both RC and steel components which can be used to generate envelope curves of the hysteretic models. Nevertheless, these documents do not account for hysteretic deterioration parameters which are important for collapse assessments. Haselton et al. [17] and Lignos et al. [9, 10, 5, 11] have presented a database of model parameters based on a wide range of experimental tests to estimate the median and the dispersion of IMK parameters which includes the deterioration parameters.
Although these advancements on characterization and quantification for lumped plasticity modelling parameters have resulted in a smooth method to model frame structures (by lumping the inelastic deformation solely at rotational springs at the ends of members) to predict nonlinear response of structures during earthquakes, they suffer from some nontrivial limitations. One of these limitations is the requirement for the model parameters to be calibrated for each individual component based on experimental data or generic expressions proposed in the literature. Another limitation, which interrogates the merit of these models for collapse assessment, is that they can only capture the sidesway mode of collapse and other modes of collapse are generally ignored. To overcome these limitations, attempts have been made to approximately incorporate other modes of structural failure into these models [18-21]. Most of these studies propose adding other elements (e.g. springs) in addition to the lumped plastic hinges in order to take the shear and axial load induced failure modes into account. For instance, Elwood and Moehle [22] used a fibre-element model to capture the axial load in the middle of a component and connected it to shear elements and lumped plasticity hinges at the ends to capture the moment and shear failures, respectively. Furthermore, in order to estimate seismic collapse of non-ductile RC buildings, Baradaran Shoraka et al. [23] recently proposed the use of a Limit State material model, initially proposed by Elwood [24], which uses predefined empirical equations to estimate the points of shear and axial failure based on the drift demand on the columns. Although these models suggest improvements over the sole use of lumped plastic hinges at the ends of structural
components, similar to the original lumped plasticity models, they require precise calibration of the modelling parameters. In this paper, a fibre element nonlinear model is proposed for simulation of structural collapse of RC frame buildings. The model incorporates variation of axial loads throughout the analysis while the shear failure of elements is not explicitly accounted. The efficiency of the proposed approach is investigated by comparison of the cyclic hysteretic response of a single-degree-of-freedom (SDOF) system, a typical portal frame and a nine-storey case study building with the corresponding predictions obtained by the conventional lumped plasticity models.
FIBRE-ELEMENT MODELLING FOR COLLAPSE ASSESSMENT
Nonlinear Fibre-Element Modelling Technique
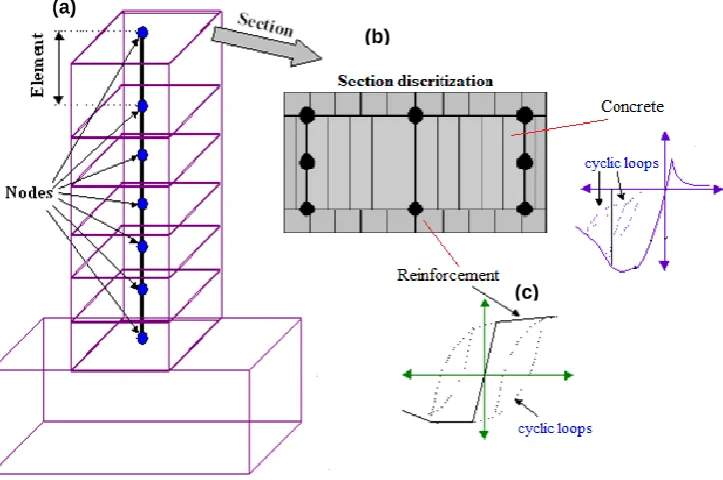
Implementation of a nonlinear fibre modelling technique is schematically illustrated in Fig 1. In this method, each element is represented using a single line (Fig 1a). The member cross section is divided into many cells (Fig 1b), and the strain of each cell is calculated based on the Euler-Kirchoff’s hypothesis, i.e., plane section remains plane after bending. For each fibre/cell along the axis of the element, response is calculated using the material constitutive models representing the local behaviour (Fig. 1c).
[image:2.595.117.479.529.769.2]The reliability of a fibre-based analytical prediction of structural response is almost entirely dependent on the accuracy of the material constitutive models. Therefore, rather than calibration of constitutive models at a section or member level as in lumped plasticity models, the focus in fibre-based analysis is to choose stress-strain relationships of materials which are representative of true response of materials in any section. While choosing the material models care should be taken to ensure that important material response phases (such as cracking, spalling and crushing of concrete and yielding, hardening, buckling and breaking of reinforcement) are accounted for to capture the gradual deterioration of member response.
Figure 1: Schematic illustration of fibre-element modelling of RC elements. (a)
(b)
Collapse Mechanism due to Loss of Vertical Load Carrying Capacity
Collapse of a building occurs due to instability caused by local and/or global failure of structural components. At the component/element level, failure occurs due to failure of a critical section, which is in turn the result of material strain failure.
In an RC element subjected to monotonically increasing flexural action, cover concrete first loses its stress carrying capacity in the critical section once strain in the unconfined cover concrete equals spalling strain (0.003-0.004). Following the spalling of cover concrete, the section resistance will rely increasingly on the confined core concrete in addition to the longitudinal reinforcing bars. If the compression bars are not well restrained against buckling, or if adequate transverse reinforcement is not provided, the critical section may fail in shear, or buckling of longitudinal bars may occur before the core concrete reaches its crushing strain. In contrast, in a well confined section, confinement of core concrete allows longitudinal tension bars to enter the strain hardening region. In such sections, failure of the section eventually occurs due to failure of the core concrete. If the section is over reinforced, this failure occurs before yielding of longitudinal bars, whereas in under-reinforced sections, yielding of longitudinal bars takes place before crushing of the core concrete.
During cyclic loading of a well confined section, in addition to the failure modes induced by monotonic loading, failure may also occur due to strength deterioration of the cracked concrete and longitudinal bars which can be caused by buckling of compression bars as well as fatigue of steel bars before the core concrete reaches its ultimate strength.
This study aims to provide a structural model that enables simulation of collapse mechanism more realistically (i.e. consistent with the deterioration of materials observed in experiments). In a fibre-based nonlinear structural model, collapse of a section occurs because of the failure of the majority of fibres in the section. Based on the discussion above, a proper fibre model for simulating collapse has to contain material properties that can capture crushing of cover concrete and core concrete based on the confinement configuration, and strength degradation of reinforcing bars in cyclic loading caused by buckling and fatigue. In the following sections, constitutive material models to capture these characteristics will be discussed. The material models are then used to assess collapse potential of a case study RC moment frame building.
Adopted Fibre Models for Concrete and Steel
Confined and Unconfined Concrete
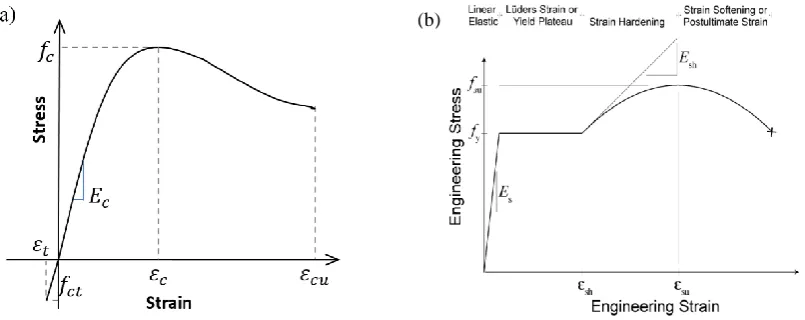
In order to simulate collapse of RC buildings, PEER’s open source structural analysis and simulation tool OpenSees [25] is utilized. In OpenSees, several material properties have been implemented which enable simulation of structural collapse. In this study, Popovic’s [26] stress-strain envelope (shown in Fig. 2a) is used for confined and unconfined concrete fibres. This model requires specification of seven parameters to control monotonic behaviour of the model for both confined and unconfined concrete: concrete compressive strength in 28 days 𝑓𝑐, concrete strain at maximum strength 𝜀𝑐, concrete strain at crushing strength 𝜀𝑐𝑢, initial stiffness 𝐸𝑐, maximum tensile strength of concrete 𝑓𝑐𝑡, ultimate tensile strain of concrete 𝜀𝑡, and an exponential curve parameter to define the residual stress β (optional). The hysteretic behaviour of the model used in the study is shown in Fig. 2c. Parameters of the model can be obtained by a standard uniaxial concrete cylinder test. Alternatively, for practical purposes, compressive strength for unconfined concrete at 28 days can be obtained from the design documents of the structure. Mander et al. [27] have proposed a widely accepted theoretical stress-strain model for concrete, depending on the confinement configuration, which can be used to quantify the maximum stress and strain of confined concrete. Approximate equations have been suggested in building codes for the initial stiffness of concrete. If 𝐸𝑐= 4734√𝑓𝑐 (in MPa) is used to estimate initial stiffness, then Popovic's envelope model will be identical to the model proposed by Mander et al. [27]. As will be shown later in the paper, collapse capacity is directly dependent on the strain at crushing value, which is controlled by the confinement configuration of critical sections. Theoretical values for strain at the crushing point have been proposed in the literature depending on the number, size, and distance of transverse bars in the section which can be used in the model (e.g. [28]). Based on the proposed values in the literature and experience of the authors, a strain value, 𝜀𝑐𝑢, of 0.03 is used for crushing of confined concrete detailed as per the New Zealand Concrete Standard [29]. Reinforcing Steel Model
For steel fibres in RC sections, a generic phenomenological material model developed by Kunnath et al. [30], capturing strength degradation due to fatigue in cyclic loading as well as buckling of reinforcing bars in compression, is utilized. Fig. 2b illustrates a typical envelope curve of the reinforcing steel model. The envelope curve is based on the Chang and Mander [31] uniaxial steel model.
[image:3.595.93.496.620.780.2]Figure 2: Adopted constitutive models of concrete and steel.
The degrading behaviour of a RC section is influenced by buckling of longitudinal steel bars in compression. Buckling of compression bars in the model is incorporated based on the model proposed by [32, 33]. Fig. 2d illustrates a typical hysteretic curve of the reinforcing steel model. Fatigue parameters are based on the Coffin-Manson equation for plastic strain amplitude. The softening region (strain beyond the ultimate stress point) shown in Fig. 2b is a localization effect due to necking and is a function of the gauge length used during measurement. This geometric effect is ignored in this simulation; it is assumed that there is no softening in the natural stress space. Because the simulation always converts back to the engineering stress space, some softening will still be observed in the tension response due to the reduction in cross- sectional area resulting from necking; however this will be much smaller than that shown in the original backbone curve proposed by [31]).
Due to the nature of the steel model used herein, steel reinforcement failure may occur due to buckling of compression bars or fatigue of longitudinal bars after several cycles of loading, but pure tensile fracture (i.e. 𝜀𝑠𝑢 ~0.1-0.2) is not modelled because the steel strain is maintained beyond the peak strain. As will be shown this does not influence the
collapse simulations in this study because concrete fibres crush, and reach zero stress, prior to the steel bars reaching their peak strain; thereby resulting in failure of the section. A peak strain of 𝜀𝑠𝑢= 0.1 is used in this study as a conservative estimate based on the experience of the authors with the steel bars used in the New Zealand construction industry.
OBSERVATION OF COLLAPSE MECHANISM IN THE STRUCTURAL MODEL
The fibre element model described in the previous section is implemented in Opensees to perform nonlinear response history analysis of a case study building. The case study building is the 10-storey New Zealand Red Book building [34], which acts as a design example of the New Zealand concrete code [29].
Fig. 3 shows the plan and elevation views of the building layout. The primary lateral load carrying system consists of four one-way perimeter moment resisting frames which are three bays long. Vertical loads are transferred primarily through interior columns with gravity beams supporting one-way floor units. Further details of the structural properties and design details can be found in [34].
Figure 3: Plan and elevation view of the case study building.
[image:4.595.73.527.500.778.2]Conforming ductile design requirements of the case study building enables the structure to sustain large inter-storey drift demands before sidesway collapse of the structure. Nevertheless, local failure of structural components due to the loss in vertical load carrying capacity is likely to occur in several parts of the structure. Failure of critical components may lead to global collapse of the structure.
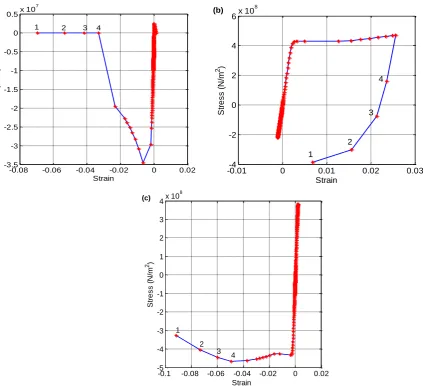
To illustrate this phenomenon, Fig. 4 shows material hysteretic response of a critical column, marked up as “A” in Fig. 3, subjected to an example ground motion (GM) which causes structural collapse. The selected ground motion is the Loma Prieta 1989 earthquake and is scaled to 𝑆𝑎(𝑇1) = 1.3𝑔 for which the structural collapse takes place. The example GM is chosen such that it can properly depict the structural failure. The full response of the structure for this ground motion is scaled to smaller values and will be shown later in the paper. In this GM, initial cycles of loading are relatively small resulting in linear response in the structure. An abrupt increase in the magnitude of GM then leads to sudden increase of stress in the critical section and subsequent failure. Fig. 4a shows the stress-strain history of the section for a fibre on the left side of the cross section. Fig 4b and 4c depict the stress-strain history of steel fibres on the right and left side of the cross section, respectively.
In order to explain the collapse mechanism, the last four response points before collapse have been labelled in the figure as 1 to 4. As can be seen, failure of the section commences when the strain in the concrete fibre exceeds the crushing strain, i.e. assumed 0.03 in this example. By failure of the concrete fibre in compression, the section starts loosing capacity to carry compression loads (label 4). In order for the structure to continue sustaining the vertical loads, compression stress is transferred to inner concrete fibres and the steel bars. The column continues to carry vertical loads (labels 4 to 2) until majority of the concrete fibres lose their compression capacity (label 1) when all the vertical loads are transferred to the steel bars. Eventually, the section fails due to inability of the reinforcing bars to carry the compression loads. It can be seen that in the last couple of steps before collapse, steel fibres on the opposite sides of the cross section are subjected to compressive stress.
The failure mechanism observed in the structural model implies that collapse of the building occurred due to the loss in vertical load carrying capacity of the structure rather than lack of structural strength to resist destabilizing 𝑃 − ∆ effects which is the only collapse mode considered by conventional lumped plasticity models. The structural failure starts when the confined concrete strain exceeds the crushing limit which is dependent on confinement configuration of the structural components. If very close confinement is provided in the structural components, particularly at the critical plastic hinge regions, the structure may be able to sustain large displacements and collapse may occur due to destabilizing
𝑃 − ∆ effects. However, loss of vertical load carrying capacity of critical members is a very likely source of structural collapse and cannot be ignored in modelling structures for analytical simulation of collapse.
COMPARISON OF FIBRE AND LUMPED PLASTICITY MODELLING FOR COLLAPSE
SIMULATION
Previous sections of the paper were mainly concentrated on the prediction of the vertical collapse mode of buildings and capability of the fibre model to capture loss in vertical load carrying capacity of structural components. This section deals with the investigation of the structural model in predicting a sidesway mode of collapse. As noted earlier, sidesway
collapse is the only mode of structural failure which can be explicitly estimated by lumped plasticity models. To evaluate the efficiency of the proposed fibre model, a comparison of cyclic structural response between the fibre element model and lumped plasticity models is conducted in this section. Response comparisons are started with the estimation of cyclic hysteretic response of a single-degree-of-freedom (SDOF) system followed by a one-storey portal frame where axial load varies in two different columns of the structure. Finally, the collapse capacity of the ten-storey case study building, in terms of spectral acceleration at the fundamental period, is compared with the two structural models.
Single Degree of Freedom Cantilever Column
In order to scrutinise the structural response prediction of the proposed structural model, hysteretic response of a 4m high RC column subjected to static cyclic loading is investigated in this section. An increasing lateral load is applied at the top of the column until the column top drift reaches to 1% of its height. The load is then reversed and increased until the same level of drift is reached in the opposite direction. This fully reversed cyclic loading protocol is repeated by increasing the peak drift by 1% increments in successive cycles until the column collapses. The cross section and reinforcement configuration of the column is the same as the columns of the case study building described in Section 3 (i.e. 460 mm x 900 mm with 1% longitudinal reinforcement).
Nonlinear behaviour of the column is modelled with two different approaches. In the first model, nonlinearity occurs at concentrated lumped plastic hinges at the bottom of the column. Alternatively, distributed plasticity is modelled along the height of the column using the fibre element model with four integration points. Material parameters of the fibre model are defined in Section 0. For the lumped plastic hinge element the modified Ibarra-Medina Krawinkler hysteretic model [11] is utilized to account for hysteretic stiffness and strength degradation of structural components. To make a consistent comparison between the two structural models, yield strength and initial un-cracked elastic stiffness of the column section is computed by the fibre model and is used for the hinge element.
Other parameters of the hinge model can be obtained by the generic equations proposed in literature based on experimental test results. Different values for the parameters of the IMK model have been proposed in the literature. The difference between the proposed values of parameters stems from differences in test setup, varying dimensions and detailing of test specimens, varying loading protocols, as well as a statistical approach to fit the data to a distribution. It is however noted that a small change in the structural parameters may vary the estimated collapse risk of buildings to a considerable extent as elaborated in [35, 36] . For instance, the distribution of plastic hinge deformation for RC beams based on the test results conducted by [5] suggests that the median plastic hinge deformation, θp, amounts to 0.05 with a standard deviation of β = 0.42 for RC beams. In contrast, the information based on the database provided by Haselton et al. [17] suggests θp= 0.066 and a standard deviation of 0.54 for similar RC beams. For the case study herein column parameters of the lumped plasticity model are computed based on the generic equations in Haselton et al. [17].
Degrading post-peak response of the structure eventually leads to zero strength of the component resulting in collapse. The column is well-confined resulting in a high plastic rotation capacity, 𝜃𝑃, of 0.06. The strength degradation in this case is
[image:6.595.83.507.137.523.2]not too severe and the degradation phase starts at a large drift; but moderately confined members can collapse due to limited plastic deformation capacity and rapid reduction of strength.
Figure 4: Stress-strain response of a fibre in the critical section of the case study building subjected to an example earthquake; a) Confined concrete fibre; b) Reinforcing steel fibre in tension; c) Reinforcing steel in compression.
Figure 5: Hysteretic cyclic response of the single degree of freedom column; a) Hysteretic response of the column using lumped plasticity model up to 10% drift; b) Comparison of fibre and lumped plasticity modelling up to 2.5% drift.
-0.1 -0.05 0 0.05 0.1
-200 -150 -100 -50 0 50 100 150 200
Drift Ratio (%)
B
as
e
S
h
ea
r
(K
N
)
-0.03 -0.02 -0.01 0 0.01 0.02 0.03
-200 -150 -100 -50 0 50 100 150 200
Drift Ratio (%)
B
as
e
S
h
ea
r
(K
N
)
Fiber Model Hinge Model
-0.01-4 0 0.01 0.02 0.03
-2 0 2 4 6x 10
8
Strain
S
tr
e
s
s
(
N
/m
2 )
(b)
1
2 3
4
-0.08 -0.06 -0.04 -0.02 0 0.02
-3.5 -3 -2.5 -2 -1.5 -1 -0.5 0
0.5x 10
7
Strain
S
tr
e
ss
(
N
/m
2 )
4
(a)
2 3
1
-0.1 -0.08 -0.06 -0.04 -0.02 0 0.02
-5 -4 -3 -2 -1 0 1 2 3 4x 10
8
Strain
S
tr
e
s
s
(
N
/m
2)
3 4
2 1
(c)
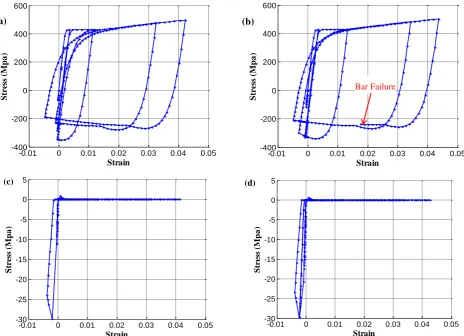
[image:6.595.57.507.585.731.2]Fig. 5b shows a comparison of cyclic structural response of the column estimated by the two different nonlinear modelling techniques. The comparison is shown up to 2.5% drift where the fibre element model indicates termination of the analysis. Comparison of the response obtained by the two structural models up to 2% drift shows a relatively good agreement of the two envelopes. The main difference between the two responses lies on the cyclic loops, which is due to the constant stiffness used throughout the analysis in the hinge model. Beyond 2% drift, the difference between the structural models becomes more apparent as the strength degradation of the column commences in the fibre model, whereas the hinge model continues to predict mildly increasing strength. In order to further scrutinise the failure mechanism in the model, the stress-strain hysteretic response of various fibres in the column section are shown in Fig. 6. The stress-strain history of the bars in the opposite sides of the section, i.e. right and left sides, are depicted in Fig. 6a and 6b, respectively. Fig. 6c and 6d illustrate the stress-strain history of the two confined concrete fibres on the right and left side of the section respectively. It is shown that at the early stages of the analysis, concrete fibres sustain compression along with steel bars. However, despite the observations in Fig. 4, where the same section was under the axial load of a ten storey building, the concrete fibres do not reach their compression strain capacity but rather fail in tension. The axial force on the column is caused by the movement of the column leading to the same strain in compression and tension in concrete and steel fibres. Since the compression strain capacity of concrete fibres is small they start failing in small ranges of drifts. As the load reverses, failure of concrete in tension in both sides of the section takes place. Following the commencement of failure of the concrete fibres in tension, steel bars sustain the total loads applied on the structure. It is evident from Fig. 6c and 6d that the high levels of tensile strain in concrete results in circumstances where concrete fibres do not contribute in resisting the lateral load of the structure. The structure maintains the lateral loads by steel bars until the failure in compression or tension. These failures could be as a result of buckling from large compressive strain or fatigue due to several cycles of loading. Fig 6b indicates that, in this example, failure of the structure is due to the fatigue failure of the bars on the right side of the section. This implies that confinement of the concrete is not contributing to the lateral resistance of the structure. Nevertheless, confinement of the concrete has resulted in the selection of large values for plastic rotation capacity for the use in definition of lumped plasticity model which leads to prediction of the collapse in large drifts by the lumped plasticity model.
Portal Frame
One of the major limitations of nonlinear analysis using a lumped plasticity approach is that, as constitutive models have to be calibrated in advance, the effect of axial load variation (which is inevitable when a frame sways laterally) to the plastic hinge hysteretic response cannot be captured. This section further investigates the influence of the variation of axial load in hysteretic response of RC columns by comparison of the hysteretic response of the portal frame, shown in Fig. 7, with fibre and lumped plasticity nonlinear modelling. The portal frame consists of an elastic stiff beam and two nonlinear columns to be able to concentrate on the nonlinear behaviour of the columns with varying axial loads. The columns have a square section 400 mm×400 mm with 2.3% reinforcement symmetrically distributed around the perimeter of the section. The section is assumed to be well confined with stirrups of size 10 mm with a maximum 100
mm spacing along the height of the column.
Similar to the cantilever column, initial stiffness and flexural yield of the columns are computed by the fibre model and are used in defining the plastic hinge element parameters for a consistent comparison. Other parameters of the plastic hinge model are computed based on the generic equations in Haselton et al. [17].
Previous studies on the collapse of buildings based on lumped plasticity models show that minor changes in estimation of the parameters of plastic hinges result in remarkable changes in collapse probability of buildings [35, 36]. One of the key parameters in the IMK model in prediction of seismic collapse is the cyclic deterioration parameter, Λ, which controls cyclic strength and stiffness degradation rate of structural components. Fig. 8a illustrates cyclic hysteretic response of the columns obtained by a plastic hinge model using Λ = 3.25 calculated by the Haselton et al. [17] equations. As it is evident in the figure, intense confinement of the column section provides a large median value of Λ which implies a small cyclic degradation in the model. However, Lignos and Krawinkler [5] have suggested a median value of Λ = 1.0 with standard deviation of 0.77 for RC beams. In their work no value is reported for cyclic deterioration of RC columns. Test results indicate that due to the presence of axial loads cyclic degradation of columns occurs faster than beams, and hence, a smaller median value of Λ is expected for RC columns. Fig. 8b shows the cyclic hysteretic response of the portal frame columns assuming Λ = 0.5. It is seen that in this case the column reaches zero strength at 7% drift, whereas in the previous case even at 10% drift the column had more than 50% residual strength. This comparison illustrates the telling effect of the cyclic deterioration parameter on the predicted collapse capacity of RC columns which is in line with the findings of previous studies. As the purpose of this paper is not to calibrate the lumped plasticity models, different values of cyclic deterioration are used to compare the results of lumped plasticity model with the fibre model.
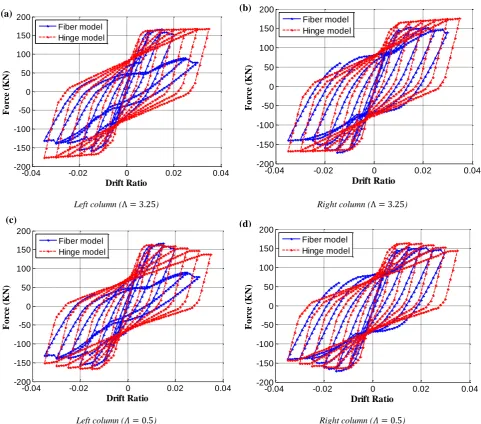
Fig. 9 compares cyclic hysteretic response of the portal frame columns obtained by the fibre model and the lumped plasticity model. In order to avoid biased comparison of structural response due to unrepresentative values of the deterioration parameter in the lumped plasticity model, two different values of the deterioration parameter, i.e. Λ = 3.25 and Λ = 0.5, are examined and shown in the figure. Because of the changes in axial load within loading reversals, the hysteretic response of the right and left columns vary in fibre model. Nevertheless, since the variation of axial loads is neglected in the plastic hinge model, the responses of the two columns predicted by lumped plasticity model are similar. As can be seen in the figure, responses of the two columns on the left and on the right predicted by the fibre model are similar up to 2% drift. Thereafter, the fibre model indicates abrupt strength degradation in the left column.
Assuming 𝛬 = 0.5 for the plastic hinge model represents a closer agreement between the two structural models particularly for the right column. However, the abrupt strength degradation of the column on the left column which stems from increasing the compression load is not captured by the plastic hinge model. Comparison of Fig. 8 and Fig. 9 assuming
Figure 6: Stress-Strain diagrams of RC column at 2.5% drift; a) Steel, left side; b) Steel, right side; c) Concrete left side; d) Concrete right side.
Figure 7: Case study portal frame.
The analyses results from the fibre model indicate that the frame continues to carry loads until reaching to -3.5% drift. In order to show the failure mechanism of the columns taken by the fibre model, the stress-strain hysteretic diagram of the steel bars for two columns of the frame, i.e. on the left and on the right, are shown in Fig 10. For each column, the stress-strain diagram at two locations of the critical section, i.e. left and right side of the section, are illustrated. In this figure, the stress-strain diagrams of concrete fibres are not shown for brevity. However, similar to the observations of the previous section shown for the cantilever column, tensile failure of the concrete fibres takes place in both columns at low drifts, leading to inefficiency of the confinement to increase strain capacity of the concrete. Response predictions of the frame depicted on Fig. 9 and Fig. 10b implies that when the structure attempts to reach 2.5% drift failure of reinforcing bars on the
right side of the left column violates balance of the forces in the frame and results in varying hysteretic response between the two columns. The abrupt degradation of the strength in the left column is more apparent in Fig. 11a where the moment-curvature diagrams for the two columns of the frame are superimposed. Failure of the bars in one side of the left column and abrupt degradation in strength places the structure on the verge of collapse. However, unloading along with the capacity of the other bars in the section results in continuation of loading up to 3% drift. The flat line on Fig. 10b shows the steps of the analysis following buckling of the bars on the right side of the left column section. The structure continues to undergo displacement on the right column up to -3.5% drift. The analysis then terminates prior to reaching +3.5% drift due to instability of the left column
-0.01 0 0.01 0.02 0.03 0.04 0.05
-400 -200 0 200 400 600
Strain
S
tr
es
s
(M
p
a
)
-0.01 0 0.01 0.02 0.03 0.04 0.05
-400 -200 0 200 400 600
Strain
S
tr
es
s
(M
p
a
)
-0.01 0 0.01 0.02 0.03 0.04 0.05
-30 -25 -20 -15 -10 -5 0 5
Strain
S
tr
es
s
(M
p
a
)
-0.01 0 0.01 0.02 0.03 0.04 0.05
-30 -25 -20 -15 -10 -5 0 5
Strain
S
tr
es
s
(M
p
a
)
(a) (b)
(c) (d)
[image:8.595.148.457.455.602.2]Figure 8:Cyclic hysteretic response of the portal frame using plastic hinge model; a) Lambda = 3.25 based on median value proposed by Haselton et al. (2008); b) Lambda = 0.5 ie. closer to values proposed by Lignos and Krawinkler (2012a).
.
Left column (Λ = 3.25) Right column (Λ = 3.25)
Left column (𝛬 = 0.5) Right column (𝛬 = 0.5)
Figure 9:Comparison of the hysteretic cyclic response of the portal frame column obtained by fibre and plastic hinge model; a) Left column 𝜦 = 𝟑. 𝟐𝟓; b) Right column 𝜦 = 𝟑. 𝟐𝟓; c) Left column 𝜦 = 𝟎. 𝟓; d) Right column 𝜦 = 𝟎. 𝟓.
-0.1 -0.05 0 0.05 0.1
-200 -150 -100 -50 0 50 100 150 200
Drift Ratio
F
o
r
c
e
(K
N
)
-0.08 -0.06 -0.04 -0.02 0 0.02 0.04 0.06
-200 -150 -100 -50 0 50 100 150 200
Drift Ratio
F
o
r
c
e
(K
N
)
-0.04 -0.02 0 0.02 0.04
-200 -150 -100 -50 0 50 100 150 200
Drift Ratio
F
o
rc
e
(K
N
)
Fiber model Hinge model
-0.04 -0.02 0 0.02 0.04
-200 -150 -100 -50 0 50 100 150 200
Drift Ratio
F
o
rc
e
(K
N
)
Fiber model Hinge model
-0.04 -0.02 0 0.02 0.04
-200 -150 -100 -50 0 50 100 150 200
Drift Ratio
F
o
rc
e
(K
N
)
Fiber model Hinge model
-0.04 -0.02 0 0.02 0.04
-200 -150 -100 -50 0 50 100 150 200
Drift Ratio
F
o
rc
e
(K
N
)
Fiber model Hinge model
(a)
(c) (d)
(b)
[image:9.595.56.538.307.731.2]Since the hysteretic behaviour of all the fibres on the critical section cannot be tracked, it is difficult to verify the complete collapse of the structure at the point of termination of the analysis in the program. However, it can be seen from Fig. 11 that the left column section has lost the majority of its strength prior to termination of the analysis. This confirms that the structural model has been able to simulate the condition of the
[image:10.595.56.538.152.537.2]collapse with a reasonable degree of accuracy. Fig 11b illustrates the variation of axial deflections at the top of the columns as the analysis proceeds It is shown in the figure that abrupt axial deflection of the left column coming from the failure of some of the bars in the section leads to the violation of symmetrical balance of the frame, and hence, a different response for the columns on each side of the frame.
Figure 10:Stress-Strain diagrams of RC columns at 3.5% drift; a) Left column, left side; b) Left column, right side; c) Right column, left side; d) Right column, right side.
.
Figure 11:Un-balanced response of the left and right columns of portal frame; a) Moment curvature diagram; b) variation of axial deflection in the analysis.
-5 0 5 10 15 20
x 10-3 -400
-300 -200 -100 0 100 200 300 400 500
Strain
S
tr
es
s
(M
p
a
)
-0.01 0 0.01 0.02 0.03
-400 -300 -200 -100 0 100 200 300 400 500
Strain
S
tr
es
s
(M
p
a
)
-0.01 0 0.01 0.02 0.03
-400 -200 0 200 400 600
Strain
S
tr
es
s
(M
p
a
)
-0.01 -0.005 0 0.005 0.01 0.015 0.02
-400 -200 0 200 400 600
Strain
S
tr
es
s
(M
p
a
)
-1 -0.5 0 0.5 1
x 10-4
-400 -300 -200 -100 0 100 200 300 400
Curvature
M
o
m
en
t
(K
N
.m
)
Left Column Right Column
-5 0 5 10 15 20
x 10-3
-200 -150 -100 -50 0 50 100
Axial Deflections (mm)
A
x
ia
l
Lo
a
d
(K
N
)
Left Col. Right Col. (a)
(d) (c)
(b)
Bar failure
(a)
[image:10.595.60.533.590.760.2]Ten-Storey RC Frame Building
[image:11.595.62.521.313.497.2]Structural response of the case study RC building descried in section 3 is further scrutinised in this section by conducting pushover and response history analysis using the lumped and distributed plasticity approaches discussed in the previous sections. Initial stiffness of nonlinear beams and columns for the lumped plasticity model are calculated by the fibre section analysis of structural components. Other parameters of the plastic hinge elements are computed by generic expressions proposed by Haselton et al. [17]. Since it was previously observed that cyclic deterioration parameters may be overestimated by using the median values suggested by Haleston et al. [17], the median minus one standard deviation of the deterioration parameter is used for beams and columns. Fig. 12a compares the pushover curve of the building obtained by the two structural models. To conduct the pushover analyses, a triangular load pattern in accordance with NZS 1170:2004 is used. As can be seen in the figure, a substantial disagreement is observed between the pushover curves of the two different structural models following the start of cracking of structural elements. This disagreement originates from the un-cracked definition of stiffness as well as the choice of
[image:11.595.177.420.534.706.2]plastic hinge parameters for the lumped plasticity model. Upon the commencement of cracking in the structural elements, the pushover curves start to deviate. A descending branch in the pushover curve of the lumped plasticity model is seen after 360mm displacement at the top of the building. This descending branch in controlled by the definition of plastic hinge capacity at the lumped plasticity model. In Fig. 12 the analysis is continued until structural collapse in the fibre model takes place, which is when the majority of fibres in the critical section fail to carry axial load as it was elaborated in section 3. Fig. 12b depicts structural response (in terms of inter-storey drift) before the occurrence of structural collapse. As can be seen in the figure, both models agree closely in prediction of structural response in terms of inter-storey drift ratio. However, at the point of collapse in the fibre model, which is due to the loss in vertical load carrying capacity, loading can still be continued according to the plastic hinge model. It is noted that the maximum inter-storey drift at the structural collapse takes place at the bottom floor as hinging develops at the critical section. This phenomenon occurs when the building is responding in the large nonlinear range.
Figure 12:Pushover analysis comparison of the case study RC building with plastic hinge and fibre element models.
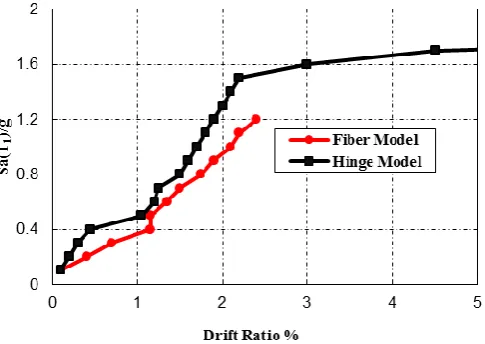
Figure 13:Incremental dynamic analysis of the case study building subjected to an example ground motion; a) Fibre model; b) Plastic hinge model.
Incremental dynamic analysis (IDA) [37] of the case study building subjected to an example ground motion with increasing level of 𝑆𝑎(𝑇1) was also carried out and the IDA curve is depicted in Fig. 13. This figure illustrates two
different modes of structural collapse, i.e. vertical and sidesway modes, predicted by the two structural models investigated herein. Using the fibre model, for this particular ground motion, collapse occurs at 𝑆𝑎(𝑇1) = 1.3𝑔 when the
0 0.1 0.2 0.3 0.4 0.5
0 2 4 6 8 10 12 14x 10
5 Pushover Curve
Roof Displacement (m)
B
as
e
S
h
ea
r
(N
)
Hinge Model Fiber Model
0 0.01 0.02 0.03 0.04
0 2 4 6 8 10
Inter-storey Drift Ratio
IDR
S
to
re
y
Hinge Model Fiber Model
stress-strain responses of concrete and reinforcing fibres in the critical section are in the condition shown in Fig. 4 which implies occurrence of the vertical mode of collapse. Meanwhile, the sidesway mode of collapse is predicted to take place at 𝑆𝑎(𝑇1) = 1.7𝑔 by the plastic hinge model. Since the case study building is comprised of columns with the same section, redistribution of the loads does not occur to a large extent and loss of the strength in the critical element results in collapse of the building. The difference between the predicted values of collapse capacity implies that the lumped plasticity model leads to overestimation of collapse capacity of structural systems in which the loss in vertical load carrying capacity of columns occurs prior to the sidesway mode of structural collapse.
CONCLUSIONS
Application of a fibre element model to predict the seismic collapse of RC buildings was proposed in this paper. Through analysis of a case study 10-storey RC frame building designed according to New Zealand standards, it was shown that the fibre element model enables simulation of structural failure due to the loss in vertical load carrying capacity of the columns. The model is also able to predict sidesway collapse by incorporating buckling and fatigue degradation of reinforcing bars. A comparison of the cyclic structural response obtained by the fibre model and conventional plastic hinge (i.e. lumped plasticity) model was carried out through a SDOF system, a single storey portal frame, and the case study 10-storey building. Findings of the research in this paper can be summarized as follows:
(i) A sidesway mode of collapse, as well as collapse due to failure in vertical load carrying capacity of buildings, can be simulated using fibre element modelling.
(ii) It was observed that variation of axial loads throughout cyclic loading greatly influences the hysteretic behaviour of the structure. Therefore, the seismic collapse capacity of RC moment resisting frames can be overestimated by using concentrated plastic hinge models, as the variation in axial forces in columns is normally neglected.
(iii) Estimation of the seismic collapse capacity of structural systems using plastic hinge models depends directly on the choice of structural parameters. The structural model parameters need to be defined at the component level and require precise calibration of structural elements. While confinement of the concrete results in the choice of large values for plastic hinge rotation, it may not be able to increase collapse capacity of columns in RC columns subjected to tension and may lead to an overestimation of seismic collapse capacity when generic equations are used.
It is believed that by using fibre-element models smaller values of dispersion in structural modelling for estimating the collapse probability of structural systems can be used. However, this issue is the topic of future research in this field. It is, in general, expected that findings of this paper on the benefits of the application of fibre element models for collapse simulation of RC frame buildings yields to an improved prediction of seismic collapse capacity of structures.
ACKNOWLEDGMENTS
The authors would like to thank Dr Brendon Bradley from University of Canterbury for his valuable advice in conducting this research. The constructive comments from the anonymous reviewers are also greatly appreciated.
REFERENCES
1 FEMA (2012). "Seismic Performance Assessment of Buildings, Volume 1 – Methodology”. FEMA P-58-1, Applied Technology Council for the Federal Emergency Management Agency, Washington, D.C.
2 Ibarra LF and Krawinkler H (2005). “Global Collapse of Frame Structures under Seismic Excitations”, Report No. TB 152, The John A Blume Earthquake Engineering Center, Stanford University, Stanford California.
3 Krawinkler H, Zareian F, Medina RA and Ibarra LF (2006). “Decision Support for Conceptual Performance‐Based Design”. Earthquake engineering & structural dynamics, 35(1): 115-133.
4 Zareian F and Krawinkler H (2007). “Assessment of Probability of Collapse and Design for Collapse Safety”. Earthquake Engineering & Structural Dynamics, 36(13): 1901-1914.
5 Lingos DG and Krawinkler H (2012). “Sidesway Collapse of Deteriorating Structural Systems under Seismic Excitations”. Rep. No. TB 177, The John A. Blume Earthquake Engineering Research Center, Stanford University, Stanford, CA.
6 Burton H and Deierlein G (2014). “Simulation of Seismic Collapse in Nonductile Reinforced Concrete Frame Buildings with Masonry Infills." Journal of Structural Engineering. 140, SPECIAL ISSUE: Computational Simulation in Structural Engineering, A4014016. 7 Eads L, Miranda E, Krawinkler H, and Lingos L (2013).
“An Efficient Method for Estimating the Collapse Risk of Structures in Seismic Regions”. Earthquake Engineering & Structural Dynamics, 42(1): 25-40.
8 Zareian F, Krawinkler H, Ibarra LF and Lingos D (2010). “Basic Concepts and Performance Measures in Prediction of Collapse of Buildings under Earthquake Ground Motions”. Structural Design of Tall and Special Buildings, 19(1-2): 167-181.
9 Lignos D and Krawinkler H (2007). “A Database in Support of Modeling of Component Deterioration for Collapse Prediction of Steel Frame Structures”. Structural Engineering Research Frontiers, 249(31): 1-12.
10 Lignos DG and Krawinkler H (2010). “Deterioration Modeling of Steel Components in Support of Collapse Prediction of Steel Moment Frames under Earthquake Loading”. Journal of Structural Engineering, 137(11): 1291-1302.
11 Lignos DG and Krawinkler H (2012). “Development and Utilization of Structural Component Databases for Performance-Based Earthquake Engineering”. Journal of Structural Engineering, 139, SPECIAL ISSUE: NEES 2: Advances in Earthquake Engineering, 1382–1394. 12 Ibarra LF, Medina RA and Krawinkler H (2002).
“Collapse Assessment of Deteriorating SDOF Systems”. Proceedings of 12th European Conference on Earthquake Engineering, Elsevier Science Ltd., London, September 2002, Paper No 665. 669-613.
13 Ibarra LF, Medina RA and Krawinkler H (2005). “Hysteretic Models that Incorporate Strength and Stiffness Deterioration”. Earthquake Engineering & Structural Dynamics, 34(12): 1489-1511.
14 Zareian F, and Krawinkler H (2006). “Simplified Performance-Based Earthquake Engineering." Report No. 162, The John A Blume Earthquake Engineering Center, Stanford University, Stanford, California.
1.0)”. Pacific Earthquake Engineering Research Center, University of California, Berkeley, California.
16 FEMA-356 (2000). “Prestandard and Commentary for the Seismic Rehabilitation of Buildings”. Federal Emergency Management Agency, Washington, D.C.
17 Haselton C, Liel A, Lange ST and Deierlein G (2008). “Beam-Column Element Model Calibrated for Predicting Flexural Response Leading to Global Collapse of RC Frame Buildings”. PEER Report 2007/03, Pacific Earthquake Engineering Research Center College of Engineering University of California, Berkeley.
18 Bao Y, Kunnath SK, El-Tawil S and Lew H (2008). “Macromodel-Based Simulation of Progressive Collapse: RC Frame Structures”. Journal of Structural Engineering, 134(7): 1079-1091.
19 Khandelwal K, El-Tawil S, Kunnath SK and Lew H (2008). “Macromodel-Based Simulation of Progressive Collapse: Steel Frame Structures”. Journal of structural engineering, 134(7), 1070-1078.
20 Tsai M-H (2012). “Evaluation of Different Loading Simulation Approaches for Progressive Collapse Analysis of Regular Building Frames”. Structure and Infrastructure Engineering, 8(8): 765-779.
21 Masoero E, Darò P and Chiaia B (2013). “Progressive Collapse of 2D Framed Structures: An Analytical Model”. Engineering Structures, 54: 94-102.
22 Elwood KJ and Moehle JP (2008). “Dynamic Collapse Analysis for a Reinforced Concrete Frame Sustaining Shear and Axial Failures”. Earthquake Engineering & Structural Dynamics, 37(7): 991-1012.
23 Baradaran Shoraka M, Yang T and Elwood K (2013). “Seismic Loss Estimation of Non‐Ductile Reinforced Concrete Buildings”. Earthquake Engineering & Structural Dynamics, 42(2): 297-310.
24 Elwood KJ (2004). “Modelling Failures in Existing Reinforced Concrete Columns”. Canadian Journal of Civil Engineering, 31(5): 846-859.
25 OpenSees (2012). “Open System for Earthquake Engineering Simulation”. Pacific Earthquake Engineering Research Centre, University of California, Berkeley, California.
26 Popovic’s S (1973). “A Numerical Approach to the Complete Stress Strain Curve for Concrete”. Cement and Concrete Research, 3(5): 583-599.
27 Mander JB, Priestley MJN and Park R (1988). “Theoretical Stress‐Strain Model for Confined Concrete”. Journal of Structural Engineering, 114(8): 1804–1826. 28 Karthick MM, and Mander JB (2011). “Stress-Block
Parameters for Unconfined and Confined Concrete Based on a Unified Stress-Strain Model”. Journal of Structural Engineering, 137(2): 270–273.
29 Concrete Structures Standard (2006). “NZS310: Part 1- The Design of Concrete Structures”. Standards New Zealand, Wellington,
30 Kunnath SK, Heo Y and Mohle JF (2009). “Nonlinear Uniaxial Material Model for Reinforcing Steel Bars”. Journal of Structural Engineering, 135(4): 335–343. 31 Chang G, and Mander J (1994). “Seismic Energy Based
Fatigue Damage Analysis of Bridge Columns: Part I – Evaluation of Seismic Capacity”. Technical Report NCEER-94-0006, National Center for Earthquake Engineering, University of New York at Buffalo, Buffalo, NY 14261.
32 Dhakal RP and Maekawa K (2002). “Modeling for Postyield Buckled of Reinforcement”. Journal of Structural Engineering, 128(9): 1139-1147.
33 Dhakal RP and Maekawa K (2002). “Path-Dependent Cyclic Stress–Strain Relationship of Reinforcing Bar Including Buckling”. Engineering Structures, 24(11): 1383–1396.
34 Bull D and Brunsdon D (1998). “Examples of Concrete Structural Design to New Zealand Standards 3101". New Zealand.
35 Kampenhuber D and Adam C (2013). “Vulnerability of Collapse Capacity Spectra to Material Deterioration”. Proceedings of the Vienna Congress on Recent Advances in Earthquake Engineering and Structural Dynamics (VEESD 2013), Vienna, Austria, 28–30 August 2013. 36 Tsantaki S, Ibarra LF and Adam C (2013). “Effect of
Modelling Uncertainty on the Seismic Collapse Capacity of Simple Systems Vulnerable to the P-delta Effect”. Proceedings of the Vienna Congress on Recent Advances in Earthquake Engineering and Structural Dynamics (VEESD 2013), Vienna, Austria, 28-30 August 2013. 37 Vamvatsikos D and Cornell A (2002). “Incremental