warwick.ac.uk/lib-publications
A Thesis Submitted for the Degree of PhD at the University of Warwick
Permanent WRAP URL:
http://wrap.warwick.ac.uk/106779
Copyright and reuse:
This thesis is made available online and is protected by original copyright.
Please scroll down to view the document itself.
Please refer to the repository record for this item for information to help you to cite it.
Our policy information is available from the repository home page.
Attention is drawn to the fact that the
• «
copyright o f this thesis rests with its author.
This copy o f the thesis has been supplied
on condition that anyone who consults it is
understood to recognise that its copyright rests
with its author and that no quotation from
the thesis and no information derived from it
may be published without the author’s prior
written consent.
It .
it
An Auger Electron Snectrosconic Study
of Surface Segregation on Fe-Cr, Fe-C
and Fe-Cr-C Alloys
Keith Hoger Jones CChem MRSG
Submitted tc the Department of Physics,
University of Warwick for the degree
of Doctor of Philosophy
ABSTRACT
Thi
3
thesis reports an Auger Electron Spectroscopic study of the surface Behaviour of a high-carbon-chrome (HCC) steel, and of itspure binary and ternary analogues, with particular reference to the
kinetics of surface segregation. In all, four pure alloys were studied:
iron -
0
.65
wt# carbon, iron -0
.8
?wt% carton, iron -1
.50
wt% chromium and iron - 1.46wt$S chromium - 0.91wt/S carbon. The temperature rangeof the experiments was limited at its lower end to
550°C
by the slow rate of segregation, and at its upper end to850
°C by evaporation of the segregants from the surface.Two types of surface behaviour were observed on the pure alloys:
segregation and precipitation. The discussion considers each in turn,
followed by a consideration of the results from the commercial HCC
alloy. Surface segregation occurred on all the alloys studied) surface
precipitation was restricted to the plain-carbon alloys. Sulphur was
the dominant segregant on the pure alloys, but segregations of phosphorus,
nitrogen, chromium and possibly carbon were also observed. On the
plain-carbon alloys, segregation occurred in competition with graphite
precipitation.
An analysis of the sulphur segregation kinetics permitted the
calculation of reasonable values of the lattice diffusion coefficient.
Some previously unreported features of its segregation kinetics were
explained in terms of interference by labile sulphide particles at or
near the surface. The average sizes and spacings of these particles
were estimated from the J-'netic experiments. When sulphur was depleted
at the surface, segregation of the other elements became important.
A limited analysis of the phosphorus segregation kinetics permitted the
calculation of reasonable values of the lattice diffusion coefficient.
On the commercial HCC alloy, the presence of manganese was found to
largely suppress sulphur segregation. Where segregation of sulphur did
occur it was thought to be due to surface effects such as manganese
evaporation. Phosphorus segregation was the most important feature on HCC.
An Auger calibration for monolayer graphite upon iron was deduced
from the precipitation results. With the aid of this calibration, the
graphite growth processes were elucidated. The mechanism of graphite
precipitation at a sulphur-covered surface was found to be different to
the reported precipitation mechanism at a clean surface. It was found
possible to measure the attenuation of Auger electrons in graphite, and
CONTENTS
CHAPTER ONE INTRODUCTION i
CHAPTER TWO BACKGROUND INFORMATION
3
2.1. Metallurgy
3
2.1.1. Background to the HCC problem
3
2.1.2. Equilibrium phase diagrams
k
2
.1
.3
. Phase transformations6
2.2. Auger electron spectroscopy
8
2.2.1. Auger electrons
8
2.2.2. Development of AES
8
2.2.3. Application to this work
9
2.3. Surface segregation and precipitation
11
2.3.1. Surface segregation H
2.3.2. Grain boundary segregation related to
surface segregation
16
2.3.3. Surface precipitation
17
Segregation kinetics
21
’ .^.l. Grain boundary segregation 21
Z A . Z .
Surface segregation21
References 27
CHAPTER THREE EXPERIMENTAL DETAIIS
29
3.1. The ultra-high vacuum (UHV) system
29
3.1.1. General
29
3.1.2. Ion bombardment
31
3
.1
.3
. The sample-heating stage33
3.1.^. The electron gun
35
3.1.5« The cylindrical mirror analyser (CMA)
36
3*2. Control of the analysis system
37
3.2.1. Electronics
37
3.2.2. Computer control
37
3.2.3. Data processing
38
3
«3
. The samples4
q3 . 3 . 1 . A llo y production 40
3.3.2. Sample preparation 4o
References
4
^CHAPTER FOUR RESULTS kZ
4.1. The Fe.87C alloy
44
4.1.1. Cenerai
44
4.1.2. The cx+Fe^C phase region
45
4.1.3. The y+Fe^C phase region
¿*7
4.1.4. The ^ phase region 48
4.2. The Fe.65C alloy
30
4.2.1. General
5
q4.2.2. The o<+Fe^C phase region
30
4.2.3. The c<+„ phase region
51
4.2.4. The ^ phase region
52
4.3. The FeCr alloy
53
4.3.1. General
33
4.3.2. The <X+(Fe,Cr)^C phase region
34
4.3.3. The
(X+<f
phase region33
4.4. The FeCrC alloy
36
4.4.1. General
36
4.4.2. The o ^ F e . C r ^ C phase region
56
4.4.3. The cX'+^/+(Fe,Cr)^C phase region
57
k . k . k .
The X +(Fe,Cr)^C phase region57
*♦•5« The commercial HCC alloy
58
^.5*1. General
^.5.2. The 0<+(Fe,Cr)^G phase region •
59
^•5*3. The
0
<+ ^ + ( F e tCr)jC phase region58
k . 5 . k .
The K + i F e . G r ) ^ phase region59
References
59
CHAPTER FIVE DISCUSSION ¿0
5.1. Surface segregation
60
5.1.1. Sulphur
60
5.1.2. Phosphorus
72
5.1.3. Nitrogen
75
5.1. ^. Chromium
75
5.1.5. Site competition
77
5.2. Surface pr< cipitation 9o
5.2.1. General aspects of graphite precipitation 80
5.2.2. Auger calibrations for mono?.ayer graphite
on iron
8k
5.2.3. Graphite layer growth
88
5.3. Surface behaviour of the HCC alloy 100
5.3.1. Sulphur
100
5.3.2. Phosphorus
102
5.3.3. Carbon
103
5.3. ^. Nitrogen
1
#+5.3.5« Chromium
10
^References
105
CHAPTER SIX CONCLUSIONS AND FUTURE WORK 108
6
.1
. The Fe.65
C and Fe.87
C alloys108
6
.2
. The FeCr and FeCrC alloys109
6.3. The HCC commercial alloy H O
6.4. Suggestions for future work m
APPENDIX A Glossary of Metallurgical Terms
APPENDIX 3 Auger Calibrations
CHAPTER SIX CONCLUSIONS AND FUTURE WORK 108
6
.1
. The Fe.65C and Fe.87C alloys108
6
.2
. The FeCr and FeCrC alloys109
6.3. The HCC commercial alloy H O
6.4. Suggestions for future work m
APPENDIX A Glossary of Metallurgical Terms
APPENDIX 3 Auger Calibrations
ACKNOWLEDGEMENTS
I am moat grateful to Dr. D.P. Woodruff for his supervision
of my work and for his patience during the extended preparation of
this thesis. I would also like to thank Prof. A.J. Forty for the
provision of facilities within the Department of Physics. This work
was carried out under a C.A.S.E. award with Tube Investments Ltd. and
my thanks are extended to Dr. M.J. Stowell for his assistance.
I would like to thank the members of the Surface Physics
Group for their aid» especially Dr. P.D.Johnson, and Mr. O.S. Simpson
for his excellent technical support.
Finally, my thanks are due to Hos and Martine who gave me such
support and helped to bring this work to a conclusion.
MEMORANDUM
The work reported in this thesis is my own unless
specifically acknowledged as being otherwise. It was performed
at the University of Warwick, in the Department of Physics.
The references cited in each chapter have been listed at
the end of the chapter, rather than at the end of the thesis.
CHAPTER ONE INTRODUCTION
This thesis describes the application of Auger electron
spectroscooy to a study of interfacial imourity segregation in iron
alloys. The project arose as a result of commercial interest in
establishing whether grain boundary segregation of sulohur was responsible
for the irregular hot-workability of EN31 high-carbon-chrome (HCC) steel.
This is used for the production of bearing rings, and good hot-
workability at the hot-oiercing stage is essential if tubes of sufficiently
good bore quality are to result. HCC steel has a nominal comoosition of
lwt
%
carbon,1
.5
wt/S chromium, the balance being iron.Commercial alloys are very C o m d e x systems with high levels
of impurities. It was therefore decided to carry out the major mart
of the work on mire binary and ternary alloys whose carbon and chromium
contents corresponded to the HCC nominal comoosition. Past segregation
studies on iron-carbon alloys have concentrated on hyoo-eutectoid
compositions. A pure alloy containing 0.65wt^ carbon w>.s therefore
used for comparative purposes. Well-homogenised samples of HCC steel
were produced to test the behaviour of the commercial product. The
relevant metals„.-gical details of these alloys are described in Chapter
Two, and a glossary of metallurgical terms is presented as Appendix A.
Auger electron spectroscopy has played an important part in
the development of a theoretical understanding of the process of
segregation. It permits direct, surface-specific qualitative and
quantitative analyses to be made at an interface. An electron beam
is directed at the sample surface and the re-emitted electrons are
energy analysed. For grain boundary segregation to be studied, this
implies fracturing along embrittled boundaries to make them accessible.
It is necessary to avoid surface contamination by atmospheric gases
because they can destroy the original segregation pattern. For this
reason, Auger electron spectroscopy is normally conducted under ultra-
high vacuum (UHV) conditions. A description of the Auger process is
given in Chapter Two, and the experimental details and a description
of the UHV system are included in Chapter Three.
As originally framed, the majority of the work was to have
involved the measurement of grain boundary segregation, with recourse
to the free surface if grain boundary fracture could not be obtained.
In the event, there were experimental difficulties with the original
UHV system and the ultimate vacua obtained were not adequate to prevent
surface contamination. Eventually, a new UHV system was constructed.
This was not as sophisticated as the original system but gave much
better ultimate vacua. The reduction in experimental facilities
favoured a change in emphasis to surface segregation studies. As will
be described in Chapter Two, surface segregation is related to grain
boundary segregation.
The surface behaviour of each alloy was studied as a function
of temperature, and hence of phase region. Consequently, the results
in Chapter Four are split first by alloy a>-a tv >n by phase region.
This division simplifies the location of a particular result, but it
was was not considered to be suitable for the discussion chapter. Two
types of surface process were observed on the nominally pure alloys:
segregation and precipitation. Chapter Five considers each in turn,
followed by a discussion of the results from the commercial HCC alloy.
The main conclusions are summarised in Chapter Six, together with an
outline of the course that future work might usefully take.
CHAirTLR T'iO BACKGROUND INFORMATION
2
.1
. Metallurgy2.1.1, Background to the HOC nrobl^m
HOC steel is used for the production of bearing rings. The
molten steel is cast into five-ton ingots. Solidification introduces
gross comnositional inhomogeneities into the steel. These take the
form of local concentrations of certain elements, low-melting inclusions
and large carbide particles. The ingots are "soaked" for seven hours at
1200
°C. This partially removes the comnositional inhomogeneities anddissolves most of the large carbide particles. Commercial considerations
limit the time allowed for this homogenisation, which is a slow orocess
because of the low diffusivity of chromium. The soaked ingots are
"cogged" and rolled into round "blooms". A rotary-oiercing oneration
at 1130°C converts the blooms into tubes which are then cut into
bearing rings.
Good hot-workability is essential during the rotary-oiercing
operation because of the high stresses involved. Rollers are oositioned
anc shaped so as to oroduce a tensile stress at the centre of the bar,
just ahead of the piercing tool. If the ductility is d e f i . .ent, areas
of folded metal called "bore-laps" are produced on the interior surface
of the tube, rendering it useless for bearing-ring production. The most
common causes of poor hot-workability are hard precipitates, low-melting
inclusions and a loss of cohesion at grain boundaries in which sulohur
segregation might play a part. Manganese has traditionally been added
to steels because of its known effectiveness in removing hot-shortness.
This ability appears to be the result of manganese sulphide nrecioitation
which ties-down the free sulphur usually present as an imourity in .
commercial steels.
f
iiawle (197*0 has studied the hot-workability of chromium steels
with various manganese:sulphur ratios. He found that provided the
sulphur content was low, alloys with high MntS ratios performed better
than alloys with low Mn:S ratios. At low temperatures, manganese
induces precipita.tion of virtually all the free sulohur. As the
temoera.ture rises, however, more and more sulphur goes into solution
and may segregate to the grain boundaries. Sawle suggested sulphur
segregation as a possible cause of ooor hot-worka.bility in HGC steel
but was unable to confirm this because he did not use a suitable
surface analysis technique. Auger electron soectroscopy may be used
to measure grain boundary segregation provided that the grain boundaries
are sufficiently embrittled to be exposed by fracture. The mechanical
properties of metals can be impared by levels of imourity segregation
too low to permit grain boundary fracture.
In the present study, pure alloys were used in an attempt to
clarify the effects of carbon and chromium uoon interfacia
1
segrcgition.HGG steel, with its many deliberate and accidental elemental additions,
was considered too complex a systeii to use when determining the
underlying causes
< 7
segregation ir the iron-carbon-chromium system.Some measurements on HGG samples were still made, however, so that its
behaviour could be compared with the pure analogues.
2.1.2. Equilibrium phase diagrams
The compositions of the pure alloys used were chosen so that
their carbon and chromium contents matched the HCG nominal comoosition:
lwt^i carbon, l.^wt,"? chromium, the balance being iron. Two binary alloys
with iron were produced; one containing 0.97wt# carbon, the other
containing
1
.50
wt$ chromium. These will be referred to as the Fe.87Cand FeGr alloys. A ternary alloy containing 0.91wt/6 carbon and 1.46wt$
chromium was also produced, and will be called the FeCrC alloy. A
pure sample of iron containing
0
.65
wti^ carbon was obtained from theNational Physical Laboratory. This Fe.
65
C alloy was included in thestudy to investigate the effect of carbon concentration and permit a
comparison between the behaviour of hypo- and hyper-eutectoid
constitutions. The detailed chemical analyses of the stock alloys
are shown in Table 2.1.
An equilibrium phase diagram of the iron-carbon system, due
to Hansen & Anderko (1958), is shown in Fig. 2.1. The comnositions
of the two plain-carbon alloys are marked. Phase regions of both the
stable iron-graphite and metastable iron-cementite systems are shown.
Gementite, although a metastable transformation product, nucleates
much more readily than graphite in the bulk, and once formed is so
stable kinetically that it may for most purposes be treated as an
equilibrium phase. If plain-carbon steels are given
a
suitable hest-treatment, the cementite will in time transform to graphite. The growth
of graphite in iron involves a volume expansion. Graphite forms
readily at the surface of plain-carbon steels (Olney
&
Smith (1959))where its growth does not result in lattice strain
A vertical section of the iron-carbon-chromium equilibrium
phase diagram due to Tofaute et al (193*0 is presented in Fig. 2.2.
This section was taken at a constant chromium content of
1
.6
wt# andis thought to be sufficiently accural» to be applied to all the chromium-
containing alloys. It shows the effect of carbon content on the phase
relationships, and the compositions of the FeCr, FeCrC and HCC alloys
are marked. Although FeCr was intended to be a binary alloy, there was
sufficient carbon present as an impurity to cause significant changes
from tne iron-chromium phase diagram.
0.6 Fe.65C 0.7 0.8 Fe.87C
Carbons wt#
yir. Equilibrium phase diagram of iron - 1.6wt>i chromium with carbon additions
'
c
u
p
e
r
a
t
u
r
c
Chromium is a strongly carbide-forming element and stabilises
cementite. As a result, bulk graphitisation is not expected to occur
in alloys containing more than about lwt# chromium (Smith (1949)).
For this reason, only the iron-comentite system is shown in Fig. 2.2.
It should be borne in mind, however, that the diagrams presented in
this section refer to the bulk, and that surface behaviour could be
different.
2.1.3. Phase transformations
In plain-carbon steels, phase transformations upon heating
go to completion very quickly. Austenite nucleates preferentially
at grain-boundary carbides, and its rate of growth is usually limited
by the rate of carbon diffusion to the transformation front (Hillert et
al (l
97
l)). In a hypo-eutectoid steel, some ferrite remains when alltoe cementite has dissolved in the gamma phase. Similarly, in a
hyper-eutectoid steel some cementite remains when all the ferrite has
transformed. When chromium is added to the steel, however, the rate
of transformation is much reduced. This is the result of the partial
s ibstitution of iron atoms in cementite by chromium atoms. The
dissolution of a carbide particle now require" «hi omium diffusion to
take place, and as this is much slower than carbon diffusion the rate
of transformation is reduced. Another factor which can limit the rate
of transformation is carbide morphology. The rate of supply of carbon
is dependent upon the area of th^ carbide-matrix interface through
which it must diffuse. Spheroidising the carbide particles can
reduce the rate of transformation to austenite by reducing their
surface area.
The rate of transformation upon cooling from the gamma phase,
the rate of carbon diffusion. The nucleation rate is proportional
to the degree of undercooling below the eutectoid temperature and so
increases with decreasing temperature. The diffusion rate decreases
with decreasing temperature. The result of these conflicting temperature
dependences is that the transformation rate passes through a maximum
some 100 -
200
°G below the eutectoid temperature. It is convenientto depict the transformation characteristics of individual alloys by
means of time-temperature-transformation (TTT) diagrams such as the
one presented for the Fe.65C alloy in Fig. 2.3. The approximate
times for onset and completion of transformation, and the nature of
the transformation products, are shown as a function of equilibration
temperature. TTT diagrams are presented for Fe.87C in Fig. 2.4 and
for both FeCrC and HCG in Fig. 2.5. All these diagrams were taken
from the Atlas of Isothermal Transformation Diagrams, U.S. Steel (1953).
It was not possible to quench samples in the UHV sample-holder. The
effect of the slow rate of cooling (Fig. 3.6) will have been to shift
that portion of the TTT curves above the transformation "nose" to
longer times. Cooling within the UHV system will have invariably
Fi.'r, .?.!
Time-temperature-transformation diagram
for a 0.65wt^ carbon 3teel
T
e
m
p
e
r
a
t
u
r
e
Tino: seconds
Fir. 2.h Timc-aemperature-transformation diagram
for a 0. °7,;tc/j carbon steel
T
e
m
p
e
r
a
t
u
r
e
■ 700
■6oo
■ 500
A = austenite
F - ferrite
C ■ cementite
■AOO u
o
300
200
Time: seconds
Fig. ?..5 Time-temperature-transformation diagram for a
lwt% carbon, lH»t$ chromium steel
T
e
m
p
e
r
a
t
u
r
e
[image:24.541.13.511.21.727.2]2
.
2
.
Auger electron spectroscopyAuger electron spectroscopy (AES) is the surface analysis
technique upon which the present work was based. The electronic
process is described, followed by a brief history of the technique
and a description of its application in the present case.
2.2.1. Auger electrons
When an atem is ionised by the removal of an inner-shell
electron, the vacancy may be filled by a less well bound electron
dropping down from an outer shell. The excess energy from this
transition may either be emitted as X-radiation or transferred to
a second outer-shell electron. In the latter case, the second electron
is emitted from the ion with a kinetic energy equal to the difference
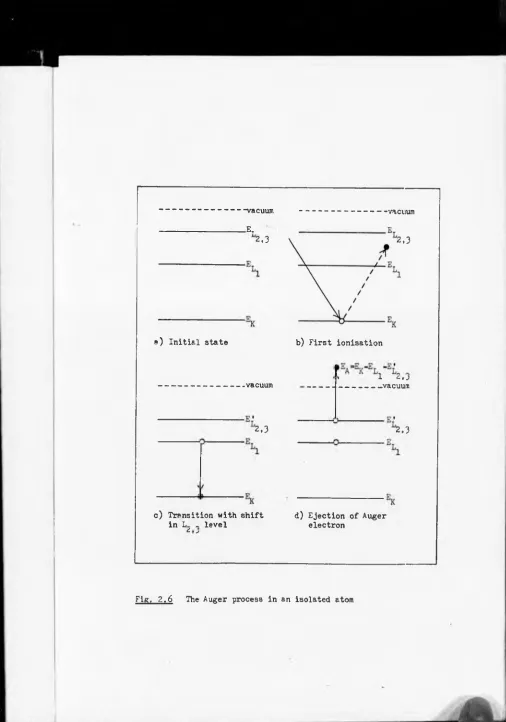
in energy of the levels involved. This process is illustrated in
Fig. 2.6 for an isolated atom (after Riviere (1973)). This electron-
loss process was discovered by Auger (
1925
) during an experiment onthe X-ray bombardment of gas atoms, and the emitted electrons have
come to be known as Auger electrons.
2.2.2. Development of A-,o
The production of Auger electrons by electron bom^•rdment
of a solid surface was first demonstrated by Lander (1953). Although
it was recognised at that time that the peaks in the ejected-electron
soectra were characteristic of the bombarded atoms, two further
developments were necessary before the potential of the technique
could be realised. Weber & Peria (
196
?) demonstrated that the alreadynumerous low energy electron diffraction (LEED) systems could be
readily modified for electron energy analysis, and Harris (1963)
electronically differentiated the electron energy spectrum from an
[image:25.541.20.520.55.739.2]■“vacuum
_ Et
--- vacuum
2,3
a) Initial state
'2,3
b) First ionisation
--- vacuum
2,3
c) Transition with shift in L - level
^
J
i ± C. t J
--- vacuum
2,3
d) Ejection of Auger electron
[image:26.550.25.531.9.731.2]background. This permitted the Auger signal to he sufficiently
amplified for AES to become a sensitive surface analysis technique.
The great advantage of AES over conventional surface analysis methods,
such as electron microprobe analysis, lay in its high degree of
surface specificity. An Auger electron will only contribute to
the peak characteristic of its emitting atom if it is able to leave
the surface layers without losing energy by inelastic collision.
'The most commonly analysed characteristic Auger peaks lie in the energy
range 40 - lOOOeV, The inelastic mean free paths of electrons in this
energy range when passing through solid materials have been reviewed
by Seah
&
Dench (1979)» and are less than 50«. In favourable casesthey can be as low as 5^« This indicates how highly surface specific
AES can be,
2.2.3. Application to this work
The sample surfaces were bombarded by a ?.5keV electron be°m,
and the electrons emitted from the surface were collected by a
cylindrical mirror energy analyser (CKA). This type of analyser
wa3 first suggested as be _ng suitable for Auger analysis by Palmberg
et al (
1
.969
). It consists of two co-axial cylinders, to the outer ofwhich is applied a repulsive voltage while the inner is earthed.
Electrons enter the co-axial space through an aperture, follow a
curved path in the electrostatic field and leave again via a second
aperture if their energy is such that their path has bee., bent by the
correct amount. They are then collected and the current measured
while sweeping the applied voltage over an appropriate range to
produce an energy spectrum. The experimental details of the use of
this type of analyser are given in Chapter Three, together with details
of the electron gun used for the bombardment.
Qualitative analysis relies upon the position of the Auger
peaks in the energy spectrum; these are known for all the analysable
elements. For quantitative analysis the Auger peak-to-peak height of
an element in the differentiated spectrum is related to that element's
peak-to-peak height from a standard. Alternatively, for a thin layer
of an element at the surface of another element, the neak-to-peak
heights of the two elements may be compared. This ratio can be
compared with those established by other workers as corresponding
to particular degrees of surface coverage. Care must be taken that
this method is not used for those systems where the overlayer causes
attenuation of the Auger signal from the matrix. Differences in
experimental conditions must also be taken into account. The Auger
calibrations that were used in the present work are described in
Appendix B.
2.3. Surface segregation and precipitation
Segregation has been defined by Hondros & Seah (1977) as
"the highly localised changes in concentrations achieved during the
solid-state thermal redistribution of soecies between the matrix and
interfaces". Used in this way, the term segregation does not describe
the chemical 3tate of the species at the interface, but only the
diffusion process which results in its concentration there. In the
present work, a distinction will be made such that surface segregation
describes a single-phase process and surface precipitation describes
a two-phase process. A review of surface segregation studies on
ferrous alloys made using AES is presented below. Although the
present work is limited to surface studies, the original commercial
problem concerned grain boundary segregation. For this reason, the
relationship between surface and grain boundary segregations is also
described. The final part of this section is devoted to a description
of surface precipitation studies relevant to the present work.
2
.3
.1
. surface segregationThe first analysis of surface segregation using AES was made
by Harris (
1963
A,B), who showed that sulphur was concentrated at thesurface of iron samples which had been heat-treated in vacuo. He also
found sulphur, together with chromium and antimony, at the surface of
a nickel-chromium steel. Subsequently, much use was made of AES to
study grain boundary segregation, and this work has been reviewed by
Hondros & Seah (1977). AES has also been found to be a useful tool
for establishing the degree of surface cleanliness.
The first attempt to study surface segregation on iron under
controlled conditions was made by Bishop & Riviere (
1970
). Theyfound that ion bombardment, when used to clean the surface, produced
a small Auger peak due to implanted argon but also a large carbon
Auger peak which they attempted to explain in terms of a buried carbon
layer. On heating at
500
°G for five minutes, the carbon Auger peakwas reduced while that due to argon was much increased as the argon
outgassed. Heat treatments at successively higher temperatures
removed both carbon and argon but produced increased levels of sulphur,
boron and nitrogen. Their sample was doped with boroni the other two
elements were impurities in the iron. Surface treatments designed to
remove sulphur increased the segregation of bcth boron and nitrogen.
These were the first observations of competition between surface
segregants.
Shell & Riviere (1973) investigated phosphorus segregation to
a clean iron surface as a function of both temperature and bulk
phosphorus concentration. They produced an Auger calibration for
phosphorus on iron by comparing measured phosphorus:iron peak height
ratios with values predicted by a calculation. This was based upon
Crank's diffusion equation, and plausible assumptions were made about
the distribution of phosphorus at the surface. Their results indicated
that the surface satura^. jn level was independent of both temperature
and bulk phosphorus content, and was in good agreement with Hondros'
value (
1965
) from a study of surface energy lowering. Shell & Riviereobserved site-competition between sulphur and phosphorus. It was
necessary to produce a near-surface sulphur depletion layer before
true phosphorus segregation occurred. Throughout their experiments
the levels of carbon, nitrogen and oxygen were either zero or very low.
Also in 1973* workers at the National Physical Laboratory
began to report a systematic study of interfacial segregation in iron.
alloys (see for example Seah & Lea (1975)). Their aim was to be able
to produce a coherent set of theories of interfacial segregation.
The two systems that they chose to study were iron-sulphur end iron-
tin-sulphur. Iron was chosen as solvent because of its economic
importance. Both tin and sulphur were known to embrittle iron as
a result of grain boundary segregation. Sulphur is commonly present
in steels as a result of poor steelmaking cleanliness) tin is introduced
into steel by the recycling of ferrous scrap. The main findings of
the surface segregation studies were that:
1) tin segregation saturated at two monolayers coverage,
2
) sulphur segregation never exceeded one monolayer,3
) there was strong site-competition between tin and sulphur whentotal surface coverages exceeded one monolayer,
4) evaporation from the free surface was significant at temoeratures
above
500
°c for sulphur and700
°C for tin,5
) sulphur still segregated after manganese had been added to tieit down, but only after an induction period. Manganese evaporation
from the free surface was thought to bo responsible for the
occurrence of sulphur segregation in the manganese-treated alloys.
The relationship between surface segregation and gv'<" ' oundary
segregación was also determined for these systems. This is discussed
below.
The first results on single-crystals of iron were reported
by Grabke et al (1975)* 'Their samples were doped with 10 - 90ppm of
carbon and also contained low levels of sulphur as an impurity. The
sulphur segregated freely, suppressing carbon segregation. No effects
of‘evaporation were observed below
700
°C. In a later paper (1977) theydemonstrated that, given sufficient time, sulphur would displace both,
carbon '.nd nitrogen from an iron surface. A bulk sulphur content of
only lOppm produced a saturated surface layer (c(2x2) on Fe(lOO))
between 600°G and 350°C, Below 600°G the rate of sulphur segregation
was very slow. Nitrogen gave saturation coverage up to
500
°G, abovewhich temperature desorption became important.
Swart? & Holloway (1977) examined surface segregation on
samoles of iron produced by compression of iron powder. These contained
lower levels of carbon than of sulphur (0.01/6 carbon, 0.02/6 sulohur).
They found that carbon segregated to the surface in the range 100°C
to 600°G. At higher temperatures, sulphur gradually began to renlace
carbon at the surface jntil by 700°G it had become the dominant
segregant. The level of carbon segregation did not saturate and
varied from sample to sample. Their conclusion was that carbon
desorbed rapidly above
500°G
and they presented some mass-spectrosco-oicevidence in support of this theory.
Yen et al (1973) investigated phosphorus segregation to the
free rurface of a ferritic-iron alloy. The phosphorus saturation level
was independent of temperature in the alpha range and was in good
agreement with that reported by Hondros (
1965
). The time-history ofthe approach to saturatin'' ua " , however, far from reproducible until
they used an 'at-temperature' ion-bombardment to deplete any fast sub
surface diffusion paths. They were then able to deduce sensible values
of the phosphorus lattice diffusion coefficient from their kinetic
studies of surface segregation.
Clayton & Burstein (1979) used AES to study the pattern of
surface segregation in the iron-nickel-antimony system. Sulphur was
present as an impurity and they observed surface site-competition
between sulphur and antimony. When the sulphur segregation had been .
removed b y at-temperature ion-bombardments, the equilibrium segregation
level of antimony was found to be
1 .3
monolayers and was independentof temperature. Equilibrium segregation levels of nickel decreased
with increase in temperature, from
0.5
monolayers at770
K to0.2
monolayers at
1150
K.As more and more data from AES studies of segregation have
become available, so the theoretical understanding of the segregation
process has developed. Hondros & Seah (1977) have produced a.
comprehensive review of this development, and so only a brief outline
will be given here.
The first adsorption isotherm developed which has subsequently
been applied to interfacial segregation is that of Langmuir (
1916
).It assumes a single layer of a single adsorbate, occupying a fixed
number of identical sites with no site-site interactions. Seah &
Hondros (1973) have used this isotherm to describe their results for
sulphur segregation at iron grain boundaries. It predicts that the
segregation level should be proportional to solute content, and
inversely proportional to temperature. Brunauer et a} (l
9
*K)) haveproduced another version of this isot'ierm using a different approach
and this has also been applied to interfacial segregation.
If the single-layer requirement is relaxed, the adsorption
may be described by the more general BET isotherm (so-called after the
initials of its authorsj Brunauor, Emmett & Teller (1933)). This is the
most commonly applied isotherm in gas adsorption studies. Seah &
Hondros (1973) found an excellent correlation between its predictions
and their grain-boundary results from the iron-tin system. They found
that there was no site-competition between sulphur and tin at the grain
boundaries and extended the isotherm to account for this case.
The most important remaining development in the use of isotherms
that will be described here is the taking into account of site-site
interactions (Fowler & Guggenheim (1939)). These interactions may be
intra— or inter—species, and may be attractive or repulsive in nature,
Shelton et al (197^0 used an 'intra-specie
3
attractive interaction'version of this isotherm to describe the behaviour of carbon at the
surface of nickel. For strong attractive forces, the temperature
dependence of segregation can become discontinuous. Shelton et al
had found that there was a very sharp onset of graohite precipitation
as the temperature of the nickel surface was reduced. Attractive,
inter-species interactions have been used by Guttmann (1975) to
explain the apparently co-operative segregation of certain impurities
and alloying elements in steels. If one element segregates to an
interface it may attract a second element, incresing the second
element's segregation level at the same interface. Lea & Seah (1975)
were able to explain the observed site-competition betfeen tin and
sulphur at the surface of iron in terms of a repulsive, inter-species
interaction.
2.3.2. Grain boundary segregation related to surface s egregati"
The present work is a study of surface segregation while the
commercial problem was one of possible grain boundary segregation. It
is therefore worthwhile to consider the relationship between segregations
at the two types of interface. Seah & Lea (1975) have made the only
complete study of this relationship. They measured the equilibrium
segregation levels of tin at the surface of iron and correlated their
results with some grain boundary results from the same system which had
been reported previously (Seah & Hondros (1973)). For dilute systems,
at
550
°G the surface sejrregation level was130
times the grain boundarylevel. The ratio of the segregation levels at the two interfaces
fell with increasing temperature. The ratio at l420°C has been found
from interfacial energy measurements to be
6
. There was a qualitativelysimilar variation of the ratio with increasing solute concentration as
with increasing temperature.
Seah
Sc
Lea were able to show that the above results were allcompatible with a BET-based theory of segregation, provided that all
the relevant entropy terms were included (site-multiplicity, vibrational
and anharmonic). The implication is that if the surface segregation
behaviour is studied in a particular system it may be possible to
predict the corresponding grain boundary levels. The conversion relies
on the measurement of the high-temperature surface to grain-boundary
ratio using interfacial energy techniques. This high-temperature
ratio is then extrapolated down to the required temperature by means
of the version of the modified BET equation relevant to the particular
system. Seah
Sc
Lea suggested that an alternative might be to set up adata-bank containing experimental results for each major system, so
that the surface segregation level could be correlated with the
equivalent grain boundary level simply b'- ing up the relevant
diagram.
2.3.3- Surface precipitation
When a species has segregated to the surface it may take part
in the formation of a new phase. The precipitation of graohite at the
surface of iron is a good example of this type of behaviour. Olney
Sc
Smith (1959) made a detailed study of this phenomenon using optical
techniques. They concluded that!
1) graphite would only precipitate on hyper-eutectoid samples,
2
) graphite precipitation only occurred upon cooling from the gammaphase, not when holding in the alpha range,
3) surface precipitation was inhibited by the presence in the steel
of carbide-forming elements such as chromium and manganese,
4) the extent of the precipitation was strongly dependent upon the
surface orientation, and graphite layer growth could be accomoani'’d
surface facetting,
5) graphite precipitation produced a sub-surface region depleted
of carbon, inhibiting cementite precipitation uoon subsequent
thermal cycling.
This work was followed up by Speich (l
96
l) who demonstrated that thegraphite layer was always formed with its basal plane parallel to the
substrate surface. He also investigated the effect of surface orientation
in some detail, finding that graphite precipitation on gamma iron
occurred most readily on close-packed (ill) surfaces, Gpeich suggested
that the high rate of graphite nucleation on surface orientations close
to (ill) was a result of the good matching between the austenite
surface and the graphite basal plane, and hence the low energy of the
interface. Fig. 2.7 illustrates this close matching for an iron
sample con+' ^ i ' ; 0,S3wt/£ carbon at
700
°G. L'nyanoi (1975
) has_2
measured interfacial energies as low as 25 - 50
erS cm
for thissystem.
When modern surface analysis techniques such as AES and LEED
were applied to the study of graphite precipitation upon iron, it
was found that the first two of Olney & Smiths' conclusions were not
in fact correct. Grabke et al (1975) found that graphite would
precipitate at the surface of a sample of iron doped with only
90
ppmof carbon when it was held in the alpha range. The graphite was,
however, only a few monolayers thick at most and could not have been
[image:36.541.26.506.54.735.2]observed by Olney
&
Smiths' optical techniques. Grabke et al observedthat on an iron (lOO) surface the graphite layer dissolved at the
temperature predicted from the iron-graphite equilibrium phase diagram,
leaving a layer of segregated carbon with a c(2x2) structure. The
fine-structure of the carbon Auger peak was found to depend on its
chemical state, so thax. graphite and segregated carbon could be
distinguished.
Grabke et als ' results represent the only substantial study
of graphite precipitation on iron that has been published. There has,
however, been much work undertaken on the nickel-graphite system, and
these results are reviewed here because they contain relevant information.
Coad & Riviere (l97l) studied the fine structure of the carbon Auger
peak from a nickel surface. They also identified two distinct types
of structure, but attributed them to nickel carbide and graphite.
The carbide structure was produced by quenching the sample, and it
was irreversibly transformed to the graphite structure upon heating
in the temperature range 400 -
600
°G.Shelton et al (197^) studied equilibrium segregation of carbon
to th (ill) surface of nickel single crystals doped with carbon.
They found three distinct equilibrium states of the surface!
1) a high-temperature dilute carbon phase (segregation),
2
) a condensed graphitic monolayer,3
) a multilayer epitaxial graphite precipitate.The multilayer precipitate was present at temperatures below the
equilibrium temperature for dissolution into the nickel crystal.
Abóve this temperature, a graphitic monolayer persisted for a further
100
°G, Carbon was only present as a segregant at high temperatures. ,upon nickel based on the observed attenuation of the nickel substrate
Auger signal in the graphite overlayer.
Mojica & Levenson (1976) attempted to derive the kinetics of
graphite precipitation at a polycrystalline nickel surface by monitoring
the carbon Auger signal. Their carbon time-histories had two distinct
regions. At the start of the experiments, a background level of carbon
was formed. They interpreted this as being a layer of segregated carbon.
With time, the carbon level increased and the carbon Auger oeak began
to show the fine structure associated with graphite. The nrecinitation
process thus appeared to proceed in two stages. Upon heating the
sample to the equilibration temperature carbon diffused out of the
bulk to form a segregated base-level carbon concentration. When
graphite had nucleated at favourable sites, its island growth was
fed by cross-surface diffusion of the segregated carbon. They assumed
that the base-level concentration was constantly being replenished by
further carbon diffusion from tl.e bulk.
Gijeeman et al (1973) commented that while they agreed with
Hojica & Levenson’s interpretation of the graphite growth mechanism,
they thought that the way the data had been +i-eaJed was incorrect.
Mojica & Levenson had normalised their carbon Auger peak to the nickel
substrate Auger peak, and the latter was obviously suffering some
variable attenuation due to the growing graphite layer. Gijreman et al
went on to derive an analysis of the data, based on a treatment of
two-dimensional nucleation and growth by Avrami (1939)« Their resulting
equation gave an excellent fit to Mojica & Levensons
1
results.2.4.
Segregation kinetics2.4.1. Grain boundary sera-egation
During the process of interfacial segregation, atoms of the
segregant must diffuse out of the bulk to the interface. The kinetics
are therefore controlled both by diffusion in the bulk and by the
boundary conditions at the interface. McLean (1957) evaluated the
time-dependence of grain boundary segregation by applying Fick's law
for bulk diffusion, with the rate of solute diffusion out of the
grains set equal to the rate of accumulation at the interface. As
a boundary condition he assumed that there was a constant ratio
between the solute concentration in the interface, C* , and the solute s
concentration at the faces of the adjacent grains, , such that:
Cl
= o<cts o
where
o(.
is called the enrichment ratio. 'This lead to a fairlysimple solution describing the time dependence of solute concentration
at any distance, x, from the grain boundary:
Gt
x D» - C*, (l - 1/£X ) exp
4Dt 2 2 ©Td
erfc
where C«o is the bulk solute concentration, D is the bulk diffusion
coefficient and d is the thickness of the interface. This solution
has not been applied to many systems but Seah (1977) found that it
could be used to explain some metallurgical results where embrittlement
due to phosphorus segregation was suspected.
2.4.2. Surface segregation
Surface segregation is conceptually the same as grain boundary
segregation except that segregant atoms can only arrive from one side-
of the interface. Lea & Seah (1977) have applied McLean's analysis
to surface segregation using the same boundary condition. They
produced the following equation:
j oo - L * (1 - 1/cx /, . \ () x . D «xp t ) — „ ( + — x , TLterfc
1
) + dwhere d is now interpreted as the solute monolayer thickness or
atomic size. Lea dc 3eah had accumulated a great deal of data on the
iron-tin system. When they attempted to apply the above equation,
they found that it could not adequately describe their results.
Lea i Seah next modified their equation to take into account
evaporation from the free surface into the vacuum. Lvaporation was
represented as being proportional to surface concentration. The
prediction of the modified equation was that if evaporation was a
significant factor, the surface concentration would not reach saturation
but would pass through a maximum before falling to a low level. The
incornoration of a correction for evaporation was, however, still
insufficient to make the equation more than an aoproximation to tneir
results. They then altered the boundary condition from a constant to
a time-variant enrichment ratio. The time variance was chosen to give
the best fit between the prediction of the equation and the observed
segregation time-histories. While this allowed Lea & Seah to deduce
solute diffusivity data for the iron-tin system, it did not make the
equation universally applicable because the exact nature of the time
varience would be expected to depend on the system observed.
A second example of the use of surface segregation studies
in the calculation of solute diffusivity data was reported by Yen
et'al (
1978
). They made observations of phosphorus segregation tothe surface of a ferritic iron alloy and found that by using a solution
of diffusion to a plane with Langmuirian adsorption they were able to
deduce sensible values of the phosphorus lattice diffusion coefficient.
The solution that they used was due to deinmuth (
1961
). He had begun(as had McLean) with Kick's law of bulk diffusion and the assumption
that the material flux at the boundary was equal to the rate of
adsorption. He also assumed that Langmuir's adsorption isotherm
was obeyed, ie.
coverage ar.d 'a' is the isotherm constant. His boundary condition,
however, was that the surface and bulk solute concentrations were
related by:
where T i s an integration variable, deinmuth obtained this relationship
by adapting an equation from Garslaw & Jaeger's (
19
^+7
) treatment ofheat conduction in a solid. It is the solution, using Duhamel's
Theorem, of the surface temperature's time-dependence when a body at
zero temperature with a surface at a finite temperatur. Is llowed
to equilibrate. The surface temperature falls with time until the
body is at
1
uniform temperature. This can be seen to be the reverseof the process of segregation.
rt/Te
- C/(C + a)where is the instantaneous surface coverage, is the saturation
deinmuth defined three dimensionless parameters:
He found a general solution which was of the form:
23
where the coefficients, aj , are given by a rather cumbersome
recurrence formula. However, if there is no adsorption at time
zero then the first of these, a Q , is zero and the second, a. , is
equal to
^ / T X .
The remaining coefficients may be neglected, so thatthe final solution is:
IJ/'C = y=j— (2t/7T)z
Hence, plotting log(coverage) against log(time) should give straight
lines of slope 0.5 and intercepts from which D may be calculated.
There is no correction for evaporation in this equation but Yen et
al were probably working at low enough temperatures for evanoration
to be neglected.
Howlands & Woodruff (1979) approached the problem in a different
way. They started from the basic physical mechanism of surface
segregation: jumping probabilities in-to a.nd out-of the surface
layer, '.'’he bulk was treated as a series of planes, with the change
in concentration with time of the n th plane being given by:
b- f
t‘ *B ( < V l - °„> * <C„ * C„-l> }where F- is the probability per unit time that a solute particle
jumps from one layer to the next, ie.
PB - D / d
2
where 'd’ has now become the interplane spacing. This probability
will be uniform in the bulk but will have a different value at the
surface because of the different binding energy. Diffusion in the
bulk was treated using a diffusion approximation, and probability terms
In order to arrive at a suitable boundary condition, the
vacuum outside the surface was represented by an array of layers
with a structure identical to the real medium, but with a different
hooping probability. The time dependence of the concentration ratio
between the surface layer and the boundary layer was found by Laplace
Transform techniques to be:
and surface layers, is the maximum concentration that the surface
layer can support and O' is given bys
where Pg is the probability per unit time that a oarticle hops from
the boundary layer to the surface layer. It can be seer that this
boundary condition is basically McLean’s original condition (C^cCC^)
plus a non-linear saturation term.
Using the above methodology, a general equation describing
surface segregation was deduced. Two -pocial cases of this solution
will be considered here. The first of these is ’no saturation, no
evaporation’ when the general equation reduces to:
This is identical to the form produced by Lea & Seah for their ’no
evaporation’ case. The second special case is that of ’saturation,
no evaporation’. Under these conditions the general equation reduces
to a. form which may be approximated by a straight line whose equation. where and are the instantaneous concentrations in the boundary
P s =cr(DVd)
1
_
1
- ex p(cr?"t) erfeieft*) js
CT-is:
( « / A ) 4
This is identical to the solution by .teinmuth which was described above.
This simple equation will only fail to give an adequate
description of surface segregation as saturation is approached or
when evaporation becomes significant. Rowlands & -oodruff showed
that the effect of saturation at the surface was analagous to Lea <3c
Seahs' time-varient enrichment ratio, and that some of Lea & Seahs'
results from the iron-tin system could be described by theoretical
curves corresponding to the 'saturation, no evaporation' special
case. One advantage of the Rowlands
St
Woodruff approach is th»t itis of general use and can easily be extended to account for inter
species interactions. This should be particularly important when
considering grain boundary segregation in alloy steels. Interactions
between impurities and alloying elements can lead to an increase in
segregation levels over the 'unalloyed' case.
itEFERFNCES for Chapter Two
Auger P., Comptes Rendus JL^oC
1925)65
Avrami H., J. Chem. Phys. 2(1-939)1103
Bishop H.E, de Rivière J.C., Acta Let. 1?(1970)^13
Brunauer S., Deming L.3., deming K.3. de Teller b . , J. Am. Chem. Soc. 62(19*0)1723
Brunauer S., Emmett P.H. de Teller E., J. Am. Chem. Soc. 6o(193^)309
Carslaw H.S.
à
Jaeger J.C., Conduction of Keat in Solid3
1947
, p57
Clayton J.Q. & Burstein G.T., Metal Science, 5ept(1979)530
Coad J.P. de Riviere J.C., Surface Science 25( 1 971)609
Fowler R.H. à Guggenheim E.A., Statistical Thermodynamics 1939, C.U.F.
Gijzeman O.L.J., Schouten F.C. de Bootsma G.A., Surf. Sci. 71(1973)174
Grabke H.J., Tauber G. & Viefhaus H., Scripta Met. 2 ( 1975)1131
Grabke H.J., Paulitschke W., Tauber G. de Viefhaus H., Surface Science £2(1977)377
Guttmann K., Surface Science 22(1975)213
Hansen M.
L
Aude:ko K., Constitution of Binary Alloys 1953, McGraw-HillHarris L.A., J. App, Phys. 39(1963)1419
Harris L.A., J. App. Fhys. 39(1963)1428
Hillert M., Nilsson K. de Torndahl L.E., J.I.S.I. 209(1971)49
Hondros E.D., Proc. Roy. Soc. A236(1965)479
Hondros E.D. de Seah M.P., Int. Met. Reviews 222, 1977
Lander J.J., Phys. Rev. 2i(1953)1332
Langmuir I., J. Am. Chem. Soc. 22(1916)2219
Lea C. de Seah M.P., Phil. Mag. 21(1977)213
L ’nyanoi V.N., Izv. V. U. Z. Fis. 12(1975)63
McLean D . , Grain Boundaries in Metals 1957, O.U.P.
Mojica J.F. de Levenson L.L., Surface Science
52
(1976)447
Olney M.J.
à
Smith G.G., J.I.S.I. 193(1959)107
Palmberg P.W., Bohn G.K.
à
Tracy J.G., App, Phys. Lett.15
(1969)254
Reinmuth W.H., J. Phys. Ghcm.
65
(1961)473
Rivière J.G., Gontemp. Phys. 14(1973)513
Rowlands G.
à
Woodruff Û.F., Phil. Mag. 40(1979)^+59Sawle H
. ,
Thesis 1974, University of SheffieldSeah M.P., Acta Met. ¿¿(1977)5+5
Seah M.P. <Sc Dench to.A., Surf.
&
Interface Anal. l(1979)2Seah M.P.
&
Hondros E.D., Froc. Roy. 3oc. ¿ ¿ ¿5
(1973)191
Seah h.P.
&
Lea C., Fhil. Mag. ¿1(1975)627Shell G.A. & Riviere J.G., Surface Science 4o( 1973)149
Shelton J.C., Patil H.fl. & Blakely J.M., Surf. Sci. 43(197*+)*+93
Smith G.V., Weld. Res. Suppl. Ij(l948)277
SpeichG.R., Trans. Met. Soc. A.I.M.E. 22l(l96l)4l7
Swartz W.E,
&
Holloway D.M., Appl. Snect. 3l(1977)210Tofaute Sponheuer A. & Bennek H., Arch. EisenhUtt. ¿(1934)499
l.'eber R.E.
&
Peria W.T., J. Appl. Phys. ¿¿(1967)4335
CHAPTER THREE EXPERIMENTAL DETAILS
3.1. The ultra-high vacuum (UHV) system
The stainless steel UHV system was constructed at Warwick
University. A photograph of the complete system and associated electronics
is shown as Fig. 3.1. The major features of the system are detailed in
the sections which follow.
3.1.1. General
A schematic of the vacuum system is shown in Fig. 3.2. The
main vacuum chamber consisted of two regions: an experimental area
and a service well. All pumping facilities were connected to the
well; the titanium sublimation pump was placed below the baffle in
order to keep evaporated metal out of the experimental chamber. The
system was maintained under UHV by a Mullard 150 litre sec
” 1
magnetronion pump. Supplementary capacity was provided by an Edwards E(A
polyphenyl-ether diffusion pump. This was essential during experiments,
when outgassing of the sample-heating stage and electron gvn were at
a maximum, and also during ion bombardment as described in the next
section. The diffusion pum
1
was backed by an Edwards ES200 rotarypump via s olecular-sieve oil trap. A liquid nitrogen cooled trap
and baffle were placed between the diffusion pump and the service
well to keep the pumping oil out of the main system.
System pressures were monitored by Pirani gauges (l barr to
o O
1
1
10“J torr) and ion gauges (10”J torr to 5*10 torr). A ^uadrupole
mass spectrometer was used
1
.o check the composition of residualgasses; a useful diagnostic tool when checking for leaks. The final
leak-test involved directing a jet of helium at the outside of the
chamber while checking for helium incursions with the mass spectrometer.
When the system was in a leak-tight state, its ultimate vacuum was
limited by outgassing of the internal surfaces. As a result, it was
necessary to remove as much gas as possible from these surfaces by
enclosing the system in an oven and baking it at 250°C for twelve
hours. During cooling, but while the system temperature was still
above
100
G, all filaments in the chamber were outgassed by runningthem at, or higher than their normal operating temperatures.
Pressures of 5*10 ^ torr were routinely achieved during
experiments. This permitted several hours of experimental work
before sample contamination by the residual gasses became a problem,
as may be seen from a simple 'worst-case' calculation. The arrival
rate of a gas of molecular weight 'm' at a surface is given by«
A - P/(27TmkT)^ molecules cm”^ s
_1
where P is the partial pressure of the gas above the surface. If we
assume that every molecule arriving at the surface sticks to it, the
time required for monolayer coverage of, for example, carbon dioxide
may be estimated as a function of pressure. This gives times of about
3
minutes at10
~® torr,30
minutes at10
~^ torr and5
hours at10-10
torr. When the sample was heated, the sticking coefficients of
contaminant gas molecules should have been reduced, but this may have
been counteracted by local increases in the pressure because of
outgassing of the sample-heating stage itself.
The problem of contamination was particularly serious for the
present work. If carbon-containing molecules had been deposited on
the sample surface, this could have been mistaken for carbon segregation.
Oxygen-containing species would also have been a problem because the
500
eV oxygen Auger peak can obscure the Auger peaks from chromiumwhich occur at 489 and
529
®v«3.1.2. Ion bombardment
Before each experiment the sample was bombarded by argon ions
to remove surface contamination. Two types of ion gun were used
during the course of this study. Initially, a conventional 'hot-
filament' ion gun was fitted into the system. In this type of gun,
argon atoms are ionised by electrons emitted from a heated filament
and are accelerated onto the sample by a
500
eV potential. Argon wassupplied to the gun by maintaining a virtually static argon pressure
of
10
torr in the vacuum chamber. To achieve this, the rate ofargon emission through a leak-valve was balanced with a small amount
of pumping which was obtained by slightly opening the valve to the
diffusion pump. Such high partial pressures of argon made the ion
pump unstable and it had to be switched off during bombardments. The
l A k
beam current obtained from this ion gun was adequate for samplecleaning. Each segregation experiment, however, produced a sub-surface
zone depleted in the segregant. This was removed by bombtrding away
several microns of the surface, and required a prohibitively long
bombardment time when u s i n ; the conventional gun.
Ev. ntually, the simple ion gun was replaced by a V.C. AG2
ion source. This offered several advantages. The cold-cathode ion
source gave rise to very little outgassing and was very reliable.
The ion beam could be focussed onto the sample, and the ion energy
was continuously variable up to lOkeV. The high source-efficiency
was complemented by direct delivery of argon to the gun. This allowed
normal pumping of the experimental chamber to be maintained during
the bombardments. These features, together with the AG2's ten times
greater beam current, resulted in very fast sputtering rates and hence
fast removal of depletion zones.