ISSN Online: 2156-8278 ISSN Print: 2156-8251
DOI: 10.4236/ajac.2017.812056 Dec. 27, 2017 774 American Journal of Analytical Chemistry
Influence of Ionic Additives on the Pyrolysis
Behavior of Paper
Karin Stadlmann
1, Christian W. Klampfl
1, Andreas J. Zemann
21Institute of Analytical Chemistry, Johannes-Kepler-University Linz, Linz, Austria 2Institute of Analytical Chemistry and Radiochemistry, Leopold-Franzens-University
Innsbruck, Innsbruck, Austria
Abstract
In the course of this study the influence of ionic additives (sodium, potassium, lithium, magnesium, and manganese as cations; acetate, lactate, malate, ma-lonate, succinate, and citrate as anions) on the pattern of volatile pyrolysis products of finished paper is investigated. The pyrolysis of paper causes a cascade of reaction products. As expected, the most abundant pyrolysis prod-uct is levoglucosan, however, along with other volatile prodprod-ucts, such as hy-droxyl and carbonyl compounds, furan and pyran derivatives, phenols, and other anhydrosugars, respectively. These compounds can easily be separated and characterized online using analytical pyrolysis in combination with gas chromatography (GC) and mass spectrometry (MS) detection. Both the com-position and total amount of volatile pyrolysis products are significantly al-tered when the paper samples contain metal salt ions and salts of organic ac-ids, respectively. Principal Component Analysis (PCA) was employed for the multivariate analysis of the obtained pyrolysis products. This allows for a qua-litative interpretation on how the various ionic additives affect the formation of specific pyrolysis products. When organic acids are added onto the paper, the pyrolysis pattern mainly depends on the protic properties of the organic acids (mono/di/triprotic) and to a lesser extent on the type within a protic class (monoprotic acetate or lactate vs.diprotic malate or malonate or succi-nate vs. triprotic citrate). The pyrolysis pattern of the paper samples is more markedly influenced by the type of metal ions rather than by the type of or-ganic acid. These effects significantly depend on both the valence and the concentration of the specific metal salt.
Keywords
Pyrolysis of Paper, Principal Component Analysis, Ionic Burning Additives How to cite this paper: Stadlmann, K.,
Klampfl, C.W. and Zemann, A.J. (2017) Influence of Ionic Additives on the Pyroly-sis Behavior of Paper. American Journal of Analytical Chemistry, 8, 774-791. https://doi.org/10.4236/ajac.2017.812056
Received: September 21, 2017 Accepted: December 24, 2017 Published: December 27, 2017
Copyright © 2017 by authors and Scientific Research Publishing Inc. This work is licensed under the Creative Commons Attribution International License (CC BY 4.0).
DOI: 10.4236/ajac.2017.812056 775 American Journal of Analytical Chemistry
1. Introduction
The thermal degradation of wood and wood products has long been of interest not only towards the understanding of the underlying mechanisms of the com-bustion chemistry, but also with respect to the formation of the comcom-bustion products. On the contrary, finished paper has only been rarely investigated to-wards its pyrolysis products. Besides cellulose, finished paper often consists of a significant part of filler (e.g. ground and precipitated calcium carbonate, tita-nium oxide, kaolin, talcum). Depending on the type of paper, the filler contents can reach up to 40% - 50% (w/w) of the paper substance. Filler is added to the paper for various purposes, such as reducing costs, increasing brightness and other optical properties, improvement of sheet formation and dimensional sta-bility of the fiber sheet, and for improving printasta-bility.
However, literature on the pyrolysis of finished paper products is rare. Mainly thermogravimetric analysis has been described, reporting the formation of car-bon monoxide, carcar-bon dioxide, water, hydrocarcar-bons, and char at different heat-ing rates and atmospheres [1]. Gupta et al.[2] describe the dependence of de-gradation temperature on heating rate and atmosphere. Baldry et al. [3] report on the formation of carbon monoxide and char when cigarette paper, impreg-nated with organic and inorganic salts, is pyrolyzed.
On the contrary, reports on the pyrolysis of cellulose are numerous. In an early report, Shafizadeh [4] describes the reaction mechanisms of the cellulose backbone degradation and the formation of levoglucosan as an important prod-uct. Arseneau [5] reports specific degradation mechanisms of cellulose using thermogravimetric and differential-thermoanalytical methods. The further de-gradation of levoglucosan to carbon monoxide, carbon dioxide, and other vola-tile carbonyl compounds, as well as the existence of acid and base catalyzed reac-tion paths was investigated by Shafizadeh et al. [6].
Kinetic investigations have been reported by Bradbury et al. [7] and Agrawal [8] [9] assuming a 3-reaction-model where activated cellulose is involved in the further degradation. Diebold [10] published a model involving seven reaction steps. The investigations of Ball et al. [11] considered heating rate, gas flow and water vapour on the reaction cascade forming volatile products. Pouwels et al. [12] identified numerous pyrolysis products using Curie-point pyrolysis and GC/MS.
Essig et al. [13] showed that the presence of NaCl reduces the amount of le-voglucosan produced during hydrolysis while the amount of glycoaldehyde is increasing. They also investigated the presence of other salts, such as sodium carbonate, sodium sulfate, magnesium chloride, and cesium chloride, as well as of oxygen, methanol, and propanol in the pyroylsis atmosphere on the forma-tion of levoglucosan.
DOI: 10.4236/ajac.2017.812056 776 American Journal of Analytical Chemistry of phosphoric acid and iron (III) ions on the formation of levoglusocsan and le-voglucosenone from cellulose. Low concentrations of phosphoric acid below 1% favour the formation of levoglucosan, whereas higher concentrations of phos-phoric acid above 2% produce more levoglucosenone. The presence of iron (III) ions cause an increased level of levoglucosan compared to untreated cellulose.
In a recent review Dale [16] reports on cellulose pyrolysis kinetics and the ex-istence of intermediate active cellulose. The influence of the chain length of cel-lulose and of end-group effects during isothermal pyrolysis is subject of a recent paper by Mettler et al. [17]. The conversion of cellulose to furans and small oxy-genates is also described by the same group [18]. A comprehensive overview on the pyrolysis of organic molecules is given by Moldoveanu [19].
Generally, the reactions occurring during pyrolysis are complex and greatly depend on external parameters, such as temperature, heating rate, and atmos-phere. In addition, structural properties of the cellulosic substrate also play a significant role, such as degree of polymerization, crystallinity, and the presence or absence of salts.
Whereas investigations dealing with the pyrolysis of cellulose containing ionic additives to influence the pyrolysis pathway are published in considerable num-bers [15] [20] [21] [22] [23] [24], only little has been reported on the pyrolysis of finished paper containing ionic additives or contaminants [25].
In this paper, the basic focus is primarily laid on receiving a general picture of the effects of anionic and cationic additives on volatile pyrolysis products of pa-per during online-pyrolysis. For this purpose, principal component analysis (PCA) is applied to interpret the pyrolysis data. By this means, the pyrolysis products can be correlated with respective samples preferably producing more or less of these specific compounds.
2. Materials and Methods
2.1. Chemicals
All chemicals used in this investigation were of analytical reagent grade. Stan-dard solutions of the salts prepared by dissolving the solid chemicals (purchased from Sigma-Aldrich-Fluka Handels-Ges.m.b.H, Vienna, Austria and Merck GmbH, Vienna, Austria) in ultra-pure water (Barnstead/Thermolyne, Dubuque, IA, USA).
For the series of cationic additives, aqueous solutions of the acetate salts of monovalent (Li+, Na+, K+) and divalent (Mn2+, Mg2+) cations at 3 different
con-centrations (150, 750, and 1450 mmol/L, respectively, with reference to the ca-tion) were made and applied to the paper using a laboratory size press.
DOI: 10.4236/ajac.2017.812056 777 American Journal of Analytical Chemistry and triprotic (citrate) solutions all had a concentration of 725 mmol/L (based on the anion). In addition, mono sodium and mono potassium salt solutions of malate and citrate were prepared at concentrations of 725 mmol/L, respectively, based on the anion.
2.2. Paper Samples
For the impregnation experiments a single grade low substance paper (23 g/m2)
was used. The paper consisted of 72% alpha cellulose and 28% precipitated cal-cium carbonate. Papers with a high amount of filler (calcal-cium carbonate) have specific properties, such as a high opacity and brightness.
The finished paper was then impregnated with solutions containing the ions of interest. The molar on-paper concentrations of the cations (Li+, Na+, K+, Mg2+,
and Mn2+, respectively) were adjusted to 0.05, 0.25, and 0.50 mmol/g,
respec-tively. The on-paper concentrations of the anions (acetates, lactates, malates, malonates, succinates, and citrates, respectively) were adjusted to 0.25 mmol/g.
The on-paper concentrations of the chemicals were determined using capil-lary electrophoresis after extraction of the papers with ultra-pure water. For this purpose, 300 mg paper was suspended in 20 mL water and sonication for 15 minutes. An aliquot was then analyzed using the methods described in chapters 5.1 and 5.2 in reference [26].
After impregnation, paper samples were cut to pieces of uniform size (5 mm diameter) using an office puncher.
2.3. Pyrolysis Gas Chromatography Mass Spectrometry
(Py-GC-MS)
The cut paper samples were pyrolyzed using a Thermo Desorption System (TDS) and an online pyrolysis module PM1 (Gerstel GmbH & Co. KG, Mülhei-man der Ruhr, GerMülhei-many). Starting at 40˚C the paper sample is brought to 250˚C at a heating rate of 60˚C and kept there for 2 minutes (preset instrument holding time). Pyrolysis was then performed at 500˚C for 60s with a heating rate of 20˚C/ms. After pyrolysis, the system temperature was again kept at 250˚C for 2 minutes and then cooled down. The flow of Helium was adjusted to 1.4 mL/min.
The pyrolyzate is then brought to the Cooled Injection System CIS (KAS 4 plus) (Gerstel GmbH & Co. KG, Mülheiman der Ruhr, Germany) through a heated transfer capillary and focused at a temperature of −100˚C.
After elevating the CIS temperature to 250˚C at a rate of 12˚C/s, the analytes are analyzed by Gas Chromatography using a GC HP 6890 N Series (Agilent Technologies, Palo Alto, CA, USA). The capillary column ZB WAX (Phenome-nex, Aschaffenburg, Germany) was 60 m × 0.25 mm with a polyethylene glycol layer of 0.25 µm. A temperature gradient for the GC separation was pro-grammed, starting at 40˚C to 150˚C (at 5˚C/min) and further for 250˚C (at 10˚C/min) with a holding time of 20 minutes.
DOI: 10.4236/ajac.2017.812056 778 American Journal of Analytical Chemistry Palo Alto, CA, USA) with electron impact ionization (EI) at 70 eV was used in full-scan mode (35 - 400 m/z). The interface was kept at 250˚C with the ion source at 230˚C.
Triplicate analyses of each paper sample were performed.
2.4. Data Analysis
Prior to data analysis, the peak areas of the paper samples were corrected in or-der to compensate for the steady decrease of peak areas due to the MS intensity decline over the project time. The correction factors for each set of papers were calculated by comparison with the repeatedly measured reference papers.
The data matrix consisting of sample ID (rows) and peak areas of the pyroly-sis products (columns) was then analyzed by Principal Component Analypyroly-sis (PCA) using the software package The Unscrambler X 10.1 64 bit (Camo, Oslo, Norway). Prior to PCA, all peak areas were normalized by their standard devia-tions in order to compensate for the huge variance in the absolute peak areas of the analytes.
3. Results and Discussions
The purpose of this study was to analyze the pyrolysis products of paper samples which have been impregnated with various salt solutions each containing either anionic (mono, di, and triprotic organic acids) or cationic (mono and diprotic inorganic cations) species at various concentrations. The specific goal was to find certain qualitative patterns of the pyrolysis products in dependence of the employed salt solutions.
In the present study the pyrolysis of paper leads to a variety of different reac-tion products. Table 1 lists the compounds which can be found in a typical py-rogram of paper at 500˚C. The compounds have been divided in various classes (aliphatic carbonyls, cyclic carbonyls, furans, pyrans, cyclic carbonyls, cyclic al-cohol, acids, phenols, and anhydro sugars), however, considering that some of the analytes belong to more than one class of compounds. The extent to which certain pyrolysis products are formed not only depends on the respective pyro-lysis conditions but also on type and concentration of the employed paper addi-tives.
Figure 1 shows pyrograms (total ion current, TIC) comparing an untreated reference paper along with papers impregnated with solutions of sodium (Na) or magnesium (Mg) acetate, as well as with solutions of various organic acids. When comparing peak intensities some of the peaks increase (e.g. #7, 8, 13, 14, 44, 45), some remain at the same intensity level (e.g. #19), whereas others are reduced in their intensity (e.g. #12, 42, 46).
DOI: 10.4236/ajac.2017.812056 779 American Journal of Analytical Chemistry
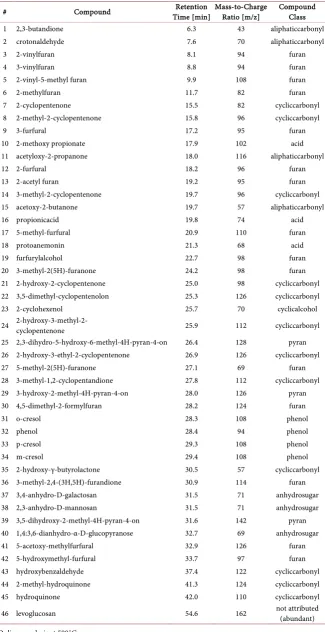
Table 1. Identified compounds in the pyrolysate of paper*.
# Compound Time [min] Retention Mass-to-Charge Ratio [m/z] Compound Class
1 2,3-butandione 6.3 43 aliphaticcarbonyl
2 crotonaldehyde 7.6 70 aliphaticcarbonyl
3 2-vinylfuran 8.1 94 furan
4 3-vinylfuran 8.8 94 furan
5 2-vinyl-5-methyl furan 9.9 108 furan
6 2-methylfuran 11.7 82 furan
7 2-cyclopentenone 15.5 82 cycliccarbonyl
8 2-methyl-2-cyclopentenone 15.8 96 cycliccarbonyl
9 3-furfural 17.2 95 furan
10 2-methoxy propionate 17.9 102 acid
11 acetyloxy-2-propanone 18.0 116 aliphaticcarbonyl
12 2-furfural 18.2 96 furan
13 2-acetyl furan 19.2 95 furan
14 3-methyl-2-cyclopentenone 19.7 96 cycliccarbonyl
15 acetoxy-2-butanone 19.7 57 aliphaticcarbonyl
16 propionicacid 19.8 74 acid
17 5-methyl-furfural 20.9 110 furan
18 protoanemonin 21.3 68 acid
19 furfurylalcohol 22.7 98 furan
20 3-methyl-2(5H)-furanone 24.2 98 furan
21 2-hydroxy-2-cyclopentenone 25.0 98 cycliccarbonyl
22 3,5-dimethyl-cyclopentenolon 25.3 126 cycliccarbonyl
23 2-cyclohexenol 25.7 70 cyclicalcohol
24 2-hydroxy-3-methyl-2- cyclopentenone 25.9 112 cycliccarbonyl
25 2,3-dihydro-5-hydroxy-6-methyl-4H-pyran-4-on 26.4 128 pyran
26 2-hydroxy-3-ethyl-2-cyclopentenone 26.9 126 cycliccarbonyl
27 5-methyl-2(5H)-furanone 27.1 69 furan
28 3-methyl-1,2-cyclopentandione 27.8 112 cycliccarbonyl
29 3-hydroxy-2-methyl-4H-pyran-4-on 28.0 126 pyran
30 4,5-dimethyl-2-formylfuran 28.2 124 furan
31 o-cresol 28.3 108 phenol
32 phenol 28.4 94 phenol
33 p-cresol 29.3 108 phenol
34 m-cresol 29.4 108 phenol
35 2-hydroxy-γ-butyrolactone 30.5 57 cycliccarbonyl
36 3-methyl-2,4-(3H,5H)-furandione 30.9 114 furan
37 3,4-anhydro-D-galactosan 31.5 71 anhydrosugar
38 2,3-anhydro-D-mannosan 31.5 71 anhydrosugar
39 3,5-dihydroxy-2-methyl-4H-pyran-4-on 31.6 142 pyran
40 1,4:3,6-dianhydro-α-D-glucopyranose 32.7 69 anhydrosugar
41 5-acetoxy-methylfurfural 32.9 126 furan
42 5-hydroxymethyl-furfural 33.7 97 furan
43 hydroxybenzaldehyde 37.4 122 cycliccarbonyl
44 2-methyl-hydroquinone 41.3 124 cycliccarbonyl
45 hydroquinone 42.0 110 cycliccarbonyl
46 levoglucosan 54.6 162 not attributed (abundant)
DOI: 10.4236/ajac.2017.812056 780 American Journal of Analytical Chemistry
Figure 1. Pyrograms of papers impregnated with water (reference “Ref”), with acetate solutions of sodium (Na) and magnesium (Mg), and the sodium salts of mono, di, and triprotic organic acids. Peak numbers refer to compounds listed in Table 1. Concentra-tions of impregnation compounds were adjusted to 0.25 mmol/g paper.
3.1. Principal Component Analysis (PCA)
be-DOI: 10.4236/ajac.2017.812056 781 American Journal of Analytical Chemistry cause this would mean that the experimental variations would have no effect on the formation of the various pyrolysis products. The reality will be found some-where in between these extremes. Some paper additives will have a stronger in-fluence the formation of the pyrolysis products and, on the contrary, other addi-tives will have a lesser effect. One way to deal with a situation where several va-riables correlate while others do not would be a quantitative comparison of the effects among all variables during all experiments. However, this would require a laborious comparison of the data with numerous correlation graphs of all 46 compounds at all experimental conditions (111 experiments).
Principle Component Analysis (PCA) transforms the original data set of pos-sibly correlated variables into a set of uncorrelated latent variables which are called Principal Components (PCs). These PCs basically represent coordinate axes of a newly calculated coordination system with the first PC accounting for as much as possible of the variance of the original data, the second PC for as much as possible of the remaining variability, and so forth. As a consequence, the dimensionality of the data set as generated in this study can be dramatically reduced. Additional information is given by stating the percentage of the ex-plained variance of the original data set for each Principal Component. The higher this percentage, the more of the original information is represented by the analysis results.
The results of a PCA are usually depicted using separate graphs, with the scores plot depicting the samples and the loadings plot showing the variables. A two dimensional loadings plot shows the extent of the correlation of certain va-riables (pyrolysis products) becomes easily visible. Each data point in the plot represents a pyrolysis product with a higher degree of correlation the closer they are located to each other in the loadings plot; data points close to the origin of the new coordinate system are independent of the experimental conditions.
In the scores plot, the individual data points represent different pyrolysis ex-periments and also indicate regions of similar properties. Paper samples with their respective additives which cause similar pyrolysis patterns are located clos-er togethclos-er than samples which produce diffclos-erent pyrolysis products.
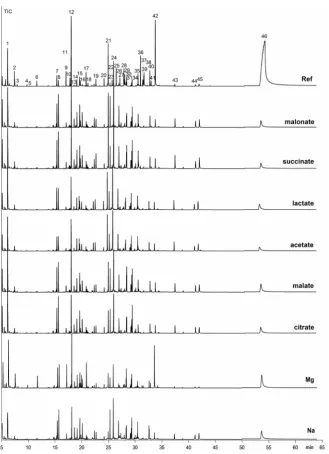
3.2. Effect of Anionic Additives
The graphs in Figure 2 show the scores plot (above) and loadings plot (below) of a PCA of the pyrolysis data of the anion impregnation series. More than three quarters (76%) of the variance of the original data space (46 variables, 48 sam-ples) are explained by only two dimensions (PC1 59%, PC2 17%). This means that many of the pyrolysis products are at least partly correlated and the most important effects can be explained with a high amount of statistical probability using a projection of the data on only two dimensions.
DOI: 10.4236/ajac.2017.812056 782 American Journal of Analytical Chemistry (a)
(b)
Figure 2. Scores (above) and Correlation Loadings (below) plots of the pyrolysis data from paper samples impregnated with various anionic salt solutions. Color assignments of Scores and Loadings Plots do not correspond!
paper produces a significantly different pyrolysis pattern compared to paper samples which have been impregnated with ionic additives.
[image:9.595.207.541.72.580.2]DOI: 10.4236/ajac.2017.812056 783 American Journal of Analytical Chemistry mainly caused by the different pyrolysis products and accounts for 59% of the variance of the original data set. The subsequent separation within the paper samples along the PC 2 axis is significantly less marked (17%) and is obviously due to the variation caused by the different classes of organic acids used for im-pregnation.
The lower graph in Figure 2 depicts the correlation loadings plot of the PCA and represents the position of the pyrolysis products relative to the respective samples in the scores plot. The two dashed circles in the correlation loadings plot correspond to the “circles of correlation” and help to determine whether the influence of a data point is significant or not. In contrast to the regular loadings plot which works with the actual loadings values, the distances on the axes of the correlation loadings plot are normalized within the range of −1 to +1. Variables of significant influence are located between the outer and inner circle.
A comparison of scores and loadings plots reveals that paper samples im-pregnated with monoprotic anions (acetate, lactate) cause a significantly higher formation of specific furans (3-vinylfuran, furfuryl alcohol, 2-acetyl-furan), hy-droquinone, hydroxybenzalehyde, propionic acid, and 2-hydroxy-γ-butyrolactone during pyrolysis compared to papers containing salt of di- and triprotic acid salts. The latter impregnation compounds drive the pyrolysis towards a higher concentration of specific cyclic carbonyls (2-methyl-2-cyclopentenone, 3,5-dimethyl-cyclopentenolon, 3-methyl-2-cyclopentenone, and
2-cyclopentenone), as well as phenolic compounds (phenol and cresols). How-ever, the complexity of the pyrograms generally decreases with impregnated pa-pers. The formation of compounds located in the left part of the loadings plot (acids, anhydrosugars, pyrans and specific furans) is predominant with un-treated papers. The concentration of the most abundant pyrolysis product, le-voglucosan, is also reduced with impregnated papers.
In addition, other effects become obvious in the scores plot of Figure 2. At first, the pyrograms of papers treated with the sodium salt of the same acid differ slightly from the potassium salts. Potassium salt containing papers are located slightly above the respective sodium salts in Figure 2. This means that during py-rolysis they produce a slightly higher concentration of specific furans (3-vinyl fu-ran, furfurylalcohol, 2-acetyl furan), cyclic carbonyls (2-hydroxy-γ-butyrolactone, hydroxyl benzaldehyde, hydroquinone), and propionic acid.
DOI: 10.4236/ajac.2017.812056 784 American Journal of Analytical Chemistry (a)
(b)
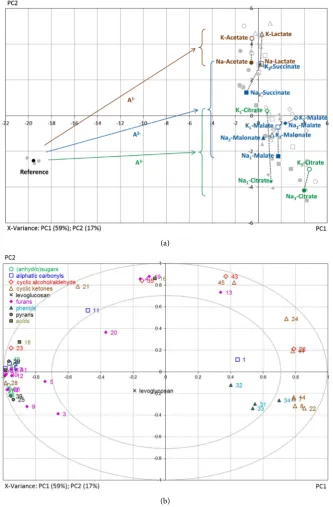
Figure 3. Scores (above) and Correlation Loadings (below) Plots of the pyrolysis data from papers samples impregnated with various anionic salt solutions without reference samples. Color assignments of Scores and Loadings Plots do not correspond!
respectively), is lower for the first two PC’s compared to Figure 2 it is suffi-ciently high for the required purpose of explaining the effects. The mono sodium and mono potassium salts of citrate and malate, respectively, can be clearly dis-tinguished from the respective fully saturated salts.
[image:11.595.208.541.72.583.2]DOI: 10.4236/ajac.2017.812056 785 American Journal of Analytical Chemistry region generally corresponds to the papers impregnated with single or divalent anions. Separated into the classes of compounds, cyclic alcohols and aldehydes, as well as acids are mainly produced by the acetate and lactate samples (both so-dium and potassium), respectively, which are located in the left hand side of the loadings plot. Anhydrosugars (except for levoglucosan) come to lie in the upper left quadrant and correspond to the potassium salts of the monovalent acids. Phenols are clustered in the right lower quadrant which matches the region where the monosodium salts of citrate and malate are found in the scores plot.
Papers impregnated with the salts of higher charged carboyxylic acids (far positive side of PC1) seem to reduce the complexity of the pyrograms leading to a considerably lower variety of volatile pyrolysis products. The concentration of levoglucosan (#46), however, is not significantly influenced by one or the other impregnation salt as indicated by its position in the loadings plot of Figure 3 (near the PC 2 axis within the inner circle of correlation).
This behavior indicates that the degree to which the acid anions are saturated by metal cations mainly determine the pattern of the pyrolysis products rather than the formal protic character of the acid anions.
It is known from the literature that the presence of alkaline cations signifi-cantly affects the mechanisms of thermal degradation of lignocellulosic mate-rials. The cations cause a fragmentation of the cellulosic backbone rather than a depolymerization [27]-[32]. In addition, gas yields increase while liquid yields decrease. Thus it can be assumed that the catalytic effect from additives is due to the involved cations rather than the type of acid anion.
3.3. Effect of Cationic Additives
In order to investigate the effect of various types of cations on the pyrolysis pat-tern in more detail, papers impregnated with solutions of acetates of monovalent (Li+, Na+, and K+) and divalent (Mg2+, Mn2+) cations, respectively. Similar to acid
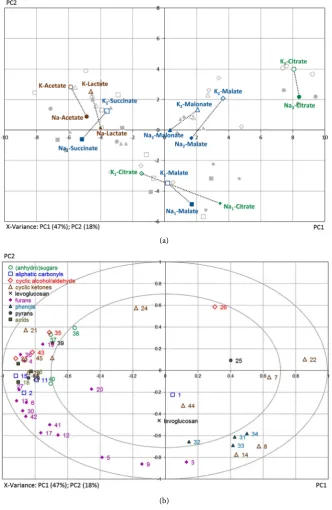
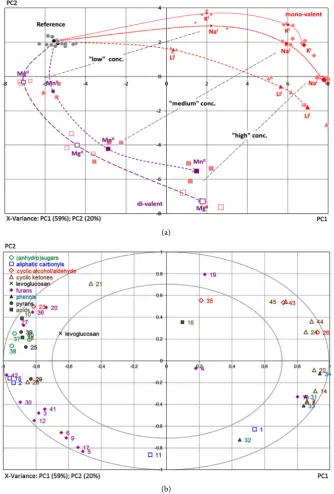
anions of different formal valence, the pyrolysis pattern of the paper samples impregnated with different cations also show a distinctive pattern, as depicted in the upper graph of Figure 4.
The scores plot of the PCA generated by the paper samples impregnated with cationic additives show a distinctive separation of both valence as well as of the concentration of the respective cation (0.05, 0.25, and 0.50 mmol/g as low, me-dium, and high concentrations, respectively). Starting from untreated reference papers located in the left upper quadrant of the scores plot, the monovalent ca-tions clearly separate from the divalent caca-tions along the PC 2 with increasing concentration. The divalent cations show a significantly lesser influence on the pyrolysis pattern compared to the monovalent cations, as they are closer to the reference papers. Compared to the paper samples with the anionic additives, a clear dependence on valence is observed with the cationic additives.
DOI: 10.4236/ajac.2017.812056 786 American Journal of Analytical Chemistry (a)
(b)
Figure 4. Scores (above) and Correlation Loadings (below) Plots of the pyrolysis data from paper samples impregnated with various cationic salt solutions. Color assignments of Scores and Loadings Plots do not correspond!
generating 46 pyrolysis products can be reduced to a two dimensional plot still explaining almost 80% of the total variance of the whole experimental space.
[image:13.595.206.541.72.567.2]py-DOI: 10.4236/ajac.2017.812056 787 American Journal of Analytical Chemistry rolysis behavior of papers compared to divalent cations. The lowest concentra-tion of the series of monovalent caconcentra-tions is located in the middle of PC 1, at roughly the same position where the highest concentration of the series of the divalent cations ends. This depicts the stronger influence of monovalent cations. In addition, mono and divalent cations separate along the PC 2 axis and can be distinguished by specific pyrolysis products (lower graph in Figure 4).
Pyrans and furans are produced at higher concentrations by paper samples impregnated with low and medium concentrations of the divalent cations (left hand side of the lower left quadrant). Sugars and acids (except for propionic ac-id) cluster in the outer left positive region of PC 1, corresponding to the refer-ence samples. On the opposite side, high concentrations of monovalent cations cause significantly higher concentrations of phenols and specific cyclic carbonyls (2-hydroxyγ-butyrolactone, hydroxy benzaldehyde, hydroquinone, 2-ethyl-hydro-quinone, 2-hydroxy-3-methyl-2-cyclopentenone, 2-hydroxy-3-ethyl-2-cyclo-pentenone, 2-hydroxy-3-ethyl-2-cyclopentenone) during pyrolysis. In contrast to the samples impregnated with anionic additives, the concentration of levog-lucosan (left upper quadrant in the loadings plot of Figure 4) is reduced by all types and concentration levels of cationic additives.
This is in well accordance with the literature where alkaline and earth alkaline ions in wood induce low levels of levoglucosan [32]. These cations also induce high char and low tar yields.
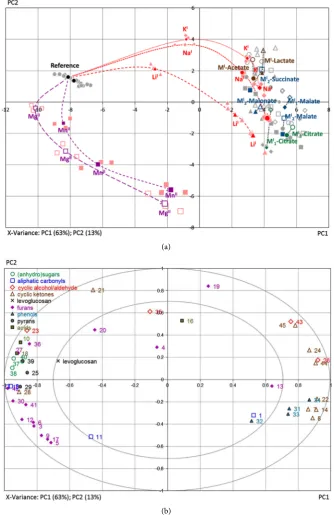
3.4. Combined Anionic and Cationic Effects
In order to distinguish between the effects of anions and cations on the pyrolysis patterns, the pyrolysis products of both series are analyzed together and dis-cussed using one model.
The upper graph of Figure 5 depicts the combined experiments of both anio-nic and catioanio-nic additives. The first two PC’s explain 76% of the total variance of the chromatographic data (PC 1: 63%; PC 2: 13%). For the cationic additives the scores plot looks almost identical to the scores plot in Figure 4 (without anionic additives). When compared to the anionic data set in Figure 2, the area with the anionic additives looks almost similar, however, only slightly shifted towards the positive side of the PC 1 axis.
This indicates that the pyrolysis pattern is predominantly determined by the type and concentration of the cationic additives and to a much lesser extent by the anionic additive.
The higher the on-paper concentration of an additive is chosen (especially for the acid anion and the monovalent cations) the lower concentrations of the compounds are produced during pyrolysis. These compounds are located on the left-hand side of the loadings plot in Figure 5 (acids, sugars, pyrans, furans).
4. Conclusions
DOI: 10.4236/ajac.2017.812056 788 American Journal of Analytical Chemistry (a)
[image:15.595.206.541.73.589.2](b)
Figure 5. Scores (above) and Correlation Loadings (below) Plots of the combined pyroly-sis data from both series of impregnated papers (anions and cations). Color assignment of Scores and Loadings Plots do not correspond!
DOI: 10.4236/ajac.2017.812056 789 American Journal of Analytical Chemistry Interpretation of the data by means of the respective scores and loadings plots reveal that the formation of certain pyrolysis products can be guarded by ad-justing the cationic additive type and concentration.
Further investigation of this topic will include a variation of the counter ca-tions of various acids as well as a concentration series for anionic additives. In addition, other counter anions will have to be investigated in more detail in or-der to specifically attribute as many effects as possible.
Acknowledgements
The financial support of this work by the Austrian Science Foundation (Öster-reichische Forschungs förderungs gesellschaft—FFG) BRIDGE Project No. 810983/10997 and by Dr. Franz Feuerstein GmbH, Traun, Austria, is gratefully acknowledged.
References
[1] Kashiwagi, T. and Nambu, H. (1992) Global Kinetic Constants for Thermal Oxida-tive Degradation of a Cellulosic Paper. Combustion and Flame, 88, 345-368. https://doi.org/10.1016/0010-2180(92)90039-R
[2] Gupta, A.K. and Müller, P. (1999) Pyrolysis of Paper and Cardboard in Inert and Oxidative Environments. Journal of Propulsion and Power, 15, 187-194.
https://doi.org/10.2514/2.5441
[3] Baldry, P.J., Cullis, C.F., Goring, D. and Hirschler, M.M. (1987) The Combustion of Cigarette Paper. Fire and Materials, 12, 25-33.
https://doi.org/10.1002/fam.810120105
[4] Shafizadeh, F. (1968) Pyrolysis and Combustion of Cellulosic Materials. Advances in Carbohydrate Chemistry, 23, 419-474.
https://doi.org/10.1016/S0096-5332(08)60173-3
[5] Arseneau, D.F. (1971) Competitive Reactions in the Thermal Decomposition of Cellulose. Canadian Journal of Chemistry, 49, 632-638.
https://doi.org/10.1139/v71-101
[6] Shafizadeh, F. and Lai, Y.Z. (1972) Thermal Degradation of 1,6-Anhydro- β-D-glucopyranose. Canadian Journal of Chemistry, 37, 278-284.
https://doi.org/10.1021/jo00967a020
[7] Bradbury, A.G.W., Sakai, Y. and Shafizadeh, F. (1979) A Kinetic Model for Pyroly-sis of Cellulose. Journal of Applied Polymer Science, 23, 3271-3280.
https://doi.org/10.1002/app.1979.070231112
[8] Agrawal, R.K. (1988) Kinetics of Reactions Involved in Pyrolysis of Cellulose—I. The Three Reaction Model. The Canadian Journal of Chemical Engineering, 66, 403-412. https://doi.org/10.1002/cjce.5450660309
[9] Agrawal, R.K. (1988) Kinetics of Reactions Involved in Pyrolysis of Cellulose—II. The Modified Kilzer-Broido Model. The Canadian Journal of Chemical Engineer-ing, 66, 413-418. https://doi.org/10.1002/cjce.5450660310
[10] Diebold, J.P. (1994) A Unified, Global Model for the Pyrolysis of Cellulose. Biomass and Bioenergy, 7, 75-85. https://doi.org/10.1016/0961-9534(94)00039-V
DOI: 10.4236/ajac.2017.812056 790 American Journal of Analytical Chemistry Physics, 1, 5035-5043. https://doi.org/10.1039/a905867b
[12] Pouwels, A.D., Eijkel, G.B. and Boon, J.J. (1989) Curie-Point Pyrolysis—Capillary Gas Chromatography—High-Resolution Mass Spectrometry of Microcristalline Cellulose. Journal of Analytical and Applied Pyrolysis, 14, 237-280.
https://doi.org/10.1016/0165-2370(89)80003-8
[13] Essig, M., Richards, G.N. and Schenk, E. (1989) Mechanisms of Formation of the Major Volatile Products from the Pyrolysis of Cellulose. Cellulose and Wood Che-mistry and Technology. John Wiley & Sons, New York.
[14] Statheropoulos, M. and Kyriakou, S.A. (2000) Quantitative Thermogravimetric Mass Spectrometric Analysis for Monitoring the Effects of Fire Retardents on Cel-lulose Pyrolysis. Analytica Chimica Acta, 409, 203-214.
https://doi.org/10.1016/S0003-2670(99)00859-4
[15] Dobele, G., Dizhbite, T., Rossinskaja, G., Telysheva, G., Meier, D., Radtke, S. and Faix, O. (2003) Pre-Treatment of Biomass with Phosphoric Acid Prior to Fast Pyro-lysis: A Promising Method for Obtaining 1,6-Anhydrosaccharides in High Yields. Journal of Analytical and Applied Pyrolysis, 68-69, 197-211.
https://doi.org/10.1016/S0165-2370(03)00063-9
[16] Lédé, J. (2012) Cellulose Pyrolysis Kinetics: An Historical Review on the Existence and Role of Intermediate Active Cellulose. Journal of Analytical and Applied Pyro-lysis, 94, 17-32.https://doi.org/10.1016/j.jaap.2011.12.019
[17] Mettler, M.S., Paulsen, A.D., Vlachos, D.G. and Dauenhauer, P.J. (2012) The Chain Length Effect in Pyrolysis: Bridging the Gap Between Glucose and Cellulose. Green Chemistry, 14, 1284-1288.https://doi.org/10.1039/c2gc35184f
[18] Mettler, M.S., Mushrif, S.H., Paulsen, A.D., Javadekar, A.D., Vlachos, D.G. and Dauenhauer, P.J. (2012) Revealing Pyrolysis Chemistry for Biofuels Production: Conversion of Cellulose to Furans and Small Oxygenates. Energy & Environmental Science, 5, 5414-5424.https://doi.org/10.1039/C1EE02743C
[19] Moldoveanu, S. (2010) Pyrolysis of Organic Molecules with Applications to Health and Environmental Issues. Techniques and Instrumentation in Analytical Chemi-stry (Series), Elsevier, Amsterdam.
[20] Low, M.J.D. and Morterra, C. (1985) IR Studies of Carbons—V Effects of NaCl on Cellulose Pyrolysis and Char Oxidation. Carbon, 23, 311-316.
https://doi.org/10.1016/0008-6223(85)90116-2
[21] Zaror, C.A., Hutchings, I.S., Pyle, D.L., Stiles, H.N. and Kandiyoti, R. (1985) Sec-ondary Char Formation in the Catalytic Pyrolysis of Biomass. Fuel, 64, 990-994. https://doi.org/10.1016/0016-2361(85)90156-5
[22] Richards, G.N. (1987) Glycolaldehyde from Pyrolysis of Cellulose. Journal of Ana-lytical and Applied Pyrolysis, 10, 251-255.
[23] Tanczos, I., Pokol, G., Borsa, J., Toth, T. and Schmidt, H. (2003) The Effect of Te-tramethylammonium Hydroxide in Comparison with the Effect of Sodium Hy-droxide on the Slow Pyrolysis of Cellulose. Journal of Analytical and Applied Pyro-lysis, 68-69, 173-185.https://doi.org/10.1016/S0165-2370(03)00071-8
[24] Dobele, G., Rossinskaja, G., Telysheva, G., Meier, D. and Faix, O. (1999) Cellulose Dehydration and Depolymerization Reactions during Pyrolysis in the Presence of Phosphoric Acid. Journal of Analytical and Applied Pyrolysis, 49, 307-317. https://doi.org/10.1016/S0165-2370(98)00126-0
DOI: 10.4236/ajac.2017.812056 791 American Journal of Analytical Chemistry Acta Chimica Slovenica, 53, 437-443.
[26] Zemann, A., Rohregger, I. and Zitturi, R. (2008) Determination of Small Ions with Capillary Electrophoresis and Contactless Conductivity Detection. Methods in Mo-lecular Biology, 384, 3-19.
[27] Dobele, G., Rossinskaja, G., Dizhbite, T., Telysheva, G., Meier, D. and Faix, O.J. (2005) Application of Catalysts for Obtaining 1,6-Anhydrosaccharides from Cellu-lose and Wood by Fast Pyrolysis. Journal of Analytical and Applied Pyrolysis, 74, 401-405.https://doi.org/10.1016/j.jaap.2004.11.031
[28] Pan, W.-P. and Richards, G.N. (1989) Influence of Metal Ions on Volatile Products of Pyrolysis of Wood. Journal of Analytical and Applied Pyrolysis, 16, 117-126. https://doi.org/10.1016/0165-2370(89)85011-9
[29] Piskorz, J., Radlein, D. and Scott, D.S. (1994) Thermal Conversion of Cellulose and Hemicellulose to Sugars. In: Bridgwater, A.V., Ed., Proceedings of International Symposium on Advances in Thermochemical Biomass Conversion, Blackie Aca-demic, London, 1432-1440.
[30] Piskorz, J., Scott, D.S. and Radlein, D. (1998) Composition of Oils Obtained by Fast Pyrolysis of Different Woods. Pyrolysis Oils from Biomass: Producing Analysing and Upgrading. American Chemical Society, Washington DC, 167-178.
[31] Scott, D.S., Paterson, L., Piskorz, J. and Radlein, D. (2000) Pretreatment of Poplar Wood for Fast Pyrolysis: Rate of Cation Removal. Journal of Analytical and Applied Pyrolysis, 57, 169-176.https://doi.org/10.1016/S0165-2370(00)00108-X
[32] Richards, G.N. and Zeng, G. (1991) Influence of Metal Ions and of Salts on Products from Pyrolysis of Wood: Applications to Thermochemical Processing of Newsprint and Biomass. Journal of Analytical and Applied Pyrolysis, 21, 133-146.