1
Exploring fatigue patterns over time in early osteoarthritis
Author:
Botterman, J.
Supervisor:
Bode, Dr. C.
Siemons, L.
MSc
Enschede, July 2013
Faculty:
Behavioral Sciences
Department:
Psychology, Health & Technology A thesis submitted in fulfillment of the
2
Abstract
Background – Fatigue is a common and often reported symptom among osteoarthritis patients. However, research into fatigue in osteoarthritis is scarce and the few studies that have been studying fatigue in OA primarily measured fatigue at a single point in time among moderate to severe OA patients. Thus far, nothing is known about the long term fatigue experience among early OA individuals.
Objectives – The current study aimed to shed light on the severity of fatigue in an early OA cohort and tried to identify subgroups with distinct long term trajectories of fatigue over time. Differences between these fatigue groups were explained by using radiographic OA severity, age and gender.
Method – Longitudinal data of 1000 early OA patients of the CHECK cohort were used. Each year for seven years, the fatigue level was measured using the Short Form 36 vitality scale. Radiographic OA severity was assessed at baseline with the Kellgren-Lawrence grading scale. Growth mixture modeling was applied in order to examine the severity of fatigue and to establish distinct fatigue groups. Multivariate regression analyses were used to examine the relation between the covariates and individuals’ group membership and interindividual differences in experienced fatigue within each fatigue group.
Results – The results indicated that around two-thirds of the sample experienced fatigue levels that were well below the average fatigue level in the general Dutch population and similar to the Dutch cancer population. One third of the sample showed a stable and low level of fatigue over time. The largest group displayed declining levels of fatigue over time. Individuals in the last fatigue group showed a U-shape fatigue pattern. Females and younger aged adults experienced higher levels of fatigue within each class, and females were more likely than males to exhibit a declining fatigue pattern. Gender and age were not related to the interindividual differences in fatigue change over time within the groups. Radiographic OA severity could not at all explain the heterogeneity in fatigue.
3
Acknowledgements
I am indebted and grateful to several persons who have, in various ways, contributed to the realization of this thesis.
First of all, I want to dedicate this thesis to my parents, Marija and Gerrit. They have always been standing completely behind me even throughout the years I experienced difficult times. My gratitude for their unconditional love and support is beyond words.
Christina thank you for always being relaxed and supportive, even in times when I thought this study would not turn out the way I expected and hoped for. Furthermore, you always knew how to stimulate me to see new or other possibilities instead of rigidly focusing on the limitations of my work. You have guided me professionally in the process of writing this thesis, while doing so in a gratifying manner. Consequently, I have always felt comfortable around you. I also like to thank you for providing the idea for this study as well as serving as an intermediary between me and CHECK.
Liseth you were of extreme importance and a big stimulating factor in the process of understanding the statistical approaches used. The discussions we had about the possibilities and drawbacks of latent growth modeling and how to approach our data increased my understanding of longitudinal modeling. Moreover you were important in improving my writing, making important comments about logical fallacies and sentences that didn’t make sense.
Finally, I also want to thank the CHECK steering committee for allowing me to use their data. Without their permission, I would not have been able to accomplish this thesis.
4
Contents
Abstract ... 2
Acknowledgements ... 3
Introduction ... 5
Method ... 8
Study design and recruitment ... 8
Study sample ... 8
Measures ... 9
Fatigue ... 9
OA severity ... 10
Statistical analyses ... 10
Results ... 12
Fatigue severity and classification of fatigue trajectories ... 12
Interindividual differences in initial level of fatigue and rate of fatigue change ... 15
Predicting class-membership and interindividual differences ... 15
Discussion ... 18
References ... 21
5
Introduction
Osteoarthritis (OA) is a chronic pain condition and the most common form of arthritis. The disease is considered as the degeneration of the joints leading to persisting joint pain and stiffness (Poole, 1999). OA is a major cause of severe and moderate disability, causing patients to load heavily on health care resources and its prevalence and incurring economic costs are projected to grow even further for the forthcoming decades as people continue to grow older and obesity becomes more frequent (Mathers, Boerma, & Ma Fat, 2008; Brooks, 2002; March & Bachmeier, 1997). One of the most prevalent complaints amongst OA patients, besides pain, is fatigue (Wolfe, 1999; Power, Badley, French, Wall, & Hawker, 2008). Nevertheless, as reported by patients, fatigue plays almost no role in treatment decisions and is mainly neglected in the communication between health care providers and patients (Gignac et al., 2006). This negligence might be due to a lack of knowledge concerning the impact of fatigue in OA. In addition, most research findings regarding fatigue in OA reflect the experiences of individuals with severe OA, leaving much unexplained about the possible role of fatigue in early OA.
To date, just a few studies were conducted on the subject of fatigue in OA patient populations and all these studies showed fatigue to be ubiquitously present in this patient group. Wolfe et al. (1996) found elevated levels of fatigue in approximately 90% of OA patients, while 41% of the OA patients showed clinically notable amounts of fatigue. This result was replicated by other studies (e.g. Bergman et al., 2009; Snijders et al., 2011). Nevertheless, these findings are primarily based on experiences of older-age adults with severe OA, even though other studies did indicate that middle-age adults with early or moderate OA also experience fatigue as a debilitating aspect influencing their physical functioning, social and daily activities, and mood (Gignac et al., 2006; Power et al., 2008). These latter studies, however, were merely assessing the qualitative aspects of experienced fatigue and its consequences. As a result, there is still little known about the actual severity of fatigue in early OA and whether this represents clinically relevant fatigue levels.
6 Notwithstanding this focus on physical functioning and fatigue, several studies also have correlated fatigue in OA patients to other variables. Fatigue was found to be negatively associated with work participation, overall health status and positive affect, and positively associated with pain, depression and sleep disturbance (Wolfe et al., 1996; Wolfe, 1999; Parrish, Zautra, & Davis, 2008; Sale, Gignac & Hawker, 2006; Stebbings, Herbison, Doyle, Treharne, & Highton, 2010; Snijders et al., 2011). Even though these studies document the relation between fatigue and disease parameters, other symptoms, and patient characteristics, there is still little known about the effect of OA severity, based on radiographic evidence, on fatigue. Furthermore, although age is a known risk factor for OA (March & Bachmeier, 1997), with older-age adults being more likely to develop OA, its role in relation to fatigue in OA is less clear. Gignac et al. (2006) found that middle-age OA adults reported more difficulties coping with OA symptoms and the consequences of the disease than older-age OA individuals. As a result, this experienced frustration and stress could lead to higher levels of fatigue among these younger aged OA individuals compared to older aged individuals. This assumption, however, has not been researched thus far. Another point that is often ignored in studies on fatigue in OA concerns the role of gender. Studies have shown gender differences regarding the incidence, prevalence and severity of hip and knee OA, with females frequently at higher risk (Maillefert et al., 2003; Srikanth et al., 2005). Consequently, most research into fatigue in OA is based on female participants, disregarding possible gender differences in fatigue. However, systematic reviews on gender differences in other chronic diseases, such as cancer, indicate that ignoring gender differences leads to doubtful and inappropriate conclusions and generalizations regarding symptoms such as fatigue (e.g. Miakowski, 2004). Taking into account radiographic OA severity, age and gender, interindividual differences in experienced fatigue are possibly better understood.
7 mechanisms of pain in OA and the course of the disease. We think this reasoning is sound and could also be applied to fatigue in OA, because longitudinally examining experienced OA fatigue could offer the potential of better understanding the role and impact of fatigue in early OA, and consequently providing the opportunity to guide health care professionals in making treatment decisions and building self-management strategies.
8
Method
Study design and recruitment
For the purpose of our study the first seven measurement points of the CHECK study were used. These measurement points were equally spaced with 12 months in between. CHECK, a Dutch acronym for Cohort Hip and Cohort Knee, is a prospective cohort study consisting of 1002 participants with early symptomatic OA of the knee or hip, who are being followed for a period of 10 years in total. The cohort, formed from October 2002 till September 2005, is the result of the collaboration of 10 general and academic hospitals in the Netherlands. The study was approved by the medical ethics committees of all participating centers.
For inclusion in the study, participants were required to have pain or stiffness of the knee or hip, were aged 45-65 years, had no previous consultation concerning these symptoms with the general practitioner more than six months before, and their complaints were not attributable to direct trauma. Participants were excluded in case the symptoms could be ascribed to any other rheumatic disease, such as rheumatoid arthritis or ankylosing spondylitis. Further exclusion criteria were Kellgren IV (i.e. severe radiographic OA) in at least one of the four joints, serious comorbidity that prevented physical evaluation, past hip or knee joint replacement, malignancy in the past five years, symptoms of local tendonitis or bursitis, presence of Baker´s cyste, and the inability to understand Dutch.
Participants were recruited in several ways. General practitioners in the neighborhood of the participating centers were asked to refer those patients that matched the inclusion criteria. Additionally, participants were recruited through advertisements and articles in local newspapers, and via the Dutch Arthritis Association website. All patients were checked for eligibility by physicians in the participating centers and asked to give their written informed consent.
Study sample
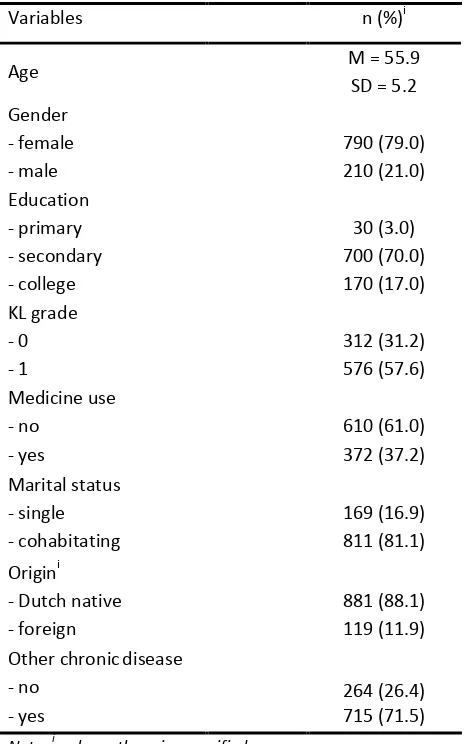
9 Table 1. Sample characteristics at baseline
Variables n (%)i
Age M = 55.9
SD = 5.2 Gender - female - male 790 (79.0) 210 (21.0) Education - primary - secondary - college 30 (3.0) 700 (70.0) 170 (17.0) KL grade - 0 - 1 312 (31.2) 576 (57.6) Medicine use - no - yes 610 (61.0) 372 (37.2) Marital status - single - cohabitating 169 (16.9) 811 (81.1) Origini
- Dutch native - foreign
881 (88.1) 119 (11.9) Other chronicdisease
- no - yes
264 (26.4) 715 (71.5) Note. i unless otherwise specified
Measures
Fatigue
Fatigue was measured using the vitality subscale of the Short-Form 36 Health Survey (SF-36), a generic instrument used for measuring health-related quality of life among a large range of chronic diseases, including OA (Ware, Snow, Kosinsky, & Gandek, 1993; Gandek et al., 1998; Turner-Bowker, Bartley, & Ware, 2002). The scale consists of four items, such as ‘Feels tired and worn out’. Each item has a 5-level likert scaling response format. Item scores were summated and linearly transformed to a scale ranging from 0 till 100, with lower scores indicating higher fatigue. Reliability analysis indicated a good internal consistency for the vitality scale, with Cronbach’s alpha and lambda-2 equaling 0.810 and 0.814, respectively. Aaronson et al. (1998) have provided normative data from samples from the general Dutch population (M = 68.6, SD = 19.3) and Dutch cancer population (M =
60.1, SD = 22.3). These point estimates were used to assess the fatigue severity in our early OA
10 OA severity
Kellgren and Lawrence (KL) radiographic classification system was used as a measure of OA severity. The KL grading scale contains five grades, going from 0 to 4, with 0 pointing out to no radiographic OA and 4 meaning severe readiographic OA (Kellgren & Lawrence, 1957). For each participant a KL grade was determined if possible with regard to their left and right knee, and left and right hip. The CHECK cohort consisted of OA individuals having KL grade 0 or 1 per joint. For modeling purposes a new variable was created with a group of individuals who had a KL grade of 0 for all joints and a group of individuals who had a KL grade of 1 on at least one joint (see table 1).
Statistical analyses
Growth mixture modeling (GMM) was applied using the Mplus version7 software (Muthén & Muthén, 2012). The GMM approach was used as it allows for unobserved heterogeneity in growth patterns of an outcome over time by modeling with categorical latent variables, which represent distinct latent trajectory classes, and continuous latent variables, which represent growth factors (Muthén & Shedden, 1999; Muthén, 2004). These growth factors provide information about the initial level of fatigue and the rate of fatigue change over time. Latent variables refer to variables that are not directly observable in the data but are inferred from the observed fatigue variables. GMM also allows for within class variation, and whether covariates relate to this mixture of classes and variation within classes (Muthén & Asparouhov, 2009). In other words, GMM provides the opportunity to assess whether the early OA cohort consists of different groups of fatigue patterns, while incorporating differences between individuals within all fatigue groups.
In order to assess the severity of fatigue, we first specified an unconditional (i.e. no covariates) single class growth model resulting in estimated means and standard deviations for fatigue at each time point. This model also allowed us to examine whether a single fatigue growth curve would fit the data, using conventional fit indices, such as the Root Mean Square Error of Approximation (RMSEA) and Standardized Root Mean Square Residual (SRMR) to assess model fit. Hereafter, unconditional latent K-class models were examined, initially using Latent Class Growth Analysis (LCGA), a special case of GMM that assumes that within each class all individual trajectories are equal (Nagin, 1999, Muthén & Múthen, 2000). LCGA was used as starting point for GMM because it allows for a clearer identification of distinct groups of fatigue trajectories and faster computation by setting all individual fatigue trajectories equal to its group mean fatigue trajectory (Kreuter & Muthén, 2008).
11 groups, by easing the LCGA assumption of no within class variance as well as by estimation of the covariances between growth factors and residuals for each class. The decision for unrestricting variances of growth factors was determined by observing the variation of fatigue patterns in the trajectory plots for each class. By freeing many variances at once, some GMMs resulted in negative estimates of growth parameter variances or correlations exceeding 1 for some classes, known as a Heywood case (Kolenikov & Bollen, 2012), resulting in inadmissible solutions. In case the negative variances were small and non-significant a conventional approach within structural equation modeling was used: constraining the variance parameters to zero (Bollen, 1989; Wang, Brown, & Bandeen-Roche, 2005). A model was regarded inappropriate in case negative variances were large and significant.
In opting for the best model solution several criteria were assessed, such as the Bayesian Information Criterion (BIC), the sample-size adjusted BIC (ABIC), the Bootstrapped Likelihood Ratio Test (BLRT) and the adjusted Lo-Mendel-Rubin Likelihood Ratio Test (ALRT). The BIC and BLRT have proven to perform the most consistent in distinguishing classes among all information criteria and likelihood ratio tests integrated in Mplus (Nylund, Asparouhov, & Muthén, 2007), while other simulation studies have established the strengths of the ABIC (Tofighi & Enders, 2007; Enders & Tofighi, 2008) and ALRT (Lo, Mendell, & Rubin, 2001). Additionally, entropy was used to determine the accuracy of classification, i.e. measuring how well individuals fit into a single class (Jedidi, Ramaswamy, & Desarbo, 1993). An entropy score exceeding 0.8 indicates a good separation of the classes (Muthén, 2004; Greenbaum, Del Boca, Darkes, Wang, & Goldman, 2005). The best model solution was based on the above fit indices and clinical relevance.
In case a best-fitting GMM was found, a conditional GMM (i.e. with covariates) was specified by incorporating age, gender and OA severity in the model. By doing so we were able to assess the association of these variables with the initial level of fatigue and the fatigue change over time via linear regressions and the prediction of class membership via multinomial logistic regressions, where the class membership variable was regressed on age, gender and OA severity. The prediction of class membership was accomplished by using a three-step approach, thereby minimizing the influence of age, gender and OA severity on class formation especially in case these covariates were highly correlated with fatigue (Vermunt, 2010).
12
Results
Fatigue severity and classification of fatigue trajectories
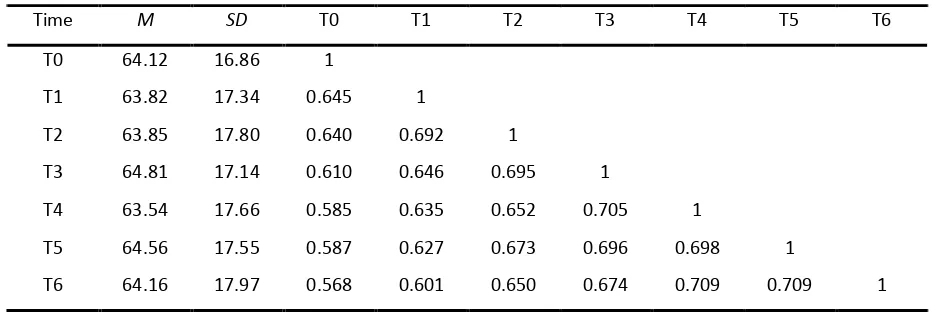
Our first step involved fitting a single curve growth model with a linear and quadratic growth factor to the data to assess the severity of fatigue over time. The decision for including a quadratic parameter was made to incorporate possible non-linear fatigue patterns. Table 2 reports the estimated means, standard deviations and correlations of fatigue for each time point. If the assumption of the early OA population following a single trajectory of fatigue would be true then it would follow from the estimated means that the fatigue level of early OA individuals was relatively stable over time. The fit of the single class model was good, X2 = 28.735, p > 0.05, RMSEA = 0.023, SRMR = 0.028 and CFI = 0.998. The information criteria are depicted in table 3.
[image:12.595.62.530.494.650.2]These estimated averages show that the average fatigue level of early OA individuals falls between the general population fatigue level and the fatigue level of the cancer population. This result suggests that early OA participants show signs of their fatigue level already being affected, albeit slightly, in this early stage of their disease. However, the standard deviations do suggest a large amount of individual variation of experienced fatigue around the mean fatigue levels, indicating substantial differences between individual fatigue scores per time point. The trajectory plot also showed that a substantial part of all individual fatigue trajectories did not follow a stable pattern. These observations supported our decision to search for different fatigue subpopulations.
Table 2. Means, standard deviations and Pearson’s correlations of fatigue for all time pointsi
Time M SD T0 T1 T2 T3 T4 T5 T6
T0 64.12 16.86 1
T1 63.82 17.34 0.645 1
T2 63.85 17.80 0.640 0.692 1
T3 64.81 17.14 0.610 0.646 0.695 1
T4 63.54 17.66 0.585 0.635 0.652 0.705 1
T5 64.56 17.55 0.587 0.627 0.673 0.696 0.698 1
T6 64.16 17.97 0.568 0.601 0.650 0.674 0.709 0.709 1 Note. i estimated means, s.d.’s and correlations based on a single growth curve model. N = 1000.
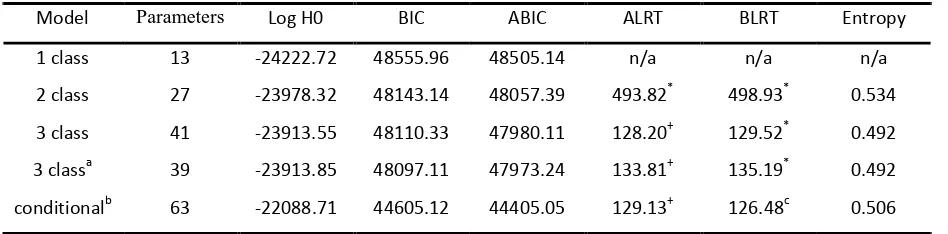
13 the individual fatigue patterns were allowed to vary around the mean fatigue pattern for each class. The variance of the quadratic growth factor was fixed at zero for all classes as the variation around the non-linear mean fatigue curve was non-significant and almost non-existent. Furthermore the residuals and covariance between the intercept and slope were estimated for each class separately. This decision was made since the plots showed a notable difference in individual variation around the mean experienced level of fatigue for each fatigue group and the covariances between the intercept and slope differed between the groups. The fit statistics were also in favor for a model solution with class specific residuals and covariance between intercept and slope, with lower values for the information criteria and higher entropy values. Moreover the K-class quadratic model solutions showed better fit indices than their linear-only counterparts, therefore the quadratic model solutions were chosen. The latter implies that a non-linear fatigue development was likely to be found for at least one fatigue group. Table 3 shows the quadratic growth mixture models and the corresponding fit indices. The two-class GMM yielded a better fit compared to the one class model following the steep decrease in the information criteria and significant likelihood ratio tests. Further investigation revealed a better fit for the three-class model compared to the two-class model. The linear and quadratic slope in the second class of the three-class solution, however, approached zero and were non-significant. Thus the three-class solution was revised in order to check for a more parsimonious model solution by fixing the means of the linear and quadratic slope parameters of the second class to zero. The revised three-class model resulted in a better fit compared to the unrevised model. A four-class model was not identified, indicating that four distinct groups of fatigue trajectories could not be found. Consequently the revised three-class model was chosen as the best model solution on account of the fit indices.
Table 3. ICi, LRTsii and entropy for all growth mixture model solutions
Model Parameters Log H0 BIC ABIC ALRT BLRT Entropy
1 class 13 -24222.72 48555.96 48505.14 n/a n/a n/a
2 class 27 -23978.32 48143.14 48057.39 493.82* 498.93* 0.534 3 class 41 -23913.55 48110.33 47980.11 128.20+ 129.52* 0.492 3 classa 39 -23913.85 48097.11 47973.24 133.81+ 135.19* 0.492 conditionalb 63 -22088.71 44605.12 44405.05 129.13+ 126.48c 0.506 Note. i information criteria, ii likelihood ratio tests. a revised model. b N = 888. n/a = not available. *p < 0.01, +p < 0.05.
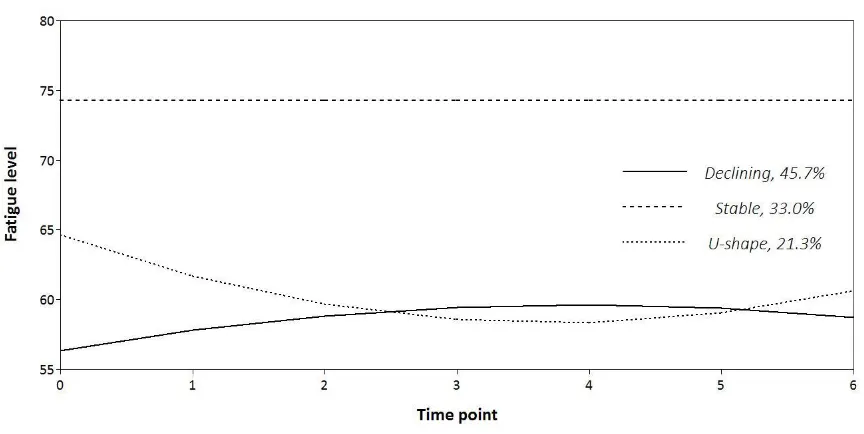
14 class, 33.0% of the early OA individuals showed stable levels of fatigue over time; and 3) U-shape class, 21.3% of the OA participants showed a fatigue pattern that could be described as an initial worsening of fatigue levels followed by an improvement towards the sixth year, although they experienced slightly more fatigue than at the beginning of the study. In addition, we found that the experienced fatigue of individuals in the Stable class had continuously less fatigue than individuals showing a Declining or a U-shape pattern and less fatigue compared to the general population. The latter two classes showed fatigue levels that were equal or even worse compared to the cancer population.
Figure 1. Fitted fatigue trajectory for each class and relative class size
15 of overlap concerning their fatigue development over time. On the other hand, a relatively good distinction was found between the Stable class and the other two classes.
Interindividual differences in initial level of fatigue and rate of fatigue change
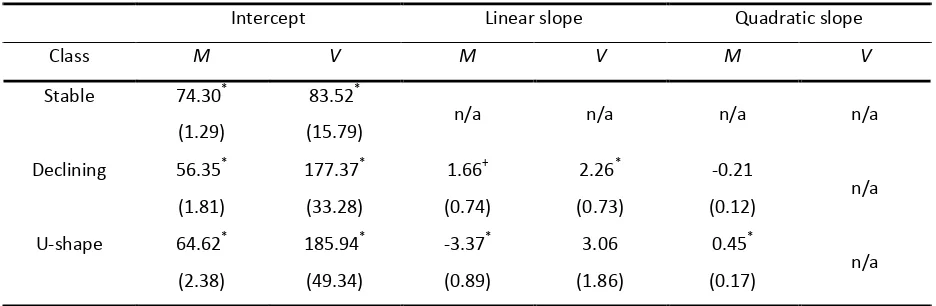
[image:15.595.64.532.481.634.2]In order to examine whether interindividual fatigue differences exist within all three fatigue groups, the parameter estimates for the initial level of fatigue and the fatigue change over time of the revised three-class model were inspected (see table 4). The variances of the initial level of experienced fatigue (i.e. intercept) in each class were significant, indicating that within each fatigue group individuals did not have the same level of experienced fatigue at baseline. The estimate for the linear slope’s variance was only significant for the Declining class, meaning that individuals within this fatigue group had different rates of fatigue change over time, with some of these early OA participants experiencing steeper declines of their fatigue over time than others. In contrast, the non-significance of the variance estimate of the linear slope in the U-shape fatigue group indicates that individuals within this class have a quite similar fatigue development over time. In sum, we found a large amount of interindividual variation of fatigue levels at baseline, implying that individuals within each group differed in their initial level of fatigue. The fatigue development, however, was the same for all individuals within each group, except for the early OA individuals in the Declining fatigue group.
Table 4. Estimates of the growth factors for the revised three-class unconditional GMM
Intercept Linear slope Quadratic slope
Class M V M V M V
Stable 74.30* (1.29)
83.52*
(15.79) n/a n/a n/a n/a
Declining 56.35* (1.81) 177.37* (33.28) 1.66+ (0.74) 2.26* (0.73) -0.21
(0.12) n/a U-shape 64.62*
(2.38) 185.94* (49.34) -3.37* (0.89) 3.06 (1.86) 0.45*
(0.17) n/a Note. Standard errors are in parentheses. M = mean, V = variance. n/a = not available. *p < 0.01, +p < 0.05.
Predicting class-membership and interindividual differences
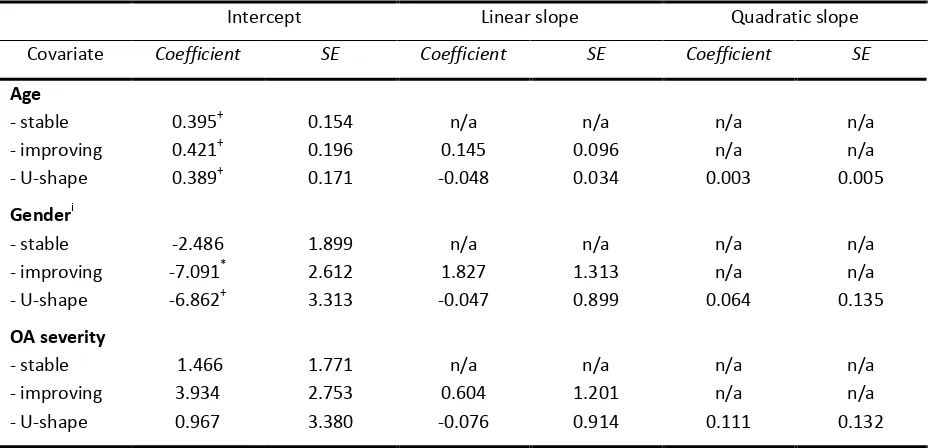
16 group). In order to explain these within-class differences a conditional model was specified, incorporating the covariates age, gender and OA severity. 112 participants had missing values on the KL grading for all four joints and were left out of the conditional model. Deleting these participants did not affect the three-class solution previously found. The relations of gender, age and OA severity with the growth factors were assessed via a multivariate linear regression (see table 5). Age was significantly related to the interindividual differences in the initial level of experienced fatigue within all classes. The regression coefficients were positive in all cases implying a higher fatigue level for younger aged OA adults on average. Gender was significantly related to the interindividual differences in the initial fatigue level within the improving and U-shape class, but not in the stable class. Within the Declining class the initial severity of fatigue was 7.1 points higher for females compared to males, while in the U-shape class females showed a higher fatigue severity of 6.9 points on average compared to males. Age and gender were not related to the interindividual differences in the rate of fatigue change over time, while OA severity was neither related to the initial level of fatigue nor the rate of fatigue development over time. Apparently, individuals with no radiographic evidence of OA and those with radiographic evidence did not seem to show different initial level of fatigue and rate of fatigue change within each fatigue group.
Table 5. Within-class multivariate regression of growth factors on age, gender and OA severity
Intercept Linear slope Quadratic slope
Covariate Coefficient SE Coefficient SE Coefficient SE
Age - stable - improving - U-shape 0.395+ 0.421+ 0.389+ 0.154 0.196 0.171 n/a 0.145 -0.048 n/a 0.096 0.034 n/a n/a 0.003 n/a n/a 0.005 Genderi - stable - improving - U-shape -2.486 -7.091* -6.862+ 1.899 2.612 3.313 n/a 1.827 -0.047 n/a 1.313 0.899 n/a n/a 0.064 n/a n/a 0.135 OA severity - stable - improving - U-shape 1.466 3.934 0.967 1.771 2.753 3.380 n/a 0.604 -0.076 n/a 1.201 0.914 n/a n/a 0.111 n/a n/a 0.132 Note. N = 888. SE = standard error. i 0 = male, 1 = female. n/a = not available. *p < 0.01, +p < 0.05.
17 0.35, p < 0.01. This indicated that the odds for females being in the Declining class compared to Stable class were 3.22 times higher than for males. Thus females were more likely than males to show a declining fatigue pattern, while males were more likely to show a stable and low level of fatigue development over time. Gender did not significantly relate to the comparison of log odds between the U-shape class and the stable class (b = 0.56, SE = 0.73, p = 0.44), nor between the U-shape and the Declining class (b = 0.63, SE = 0.93, p = 0.50). Thus females were not more likely than males to show a U-shape pattern compared to a Stable fatigue pattern and vice versa. Furthermore, females were not more likely than man to exhibit a declining fatigue pattern compared to a U-shape fatigue pattern. Age and OA severity was not significantly related to class membership, indicating that an individual’s presence in the U-shape class, Declining class or Stable class was attributable neither to age nor to OA severity.
18
Discussion
To our knowledge, this is the first study to examine the severity of fatigue and longitudinal patterns of fatigue in a large sample of early symptomatic OA individuals. Our findings revealed different early OA subpopulations of fatigue patterns and distinct levels of OA severity.
In accordance with qualitative reports on fatigue of middle-age OA individuals with early to moderate symptomatic OA (Gignac et al., 2006), signs of increased levels of fatigue were found for the greater part of our cohort as compared to the general Dutch population and cancer population (Aaronson, 1998). Furthermore, we found evidence for three fatigue groups, with distinct fatigue levels and fatigue change over time. These distinct levels of fatigue point out that a large proportion of early OA individuals (i.e. U-shape and Declining class) experience notable levels of fatigue already at the beginning of their disease process. Strikingly, these individuals showed a slightly declining fatigue pattern over time. This could mean that individuals initially experience problems coping mentally and physically with their disease, as several symptoms (e.g. pain) are causing a disruption of their daily lives and subsequently an increase of stress, leading to an increase in fatigue. However, as we know that fatigue is strongly related to pain (e.g. Zautra et al., 2007) and physical limitations (e.g. Murphy et al., 2011), possibly after some time a certain homeostasis arises, i.e. getting used to these factors, leading to less frustration and stress, and consequently less experienced fatigue.
19 Alongside predicting class-membership, above covariates were also used to explain the inter-individual differences in fatigue within classes. For all classes, we found age to be positively related to the inter-individual differences at baseline, with more fatigue at younger age. A possible explanation is that middle-age adults in general, compared to older-age adults, follow a life-style in which work, young children and social life are key elements. Although physical affections such as beginning OA are influencing the fatigue level of most people (e.g. Murphy et al., 2011), it could be that these younger adults with OA symptoms try to maintain their way of living, resulting in more coping problems and, thus, more pronounced fatigue than it normally would. This is line with Gignac et al. (2006) who found that middle-age OA adults more often reported being frustrated and stressed about the physical and social consequences of their disease than older-age adults. Gender also was significantly related to the inter-individual differences at baseline within the improving class and the U-shape class. In both cases females were more fatigued than males. It is well-known that women, around age 55, are getting more susceptible to severe OA symptoms than men (e.g. Maillefert et al., 2003). It is also known that pain is not only positively associated with OA severity, but also with fatigue (e.g. Parrish et al., 2008). It is, therefore, reasonable to assume that females have more pronounced experiences of fatigue than males. OA severity was not related to the interindividual differences in fatigue within each fatigue group. As discussed, this might be due to the measurement method used for assessing OA severity.
20 or larger changes of pain over time, are more prone to changes in their experienced fatigue. Therefore taking the role of pain, and other known correlates, into account is likely to lead to a better understanding of these fatigue groups. In our current study these variables were not available. Also the one-dimensional character of the SF-36 vitality scale deserves comment, as it is conceptually only linked to mental health (Ware et al., 1993). A recent study, however, examined the relation between fatigue and physical function and found a strong relationship between physical fatigue and physical functioning, whereas mental fatigue did not relate to physical functioning (Snijders, 2011). It is recommended to address this multi-dimensional aspect of fatigue in subsequent longitudinal studies, as to discover whether this multi-dimensionality has an effect on the search for different classes of fatigue trajectories. On the other hand, thus far no fatigue measurement scale has been validated for the OA population. Therefore, the use of a generic measure such as the SF-36 vitality scale was warranted.
Our research findings have several clinical implications. The results suggest that the observed heterogeneity could be ascribed to three qualitatively different groups of early OA patients. One group of early OA individuals (i.e. Stable group) seems clinically less important, as this group had systematically lower levels of fatigue than the average fatigue level in the general population and the fatigue levels were stable over time. Consequently, we think that these early OA individuals, predominantly males, do not need increased attention from health care providers. The other two fatigue groups, however, showed levels of fatigue and a development of fatigue that warrant close attention and monitoring by health care providers. By doing so may enhance our understanding of early OA patients’ degree of resilience in facing physical, mental and social challenges as well as improving our understanding of the disease process. Furthermore, especially females and younger aged early OA adults showed increased levels of fatigue. These gender and age differences, therefore, should also be taken into account in developing treatments, self-management strategies and advice by health care providers.
21
References
Aaronson, N. K., Muller, M., Cohen, P. D. A., Essink-Bot, M-L., Fekkes, M., Sanderman, R., ... Verrips, E. (1998). Translation, validation, and norming of the Dutch language version of the SF-36 Health Survey in community and chronic disease populations. Journal of Clinical
Epidemiology. 51(11), 1055-1068.
Bauer, D. J., & Curran, P. J. (2004). The integration of continuous and discrete latent variable models: potential problems and promising opportunities. Psychological Methods. 9(1), 3-29.
Bergman, M. J., Shahouri, S. S., Shaver, T. S., Anderson, J. D., Weidensaul, D. N., Busch, R. E., Wang. S., & Wolfe, F. (2009). Is Fatigue an Inflammatory Variable in Rheumatoid Arthritis (RA)? Analyses of Fatigue in RA, Osteoarthritis, and Fibromyalgia. The Journal of Rheumatology. 36(12), 2788-2794.
Bollen, K. A. (1989). Structural Equations With Latent Variables. New York: Wiley-Interscience.
Brooks, P. M. (2002). Impact of osteoarthritis on individuals and society: how much disability? Social consequences and health economic implications. Current Opinion in Rheumatology. 14(5), 573-577.
Dunlop, D. D., Semanik, P., Song, J., Manheim, L. M., Shih, V., & Chang R. W. (2005). Risk factors for functional decline in older adults with arthritis. Arthritis & Rheumatism. 52(4), 1274-1282.
Enders, C.K., & Tofighi, D. (2008). The impact of misspecifying class-specific residual variances in growth mixture models. Structural Equation Modeling: A Multidisciplinary Journal. 15(1), 75-95.
22 Gignac, M. A., Davis, A. M., Hawker, G., Wright, J. G., Mahomed, N., Fortin, P. R., & Badley, E. M.
(2006). "What do you expect? You're just getting older": A comparison of perceived
osteoarthritis-related and aging-related health experiences in middle- and older-age adults. Arthritis Rheumatism. 55(6), 905-912.
Greenbaum, P. E., Del Boca, F. K., Darkes, J., Wang, C., & Goldman, M. S. (2005). Variation in the drinking trajectories of freshman college students. Journal of Consulting and Clinical Psychology. 73(2), 229–238.
Holla, J. F. M., Van Der Leeden, M., Knol, D. L., Peter, W. F. H., Roorda, L. D., Lems, W. F., Wesseling, J., Steultjens, M. P. M., Dekker, J. (2012). Avoidance of activities in early symptomatic knee osteoarthritis: results from the CHECK cohort. Annals of Behavioral Medicine. 44(1), 33-42.
Jedidi, K., Ramaswamy, V., & Desarbo, W. S. (1993). A maximum likelihood method for latent class regression involving a censored dependent variable. Psychometrika. 58(3), 375–394.
Kreuter, F., & Muthén, B. (2008). Longitudinal modeling of population heterogeneity: Methodological challenges to the analysis of empirically derived criminal trajectory profiles. In G. R. Hancock & K. M. Samuelsen (Eds.), Advances in Latent Variable Mixture Models (pp. 53-75). Charlotte, NC: Information Age Publishing, Inc.
Kollenikov, S., & Bollen, K. A. (2012). Testing negative error variances: is a Heywood case a symptom of misspecification? Sociological Methods & Research. 41(1). 124-167.
Lo, Y., Mendell, N. R., & Rubin, D. B. (2001). Testing the number of components in a normal mixture. Biometrika. 88(3), 767–778.
Maillefert, J. F., Guegen, A., Monreal, M., Nguyen, M., Berdah, L., Lequesne M., ... Dougados, M. (2003). Sex differences in hip osteoarthritis: results of a longitudinal study in 508 patients. Annals of the Rheumatic Diseases. 62(10), 931-934.
23 Mathers, C., Boerma, T., & Ma Fat, D. (2008). The global burden of disease: 2004 update. Geneva:
World Health Organization.
Miakowski, C. (2004). Gender differences in pain, fatigue, and depression in patients with cancer. Journal of the National Cancer Institute. 32, 139-143.
Murphy, S. L., Lyden, A. K., Phillips, K., Clauw, D. J., & Williams, D. A. (2011). Subgroups of older adults with osteoarthritis based upon differing comorbid symptom presentations and potential underlying pain mechanisms. Arthritis & Research Therapy. 13: R135.
Murphy, S. L., Smith, D. M., Clauw, D. J., & Alexander, N. B. (2008). The impact of momentary pain and fatigue on physical activity in women with osteoarthritis. Arthritis & Rheumatism. 59(6), 849-856.
Muthén, B. (1999). Finite mixture modeling with mixture outcomes using the EM algorithm. Biometrics. 55, 463-469.
Muthén, B. (2004). Latent variable analysis: Growth mixture modeling and related techniques for longitudinal data. In D. Kaplan (Ed.), Handbook of quantitative methodology for the social sciences (pp. 345-368). Thousand Oaks, CA: Sage.
Muthén, B., & Asparouhov, T. (2009). Growth mixture analysis: Models with non-Gaussian random effects. In G. Fitzmaurice, M. Davidian, G. Verbeke, & G. Molenberghs (Eds.), Advances in Longitudinal Data Analysis (pp. 143-165). Boca Raton, FL: Chapman & Hall/CRC Press.
Muthén, B., & Muthén, L. K. (2000). Integrating person-centered and variable-centered analyses: Growth mixture modeling with latent trajectory classes. Alcoholism: Clinical andExperimental Research. 24(6), 882-891.
Muthén, L. K., & Muthén, B. (1998–2012). Mplus user’s guide. Seventh Edition. Los Angeles, CA: Muthén & Muthén.
24 Nylund, K. L., Asparouhov, T., & Muthén, B. (2007). Deciding on the number of classes in latent class
analysis and growth mixture modeling: A Monte Carlo simulation study. StructuralEquation Modeling: A Multidisciplinary Journal. 14(4), 535–569.
Parrish, B. P., Zautra, A. J., & Davis, M. C. (2008). The role of positive and negative interpersonal events on daily fatigue in women with fibromyalgia, rheumatoid arthritis, and osteoarthritis. Health Psychology. 27(6), 694-702.
Poole, A. R. (1999). An introduction to the pathophysiology of osteoarthritis. Frontiers in Bioscience. 4, 662-670.
Power, J. D., Badley, E. M., French, M. R., Wall, A. J., & Hawker, G. A. (2008). Fatigue in osteoarthritis: a qualitative study. BMC Musculoskeletal Disorders. 9(63).
Sale, J. E., Gignac, M., & Hawker, G. (2008). The relationship between disease symptoms, life events, coping and treatment, and depression among older adults with osteoarthritis. The Journal of Rheumatology. 35(2), 335-342.
Schepens, S. L., Kratz., A. L., Murphy, S. L. (2012). Fatigability in osteoarthritis: effects of an activity bout on subsequent symptoms and activity. Journal of Gerontology. 67(10), 1114-1120.
Schneider, S., Junghaenel, D. U., Keefe, F. J., Schwartz, J. E., Stone, A. A., & Broderick, J. E. (2012). Individual differences in the day-to-day variability of pain, fatigue, and well-being in patients with rheumatic disease: associations with psychological variables. Pain. 153(4), 813-822.
Snijders, G. F., Van Den Ende, C. H. M., Fransen, J., Van Riel, P. L. C. M., Stukstette, M. J. P. M., Defoort, K. C., ... Den Broeder, A. A. (2011). Fatigue in knee and hip osteoarthritis: the role of pain and physical function. Rheumatology. 50(10), 1894-1900.
25 Stebbings, S., Herbison, P., Doyle, T. C., Treharne, G. J., Highton, J. (2010). A comparison of fatigue
correlates in rheumatoid arthritis and osteoarthritis: disparity in associations with disability, anxiety and sleep disturbance. Rheumatology. 49(2), 361-367.
Taylor, A. H., Cable, N. T., Faulkner, G., Hillsdon, M., Narici, M., & Van Der Bij, A. K. (2004). Physical activity and older adults: a review of health benefits and effectiveness of interventions. Journal of Sports Sciences. 22(8), 703-725.
Tofighi, D., & Enders, C.K. (2007). Identifying the correct number of classes in growth mixture models. In G. R. Hancock & K. M. Samuelsen (Eds.), Advances in latent variable mixture models (pp. 317-341). Greenwich, CT: Information Age.
Turner-Bowker, D.M., Bartley, P.J., & Ware, J.E. (2002). SF-36 Health Survey and SF Bibliography. Lincoln: Quality Metric Incorporated.
Vermunt, J. K. (2010). Latent Class Modeling with Covariates: Two Improved Three-Step Approaches. Political Analysis. 18, 450-469.
Wang, C.-P., Brown, C. H., Bandeen-Roche, K. (2005). Residual Diagnostics for Growth Mixture Models: Examining the Impact of a Preventive Intervention on Multiple Trajectories of Aggressive Behavior. Journal of the American Statistical Association. 100(471), 1054-1076.
Ware, J. E., Snow, K. K., Kosinski, M., & Gandek B. (1993). SF-36 Health Survey Manual and Interpretation Guide. Boston, MA: New England Medical Center, the Health Institute.
Wolfe F. (1999). Determinants of WOMAC function, pain and stiffness scores: evidence for the role of low back pain, symptom counts, fatigue and depression in osteoarthritis, rheumatoid arthritis and fibromyalgia. Rheumatology. 38(4), 355-361.
Wolfe F., Hawley D. J., & Wilson K. (1996). The prevalence and meaning of fatigue in rheumatic disease. The Journal of Rheumatology. 23(8), 1407-1417.
26
Appendix A
Fit of LCGA models
Model Parameters Log H0 BIC ABIC ALRT BLRT Entropy