Abstract—In order to study the complex interactions and positional relations between metabolic enzymes such as CYP and efflux transporters such as PGP, we constructed an In Silico Transwell Device (ISTD) and an In Silico Intestine Device (ISID) to represent in vitro cell culture systems and human small intestines. Both are 3-dimentional, discrete event, discrete space, agent-based models. An ISID is a modification of an ISTD. To study CYP–PGP interactions, we completed 5 simulated cases using both devices. Simulation results showed: 1) with the ISTD under certain circumstances, either synergistic or antagonistic, or no effects occurred; 2) backflow occurring in the ISTD led to CYP–PGP interactions for the drugs whose CYP reaction rates are slow; whereas 3) backflow occurring in the ISTD is not an essential condition for the drugs which react quickly with CYP; and 4) CYP–PGP interactions do not occur in the ISID, suggesting that they are unlikely in human intestines. We also simulated the effect of proximity between CYP and PGP using the ISTD. The simulation results showed: (1) under the same PGP condition, transport is determined dominantly by the closeness of CYP to the membranes (either the apical membrane or the basal membrane); (2) unexpectedly, the asymmetric localization of PGP on the apical membrane does not facilitate more transport, but it slightly enhances metabolism.
Index Terms—agent-based model, metabolism, synergy, transport
I. INTRODUCTION
In the intestinal epithelium, at least two types of proteins function to decrease absorption of potentially toxic xenobiotics: phase I metabolic enzymes, such as cytochrome P450 (or abbreviated as CYP) and efflux transporters, such as P-glycoprotein (or abbreviated as PGP). CYPs are hemoproteins tethered on the endoplasmic reticulum membrane; they metabolize xenobiotics by adding polar groups. PGP are transmembrane proteins located only on the apical membrane of epithelial cells; they pump absorbed intracellular xenobiotics back into the lumen of the intestine. Some researchers suggested that PGP and CYP act synergistically to reduce the absorption of dual-substrate compounds. This is evidenced by the observation that the transport increase by inhibiting CYP and PGP together was greater than the sum of the transport
Manuscript received August 10, 2007.
L. G. Author is with the Graduate Group in Comparative Biochemistry, University of California at Berkeley, Berkeley, CA, 94530 USA (phone: 510-703-5359; e-mail: lanxia@ berkeley.edu).
increase by inhibiting CYP and PGP separately. However, the supporting results for synergy were obtained from in vitro systems or perfused intestines, where experimental conditions differed from in vivo conditions [1] [2].
Some other qualitative evidence also seems to suggest synergy between CYP and PGP. One case is the immuno -staining image of epithelial cells, which showed that CYP is preferentially located closer to the apical membrane, where PGP exists, rather than the basal membrane, where PGP does not exist [3].
Simulation is a powerful tool for gaining deeper insight into such biological complexity. Using simulated systems, we are able to study whether CYP–PGP synergy exists in vitro and in vivo, and if they do, what are the critical conditions. The answers to these questions are very attractive from a theoretical point of view. And this report is aimed to accomplish such goals.
II. METHODS
The ISTD and the ISID are 3D discrete event, discrete space, stochastic models that use the synthetic modeling method. The models were coded using the Java-Swarm platform. The Java-Swarm platform gives direct access to the Swarm libraries and enables the created software to be easily integrated with statistical and mathematical software, such as R and Matlab, for post-simulation data processing.
A. Model Structures and Components
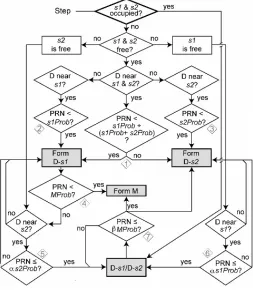
Model structure of the ISTD is shown in Fig 1. Simulated biological mechanisms of passive transport through cells and enzymatic reactions were those reported previously [5]. DRUGS1
were mobile objects; CYP and PGP were not. An ISID is a modification of an ISTD. The model structure of the ISID is shown in Fig 2. There are several major differences in the ISID: (1) S1 of the ISID is a cylinder structure filled with intestinal lumen contents , unlike the flat 3-dimensional apical compartment in the ISTD, (2) the direction along the y-axis in the ISID represents the proximal distal terminal of the intestine and as a result, S2-S5 spaces are wrapped into cylinder structures, rather than torus structures as done in the ISTD, and (3) an added bias factor, e, forces the biased flow along the y direction in S1 space of the ISID.
1 SMALL CAPS: in silico analogues of biological referent component.
Study of Metabolic Enzyme-Efflux Transporter
Relations with
in Silico
Devices
B. Discrete Event Schedules
Discrete event simulation can be more efficient than discrete time simulation [4]. The ISTD and the ISID simulations are advanced by dynamically scheduled discrete events occurring at realistic times. Two levels of agents manage event scheduling. At the bottom level, four scheduling agents,
Transit Event Scheduler, Lateral Event Scheduler, Enzyme Event Scheduler, and Transport Event Scheduler control the progress of DRUG relocation and transition into adjacent spaces, lateral diffusion within each space, metabolism and efflux transport, respectively. Above these agents is the master
Schedule Event agent; it coordinates the activities of the other four sub-agents.
C. Passive Diffusion
The details of Passive Diffusion were described in our previous paper [5]. Passive diffusion was composed of vertical diffusion and transition between and within spaces, and lateral diffusion within a space. Lateral diffusion was designed as a random process that obeys a Gaussian distribution. Vertical transition was achieved by a complex algorithm incorporating a series of rules (logic) based on probabilistic criteria. The rules considered events occurring transcellularly as well as in tight junctions. The validation was reported in [5].
D. Enzymatic Reaction & Efflux Transport Algorithm
Details of the enzymatic reaction were explained in the previous paper [5]. Briefly, the enzymatic reaction algorithm was a stochastic analog of the conventional kinetic model. Each
ENZYME agent changes its state depending on the internal logic, local environment and probabilities from a pseudo-random number generator (RNG). Each ENZYME has two-substrate binding sites, so that the atypical self-activation and/or self-inhibition can be simulated. The logic of 2-site ENZYME is
shown below in Fig 3. In this report, for simplicity, we inactivated site 2, so that the reactions behaved as
Michaelis-Menten kinetics. Efflux transport of PGP mechanism was similar to that of enzymatic reactions, except that: (1) PGP
released the bound substrate in its original form, instead of turning the substrate to metabolites as was done by ENZYME; (2)
PGP translocated substrates into S1 (lumen) space, instead of releasing the metabolites in S3 as was done by ENZYME.
E. CYP-PGP Interaction Experiments Set Up
To make the results directly comparable, simulation surfaces in the ISTD and the ISID have the same width x=2π×1.5cm and length y=5cm. All simulations were initiated with 1000 DRUG
agents (MW=150, logP=2 pKa=6.5, base) in S1. The numbers of DRUG agents transported were collected in S5. All
simulations use the same numbers of CYP (n=480) and PGP
(n=419). They follow the reported in vivo distribution patterns [6] [7]. The cycling time of both PGP and CYP are set to be 5 seconds or 0.5 second, depending on the case. For simplicity, we set parameters prob. (PGP binds DRUGS) = prob. (PGP
releases DRUGS) = P1 and prob. (CYP binds DRUGS) = prob. (CYP
releases DRUGS) = P2. In this report, the values of P1/2 = [0, 0.5,
1], total 9 combinations.
The ISTD had a grid size of 15×800. In the ISTD, DRUGs were seeded randomly in S1. A DRUG agent can randomly diffuse in S1 space in the x, y, and z directions. CYP and PGP
both had a substrate detecting Moore radius=1. We collected the number of drug agents transported to S5 after simulating for 1 hour.
The ISID had a grid size of 75×4000. In the ISID 3ml of
[image:2.612.52.301.54.316.2]DRUGs were seeded at the proximal terminal in S1. We assumed Fig 1 Top: in vitro transwell.
A, B: apical, basal compartment; C: epithelial cell; F: filter; V: an arbitrary vertical column section through the system. Bottom: ISTD. e: 1/10,000 simulated 3D elements of S1; S1–S5: in silico representation of apical compartment, apical cell membranes, intracellular spaces, basolateral cell membranes, and the basal compartment of the transwell device
Fig 2 The structure of ISID.
S1: intestinal content; S2–S4: the same as in Fig.1; S5: blood; Arrow: luminal flow direction
[image:2.612.315.568.128.420.2]DRUGs were in solution and ignored the DRUG disassembling process. CYP and PGP both had a substrate detecting Moore radius=5, so that their effective range was the same as that in ISTD. Besides randomly diffusion in S1 space on (x, y, z) directions, luminal flow was introduced in the form of the bias factor e. We collected DRUGs excreted at the distal terminal and optimized e=45 by setting the mean transit time of DRUGs to be 3 hours.
F. CYP Localization Experiments Set Up
The ISTD had a grid size of 100×100 to represent the 4.71cm2 transwell surface area. As the focus of the experiments was CYP localization in the cell, we eliminated the tight junction (TJ) transport by assigning TJ%=0. All simulations started with 1000 drugs (MW=500, neutral, logP=3) in S1 space, and ended at 1 hour. All simulations used the same numbers of CYP (n=400)
and PGP (n=660). They both had uniform random distributions. The cycling time for both PGP and CYP were set to be 5 seconds. For simplicity, we set parameters prob. (PGP binds DRUGS) = prob. (PGP releases DRUGS) = prob. (CYP binds DRUGS) = prob. (CYP releases DRUGS) = 1. Metabolites were assumed to inherit all the physicochemical properties of parent drugs. For simplicity, we assumed metabolites were neither substrates of PGP nor CYP.
III. RESULTS A. Model Validation
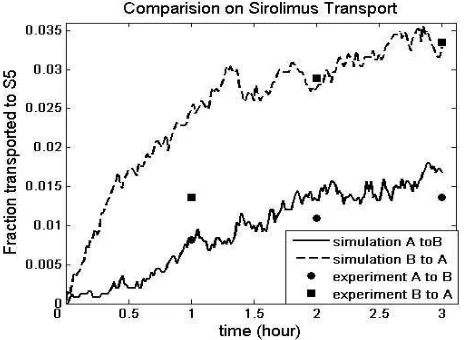
The validity of the passive diffusion module and enzymatic reaction module of the ISTD were shown in [5]. Before we used the ISTD and ISID to study relations of CYP–PGP, we first illustrated the applicability of the full model ISTD to drug transport in general. We chose Sirolimus (MW=914, pKa=10.4, logP= 5.773, base), a dual substrate of CYP and PGP, as an example. As shown in Fig 4, during the 3 hours course, the simulation results are very close to the experimental results of Cummins et al. [8].
Fig 4 Comparison of Sirolimus transport between ISTD and experiment. Solid dots are the means (n=3) of experimental transport results from [8]. (■) drug was dosed in the apical compartment, and collected in the basal compartment; (●) drug was dosed in the basal compartment, and collected in the apical compartment. Curves are the means (n=5) of simulated results from ISTD. (N)
DRUGwas dosed in S1 and collected in S5; (--) DRUG was dosed in S5 and collected in S1.
B. Results on Dual Substrate Mediated CYP–PGP Interactions from Five Cases
[image:3.612.314.567.203.317.2]Table I shows the major parameters for the 5 cases studied. For the in vitro simulations, backflow was allowed from S5 to S1, but no luminal flow existed in S1; for the in vitro-in vivo simulations, neither backflow nor luminal flow was allowed; for the in vivo simulations, luminal flow was allowed but not backflow. In each case, we conducted nine probabilistic parameter combinations between PGP and CYP. In each combination, we ran 10 repetitions. In the following, we describe the results of these 5 cases in order.
Table I Cases in the study Case condition luminal
flow
backflow CYP/PGP cycling time (sec)
1 In vitro no yes 5
2 hybrid no no 5
3 hybrid no no 0.5
4 In vivo yes no 5
5 In vivo yes no 0.5
Table II shows the two-way ANOVA analysis of the effect of PGP, CYP, and their interactions on transport, using the ISTD. All three P-values are much smaller than the significance level (α=0.01), indicating that PGP,CYP, and their interaction effects all contribute significantly to the transport. To further explore the types of interactions between PGP − CYP, we list the mean
[image:3.612.49.286.490.660.2]transport data in table III.
Table II Case One ANOVA (α=0.01)
source SS df MS F Prob>F
PGP 9243 2 4621.5 17.56 4.61e-07a CYP 15482 2 7741.1 29.42 2.49e-10b interaction 6561.5 4 1640.4 6.23 2.00e-04c
error 21313 81 263.12 total 52599 89
[image:3.612.313.566.565.642.2]Model: Data= PGP effect + CYP effect + interaction effect +error a: reject the null hypothesis that PGP has no effect on transport b: reject the null hypothesis that CYP has no effect on transport c: reject the null hypothesis that PGP and CYP do not interact
Table III Mean transport data in case one P2 P1 0.0 0.5 1.0
0.0 390.5
S (E:386.9)
376.1 A
(E:417.1) 374.6
0.5 356.0
n
(E:356.5)
374.6 A
(E: 386.7) 344.2
1.0 343.2 373.4 330.9
E: expected transport if CYP and PGP do not interact (e.g. 386.9 = 374.6 + 343.2 -330.9). S: synergy; A: antagonism n: no interaction
When neither PGP nor CYP was inhibited (P1= P2=1), 33.48% drugs were transported; when PGP was fully inhibited (P1=0), there was 0.2% increase of the transport, and when CYP
transport when both PGP and CYP were fully inhibited should be (33.48+4.24+0.2) %=37.92%. However the observed transport was 38.99%, 2.82% higher than the expected transport, indicating synergistic interactions consistent with the previous report [9]. However, we also observed antagonistic interactions: when PGP was only partially inhibited (P1=0.5), but CYP was completely (P2=0) or partially (P2=0.5) inhibited, as shown in table III. Also no significant interactions appeared, when CYP was partially inhibited, but PGP fully inhibited. The complex results suggest that when there is backflow as in vitro conditions, interactions can appear either in the form of synergy or in the form of antagonism, mainly depending on the degrees of inhibitions on PGP.
Some researchers have raised the question that the synergistic interactions observed in vitro could be an artifact due to the significant backflows occurring in the in vitro system, unlike in the intestines. To test this hypothesis, we terminated the backflow in S5 of the ISTD. This scenario mimics the in vivo absorption: once a drug molecule appears in the blood, it circulates with the blood flow and does not re-renter the epithelial cells. We set the substrate- CYP turn-over rate slow (CYP cycling time=5 seconds) and conducted similar experiments as before. Two-way ANOVA analysis on transport data shows no significant contribution from either CYP
effect or CYP – PGP interaction effect. The result suggests that
[image:4.612.313.568.62.149.2]backflow does cause CYP – PGP interactions for some drugs. Table VI Case Two ANOVA (α=0.01)
source SS df MS F Prob>F
PGP 7029.1 2 3514.5 19.05 1.6566e-07
CYP 589.6 2 294.8 1.60 0.2086d
interaction 1165.2 4 291.3 1.58 0.1878e error 14944 81 184.5
total 23728 89
d: fail to reject the null hypothesis that CYP has no effect on transport e: fail to reject the null hypothesis that PGP and CYP do not interact
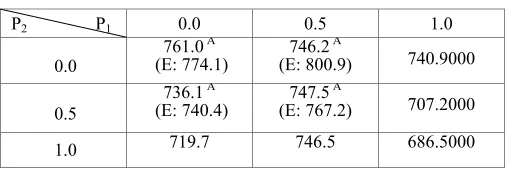
[image:4.612.313.567.361.525.2]If the turn-over rates between the enzyme/ transport and substrates are much greater than the range of the parameter values in case two, are interactions still possible even if there is no backflow? To answer this question, we speed up the CYP / PGP simulation cycle to be t=0.5 second in the ISTD and repeated experiments as in Case two. Under the new conditions, we observe that not only PGP and CYP themselves, but also their interactions contribute significantly to transport (table V). However, further analysis reveals that the interactions under such conditions are antagonistic instead of synergistic (table VI).
Table V Case Three ANOVA (α=0.01)
source SS df MS F Prob>F
PGP 20506 2 10253 74.07 0f
CYP 15373 2 7686.7 55.53 6.6613e-16g interaction 8363.2 4 2090.8 15.10 2.8905e-9h
error 11213 81 138.43 total 55456 89
f: reject the null hypothesis that
PGP has no effect on transport
g: reject the null hypothesis that
CYP has no effect on transport
h: reject the null hypothesis that
PGP and CYP do not interact
Table VI Mean transport data in case three P2 P1 0.0 0.5 1.0
0.0
761.0 A (E: 774.1)
746.2 A
(E: 800.9) 740.9000
0.5
736.1 A (E: 740.4)
747.5 A
(E: 767.2) 707.2000
1.0 719.7 746.5 686.5000
The previous scenarios all mimicked the situation that S1 does not have luminal flow, which is not true in vivo. We next introduced a bias factor e in S1 of the ISID to simulate intestinal flow. We analyzed the results at 3 hours, when the maximum of drug excretion rate was reached [10]. Case four represents slow CYP -substrate reaction rate, with the CYP cycling time t=5 seconds. As shown in table VII, the P-value (0.6158) of CYP –
PGP interactions is much greater than the significance level
α=0.01. It is also much larger than any other interaction P-value of previous simulations, indicating that the evidence for interactions is lacking. We also speed up the reaction turn-over rate between CYP -substrate and set CYP cycling time
t=0.5 second. More extreme than the result in case four, we obtained an even larger P-value (0.8704), which indicates no evidence of CYP – PGP interactions (table VIII).
Table VII Case Four ANOVA (α=0.01)
source SS df MS F Prob>F
PGP 3142. 2 1571.1 5.7671 0.0067
CYP 2414.2 2 1207.1 4.4309 0.0190
interaction 732.09 4 183.02 0.6718 0.6158i error 9807.2 36 272.42
total 16096 44
Table VIII Case Five ANOVA (α=0.01)
source SS df MS F Prob>F
PGP 1856.6 2 928.29 2.1177 0.1351
CYP 3918.0 2 1959.0 4.4690 0.0185
interaction 541.02 4 135.26 0.3086 0.8704i Error 15781 36 438.36
Total 22096 44
i: fail to reject the null hypothesis that PGP and CYP do not interact
C. Results on Dual Substrate Mediated CYP –PGP Interactions from Five Cases
Some researchers proposed that vertical proximity of CYP to PGP is one reason to explain the synergy between CYP and PGP. In other words, as CYP is located closer to the apical membrane, the permeability of the drug decreases.
To test this hypothesis, we subdivided S3 space in the ISTD into 1000 equally spaced compartments along the vertical direction. We arbitrarily assigned the vertical substrate-detect range of PGP to be the top-most compartment in S3. We assigned the vertical substrate-detect range of CYP to be one compartment distance. We randomly seeded the CYP in the top
[image:4.612.48.305.378.462.2] [image:4.612.46.301.628.701.2]As expected, PGP causes decrease in transport, drug cellular accumulation and metabolite production (Fig 5A, B, C and Fig 6). Surprisingly, the localization of PGP on apical membrane
does not lead to more transport, comparing when CYP is closer to the apical membrane to when CYP is equally distant from the
basal membrane (Fig 6). This was further confirmed by one-way ANOVA (P-value=0.6572, data not shown). But PGP
on apical membrane does facilitate more production of metabolites, comparing when CYP is closer to the apical membrane to when CYP is equally distant from the basal membrane (Fig 6). The proximity of CYP to the apical membrane also has some other effects. The closer CYP is to the membranes (either apical or basal membrane), the lower the transport is (Fig 5A), the lower the cellular drug accumulation is (Fig 5B) and the more metabolites it can produce (Fig 5C and Fig 6).
Effect of CYP Location on Transport
250 270 290 310 330 350 370 390
1 333 666 999
compartment index d ru g o b je c ts t ra n s p o rt e d No PGP with PGP
Effect of CYP Location on Cellular Drug Accumulation 1 1.5 2 2.5 3 3.5 4
1 333 666 999
compartment index d ru g c e llu la r a c c u m u la ti o n No PGP with PGP
Effect of CYP Location on Metabolism
0 20 40 60 80 100 120
1 333 666 999
[image:5.612.316.544.120.304.2]compartment index d ru g m e ta b o liz e d No PGP with PGP
Fig 5 Effect of CYP location on A: transport, B: cellular drug accumulation and C: drug metabolism. The data are means from 10 repetitions at the end of one hour, and the error bars are the standard deviation. Gray bars represent no PGP conditions, and empty bars represent the conditions with PGP on the apical
membrane. The x-axis is the index of the compartment from apical membrane. In A: Y-axis is the number of drug objects transported. In B: Y-axis is the number of drug objects accumulated in cells. In C: Y-axis is the number of drug objects metabolized in cells *: significantly different at α=0.05 level between “No PGP” and “with PGP” conditions, under the same CYP location. **: significantly different at α=0.01 level between “No PGP” and “with PGP” conditions, under the same CYP location.
Fig 6 Time course plot of CYP positional effect on metabolism. The data are means from 10 repetitions. Empty marks are results of CYP in the 1st
compartment: (□) without PGP, (○) with PGP. Solid marks are results of CYP in 999th compartment: (♦) without PGP, (●) with PGP.
IV. CONCLUSION
[image:5.612.53.294.254.673.2]ACKNOWLEDGMENT
The author thanks David Garmire for his help on the software techniques, and comments on the manuscript, and Anthony C. Hunt for providing sketches of figure 1 and 2.
REFERENCES
[1] L. Z. Benet, C. L. Cummins, C. Y. Wu, Unmasking the dynamic interplay between efflux transporters and metabolic enzymes. Int J Pharm. 2004. 277(1-2):3-9.
[2] L. Z. Benet, C. L. Cummins, C. Y. Wu, Transporter-enzyme interactions: implications for predicting drug-drug interactions from in vitro data. Curr Drug Metab. 2003. 4(5):393-8.
[3] P. B. Watkins, The barrier function of CYP3A4 and P-glycoprotein in the small bowel Advanced Drug Delivery Reviews, 1997, 27(2-3): 161-170. [4] P. Ball, Introduction to Discrete Event Simulation, 2nd DYCOMANS
workshop on "Management and Control: Tools in Action,” Algarve, Portugal, 1996, pp. 367-376.
[5] L. X. Garmire, D. G. Garmire, C. A. Hunt, An in silico transwell device for drug transport and drug-drug interaction studies. Pharm Res, 2007. In press.
[6] S. Mouly, M.F. Paine, P-glycoprotein increases from proximal to distal regions of human small intestine, Pharm Res. 2003. 20(10):1595-9. [7] M. F. Paine, M. Khalighi, J. M. Fisher, D. D. Shen, K. L. Kunze, C. L.
Marsh, J. D. Perkins, and K. E. Thummel. Characterization of interintestinal and intraintestinal variations in human CYP3A dependent metabolism. J. Pharmacol. Exper. Ther. 1997. 283:1552–1562 [8] C. L. Cummins, W. Jacobsen, U. Christians, L. Z. Benet. CYP3A4-
transfected Caco-2 cells as a tool for understanding biochemical absorption barriers: studies with sirolimus and midazolam. J Pharmacol Exp Ther 2004, 308(1):143-55
[9] Y. Liu, C. A. Hunt, Mechanistic study of the cellular interplay of transport and metabolism using the synthetic modeling method. Pharm Res. 2006. 23(3):493-505