Abstract— With increasing availability of computing system the enterprises are becoming increasing dependent on IT infrastructure and thus becoming vulnerable to threats. To assess the security of enterprise network, one must first understand how vulnerabilities can be combined for an attack. Such an understanding becomes possible with recent advances in modeling the composition of vulnerabilities as attack graphs. An attack graph is a general formalism used to model security vulnerabilities of a system and all possible sequences of exploits which an intruder can use to achieve a specific goal. However, as the size and computational complexity of attack graphs greatly exceeds human ability to visualize, understand and analyze, a model is required to identify high probable paths of attack graphs that a potential attacker may follow. One method for handling attack graph complexity and scalability is to differentiate between likely and unlikely attack paths using threat modeling. Threat modeling is used during risk assessment to describe likely and unlikely adversary behavior, and so can be used for the same purpose during attack graph analysis and attack path identification out of it. The proposed approach uses a decision theoretic model to identify the most probable attack path using threat modeling.
Index Terms— attack graph, exploit, risk management, vulnerability, attack path.
I. INTRODUCTION
Today’s computer systems face sophisticated intrusions during which multiple vulnerabilities can be combined for reaching an attack goal. Appropriate vulnerability assessment is needed for risk management of enterprise network. The attack graph is a tool for estimating vulnerability correlations and thus helps in risk management. It provides a global view on system security against attacker’s goal. A large amount of previous approaches had been proposed for generating and analyzing attack graphs from a system administrator’s perspective. Attack path identification from an attacker’s perspective differs from system administrator’s perspective in many ways like attacker needs a single best possible attack path to his goal while optimizing certain criteria whereas a typical
Manuscript received January 7, 2008. Mr. Somak Bhattacharya is presently pursuing MS in Information Technology from Indian Institute of Technology, Kharagpur. His main area of research includes network and system security. (e-mail: somakb@ sit.iitkgp.ernet.in).
Dr. S.K. Ghosh is presently working as Assistant Professor in the School of Information Technology, Indian Institute of Technology, Kharagpur, India. Prior to IIT Kharagpur, he worked for Indian Space Research Organization (ISRO), Department of Space, Government of India, for about eight years in the field of Satellite Remote Sensing and GIS. His research interest includes Information Security, Remote Sensing & GIS, and Image Processing. (e-mail: [email protected]).
administrator needs to identify all possible avenues to the goal. Hence identification of an attack path indicates the path which will be followed by an assumed attacker with highest probability.
The proposed approach [1][2] converts existing attack graphs into a bayesian network using conditional probabilities among exploits. The approach also incorporates attacker’s profile into the model. The approach in [3][4][5] identifies the possible attack paths using attacker’s initial position, skill level etc. using the qualitative metrics proposed by Common Vulnerability Scoring System1 (CVSS) by National Vulnerability Database (NVD). Dacier et al. [6] [8] and Ortalo et al. [7] model system vulnerabilities through the concept of “privilege graphs”. They represent each node as a set of user privileges and edges (arcs) as vulnerabilities which can be used to escalate the user’s privilege. They present a probabilistic security metric mean time to failure (MTTF) that is based on assigning likelihoods to attacks. A behavior theoretic model [14] has been used to address the inherent scalability issues of attack graph generation by dynamically identify the likelihood of an exploit to be used by an attacker. Likelihood of a state will be reached by an attacker over an attack graph is being determined with the application of page rank algorithm in [15]. A new metric attack resistance is being proposed [16][18] for assessing and comparing the security of different network configurations. The metric is developed depending upon MTTF metric proposed in [6]. The proposed approach [17] measures the security strength of a network in terms of the strength of the weakest adversary who can successfully penetrate the network.
Most of these previous approaches [6][7][8][16][18] works around the metric MTTF, proposed by the dacier et. al.[6]. The proposed approach in [1][2] also use a profile based search over an attack graph using conditional occurrence probabilities (Probability that exploit A being followed by exploit B) among exploits. The MTTF approach requires a large amount of historical data to analyze the time and effort required for each individual exploit to be successfully executed. The proposed approach in [6] suggests that these data can be collected from the network and host based intrusion detection system (NIDS and HIDS) [6] over a period of time. However such historical data are not available for exploit have a stealth version and can evade intrusion detection system (IDS) and zero-day exploits. The zero-day exploit is a special kind of exploit for which the
1
http://nvd.nist.gov/cvss.cfm
A Decision Model based Security Risk
Management Approach
functional exploit code is not publicly available, however the data related to the vulnerability and its consequences may be exposed by the individuals. Hence in our proposed approach we have identified the basic criteria and sub-criteria which may guide a perspective attacker’s exploit selection methodology. The proposed approach does not require any historical data like MTTF [6][7][8] or assumed occurrence probability [1][2] among exploits rather it uses multi criteria decision making model to compute such probabilities for individual exploit quantitatively from publicly available data sources, eradicating the necessity of scanning over the intrusion detection system logs in order to identify individual exploit behavior.
The rest of the report is organized as follows. Section II describes the overview of risk prioritization using threat model, Section III presents a case study to demonstrate the concept of risk prioritization and finally we conclude in section IV.
II.RISK PRIORITIZATION USING THREAT MODEL The previous attack graph generation algorithms [10][12][13] identifies all possible paths to the critical network assets. However for large organizational network, such exhaustive identification of graph will be quite complex to interpret and comprehend visually. Hence the risk management procedure will also be complicated. An alternative approach to alleviate such problem is to view the network form an attacker’s point of view rather than a system administrator’s perspective. The change of perspective will enforce the administrator to identify a single exploit at a given network state (like user privilege on an ftp server) that a potential attacker might chose while optimizing multiple criteria. Therefore the risk prioritization approach requires modeling of threat under the assumed attacker’s capability. This approach further leads to a multi criteria decision making methods (MCDM) problem which generates an attack trace in a form of exploit sequence that a potential attacker may follow. The risk prioritization using threat modeling consists of two phases
• Modeling of attacker’s profile
• Identification and modeling of optimization criteria A.Modeling of Attacker’s Profile
While going through several research articles [2][5][6][14][17][19][20] it has been found that malicious attacker’s can be broadly categorized into several different profiles like experienced attackers, opportunist hackers, organization insiders, script kiddies etc. The experienced attackers are one who belongs to the government and military agencies; on the other hand the script kiddies are one whose capabilities based on the publicly available exploit techniques. Though theoretically and practically, the previous approaches argued that it is impossible to exactly characterize attacker’s behavior and predict about their possible move, certain baseline characteristics help to differentiate them from each other. For example experienced attacker’s activities are more goals oriented and stealthy. These attackers belong to a skilled community who can
develop their own exploit and equipped with sophisticated and costly tools like password crackers, with high computational power. On the contrary, the script kiddies gather their tools from publicly available sources2
and their activity is mostly related to exploring the victim network. The script kiddies are also very reluctant about their identity exposure. The model explicitly assumes that a given attacker belongs to an experienced attacker community who will try to maximize his success risk and minimize detection risk to reach the goal. It also assumes that the attacker has a memory and he can remember what all state has already been visited and hence he should not try to achieve any privilege which has already been obtained.
B.Identification and Modeling of Optimization Criteria The proposed approach has used multi criteria decision making method Technique for Order Preference by Similarity to Ideal Solution (TOPSIS) [11] to identify and model optimization criteria. The TOPSIS method integrates the publicly available data sources and only able to deal with numeric quantities. Till date there is no unique scoring framework is available to compare between the exploits. However there exist several vulnerability scoring frameworks both commercial and non-commercial like Microsoft Threat Scoring Syste3, SANS Critical Vulnerability Analysis Scale Rating4
, Common Vulnerability Scoring System (CVSS) by National Vulnerability Database (NVD). These scoring frameworks rate the vulnerability or threats into different scales and values. Furthermore they have also not disclosed how they have converted different expert’s subjective belief into quantitative values. TOPSIS method helps to incorporate such publicly available quantitative data (where the values are set by their own experts) in order to calculate the individual exploit’s weight to identify their selection preference by an assumed attacker. The attacker’s view towards the victim network has been broadly categorized by [9] as:
• What is my objective?
• What vulnerabilities exist in the target system? • What damage or other consequences are likely? • What exploit scripts or other attack tools are available? • What is my risk of exposure?
[image:2.612.306.585.544.624.2]
Figure 1. Decision hierarchy of criteria and sub-criteria
Based upon the categorization, the proposed model has further extended the concept [1][9][14][19][20]and builds a decision hierarchy as shown in figure 1. A possible set of quantitative values for each of the criteria and sub-criteria can be obtained from National Vulnerability Database
2
http://www.milw0rm.com/
3
http://www.microsoft.com/technet/security/alerts/matrix.mspx
4
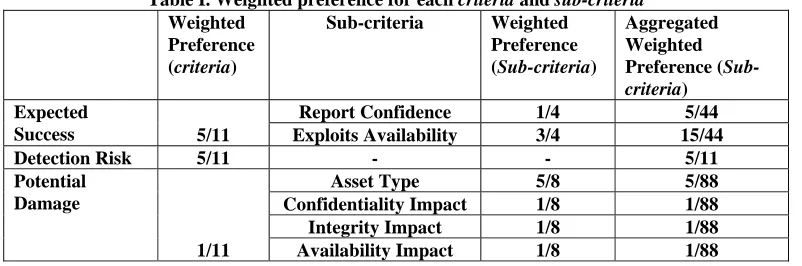
(NVD). For example, confidentiality impact can be full (1.0), partial (0.7) or none (0.0) within a scale of 0-1. The proposed approach uses directly the numerical values provided by NVD. Depending upon the attacker’s profile and system administrator’s subjective belief, each criteria and sub-criteria has been assigned their relative importance in the overall decision making in table I. A pair wise comparison matrix based approach [11] is being used to identify the importance of each criteria and sub-criteria in making final decision. The comparison based approach converts the subjective belief of administrators in 1-9 scale. For example, it has been assumed that an experienced attacker will give more preference to expected success and risk of detection of
[image:3.612.108.509.204.337.2]the chosen exploit over its potential damage capability. The final approach is to compute preference of each alternative against all the criteria and sub-criteria and computes the overall impact of each alternative in making the final decision. For example analysis of table I identifies that 45% (5/11) of an attacker’s objective weight is on expected success, 45% (5/11) on detection risk and only 10% (1/11) on potential damage. Furthermore the weighted preference for expected success is 5/11 and sub-criteria under it report confidence and exploit availability has a weighted preference is 1/4 and 3/4 respectively. Hence the combined weighted preference for report confidence and exploit availability is 5/44 and 15/44.
Table I. Weighted preference for each criteria and sub-criteria Weighted
Preference (criteria)
Sub-criteria Weighted Preference (Sub-criteria)
Aggregated Weighted Preference (Sub-
criteria)
Expected
Success 5/11
Report Confidence 1/4 5/44
Exploits Availability 3/4 15/44
Detection Risk 5/11 - - 5/11
Potential Damage
1/11
Asset Type 5/8 5/88
Confidentiality Impact 1/8 1/88
Integrity Impact 1/8 1/88
Availability Impact 1/8 1/88
Hwang and Yoon [11] developed the TOPSIS technique based on the concept that “the chosen alternative should have the shortest distance from the positive–ideal solution and the longest distance from the negative-ideal solution”. The ideal solution is the collection of ideal scores (or ratings) in all criteria considered. The TOPSIS technique defines a “similarity index” (or relative closeness) by combining the proximity to the positive-ideal solution and the remoteness of the negative-ideal solution. Several steps are needed in order to implement the technique:
Step 1: Calculate Normalized Scores
Vector normalization method is used to calculate the normalized scores as:
2
1 n
ij j
ij ij
x
x
r
=
=
∑
(1)
Where j is the index related to the alternatives, and i to the criteria.
Step 2: Calculate Weighted Normalized Ratings
The weighted normalized value is calculated as:
ij ij ij
v
=
w r
i (2) where wi is the weight of the ith criteria.Step 3: Identify Positive-Ideal and Negative-Ideal Solutions
The positive-ideal solution is the composite of all best criteria ratings attainable, and is denoted:
* * * * *
1 2
{ ,
...,
i,... }
nA
=
v v
v
v
wherev
1*is the best value for the ith criteria among all alternatives.The negative-ideal solution is the composite of all worst criteria ratings attainable, and is denoted:
1 2
{ ,
...,
i,... }
nA
−=
v v
− −v
−v
−where
v
1−is the worst value for the ith criteria among all alternatives.Step 4: Calculate Separation Measures
The separation or distance of each alternative from the positive-ideal solution A*, is given by the n-dimensional Euclidean distance:
* * 2
1
(
)
n
j ij i
S
=
∑
v
−
v
(3) where j is the index related to the alternatives, and i to the criteria. Similarly, the separation from the negative-ideal solutionA
− is given by:* 2
1
(
)
n
j ij i
S
−=
∑
v
−
v
(4)
Step 5: Calculate Similarity Indexes
The Similarity to positive-ideal solution, for alternative j, is finally given by:
*
* j j
j j
s
C
s
s
−−
=
+
where*
0
≤
c
j≤
1
(5)The alternatives can then be ranked according to
C
*j in descending order.III. CASESTUDY
A.Description of Test Network
The example network is shown in figure 2. There are two hosts on the internal network, Host1 and Host2, and the firewall separating the internal network from external
[image:4.612.64.285.266.406.2]network. The attacker's host is Host0 on the external network. The host configuration on the internal network is shown in table II.
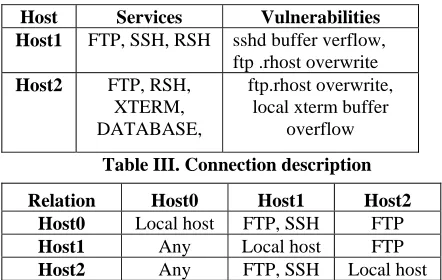
Figure 2. Network diagram for case study Table II. Host configuration
Table III. Connection description
The firewall allows the inbound ftp and the ssh packets to communicate with the Host1 and Host2, but interdicts other packets. In the internal network, connection relation won't be controlled by firewall, so it can be assumed that the internal host can make connection with any remote server. The connection relation among each host is described in table III.
B.Application of TOPSIS for Risk Prioritization using Threat Modeling
The possible quantitative values for each of the criteria and sub-criteria have been obtained from Common Vulnerability Scoring System (CVSS) by National Vulnerability Database (NVD) in a range of 0-1. Each of these sub-criteria are considered as positive criteria which
essentially indicates that higher the value (close to 1) is more preferable to the attacker. In table IV we have shown the scores obtained against each exploit. The implicit assumption is that the attacker in a position where he identifies all the precondition and vulnerabilities for each of the exploit to be executed. Hence the report confidence has been set to confirmed (1.00). To exploit ftp_rhost vulnerability, no code is required whereas for sshd_buf(0,1) exploit, functional code (written in some computer language) is required. In optimum, the sshd_buf(0,1) has an stealth version whereas exploit ftp_rhost(0,1) and ftp_rhost(0,2) are always detectable [12]. Though ftp_rhosts(0,2) and ftp_rhsots(0,1) are belong to the same exploit, due to their different instantiation with victim host, they have been considered as two different exploits. Exploit ftp_rhost(0,2) obtains privilege on the goal host which is also organizational database server compare to the other exploits which can gain privilege on a ftp and ssh server with relatively low priority. The confidentially, integrity and availability is used to represent the basic building block of security. Exploit sshd_buf(0,1) while gives a root privilege with confidentiality, integrity and availability of the victim system is completely compromised, the other exploit gives only user level trust between source and victim machine.
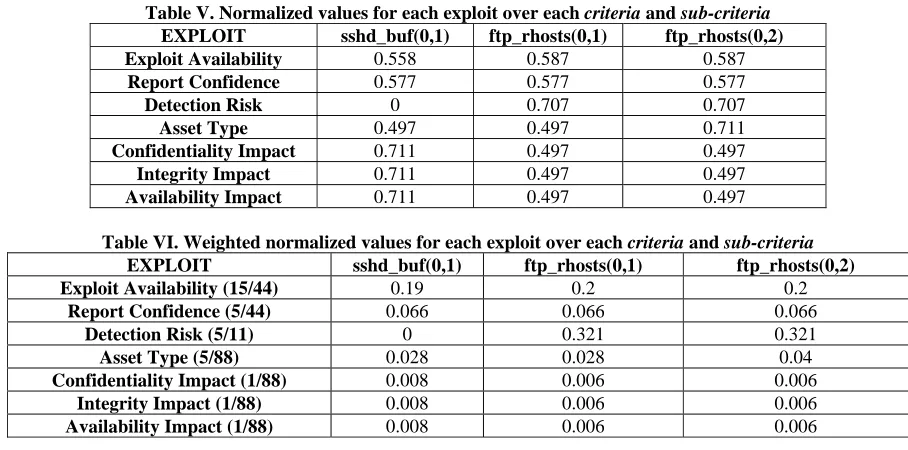
The normalized score (eq. 1) for each exploit (step 1 of TOPSIS method) has been shown below in table V.
Table IV. Individual criteria and sub-criteria values for each exploit
sshd_buf(0,1) ftp_rhosts(0,1) ftp_rhosts(0,2)
Exploit Availability 0.95 1 1
Report Confidence 1 1 1
Detection Risk 0 1 1
Asset Type 0.7 0.7 1
Confidentiality Impact 1 0.7 0.7
Integrity Impact 1 0.7 0.7
Availability Impact 1 0.7 0.7
Host Services Vulnerabilities
Host1 FTP, SSH, RSH sshd buffer verflow,
ftp .rhost overwrite
Host2 FTP, RSH,
XTERM, DATABASE,
ftp.rhost overwrite, local xterm buffer
overflow
Relation Host0 Host1 Host2
Host0 Local host FTP, SSH FTP
Host1 Any Local host FTP
Table V. Normalized values for each exploit over each criteria and sub-criteria
EXPLOIT sshd_buf(0,1) ftp_rhosts(0,1) ftp_rhosts(0,2)
Exploit Availability 0.558 0.587 0.587
Report Confidence 0.577 0.577 0.577
Detection Risk 0 0.707 0.707
Asset Type 0.497 0.497 0.711
Confidentiality Impact 0.711 0.497 0.497
Integrity Impact 0.711 0.497 0.497
Availability Impact 0.711 0.497 0.497
Table VI. Weighted normalized values for each exploit over each criteria and sub-criteria
EXPLOIT sshd_buf(0,1) ftp_rhosts(0,1) ftp_rhosts(0,2)
Exploit Availability (15/44) 0.19 0.2 0.2
Report Confidence (5/44) 0.066 0.066 0.066
Detection Risk (5/11) 0 0.321 0.321
Asset Type (5/88) 0.028 0.028 0.04
Confidentiality Impact (1/88) 0.008 0.006 0.006
Integrity Impact (1/88) 0.008 0.006 0.006
Availability Impact (1/88) 0.008 0.006 0.006
The weighted normalized values (eq. 2) for each of the exploit (step 2 of TOPSIS method) are shown in table VI. The weighted normalized values for each exploit are the multiplication of normalized score of that exploit over those particular criteria or sub-criteria and its influence (weight) in making the final decision. The weighted preference value for each of the sub-criteria is obtained
[image:5.612.123.494.356.544.2]from table I. The table VII (Step 3 of TOPSIS method) identifies the attainable positive ideal and negative ideal values over each criteria and sub-criteria against each exploit. The separation of each exploit from positive and negative ideal solution is being calculated (eq. 3 & 4) and shown in table VIII (Step 4 of TOPSIS method).
Table VII. Positive and negative ideal values for each exploit over every criteria and sub-criteria
EXPLOIT A* A
-Exploit Availability 1.00 0.95
Report Confidence 1.00 1.00
Detection Risk 1.00 0.00
Asset Type 1.00 0.70
Confidentiality Impact 1.00 0.70
Integrity Impact 1.00 0.70
Availability Impact 1.00 0.70
Table VIII. Separation measurement for eachexploit
EXPLOIT sshd_buf(0,1) ftp_rhosts(0,
1)
ftp_rhosts(0,2 )
* j
S
2.535 2.425 2.421j
S
−1.827 1.853 1.849 The similarity to positive ideal solution for each of the
exploit (eq. 5) is shown in table IX (Step 5 of TOPSIS method). Once the values are being calculated, the exploits are then ranked according to similarity index in descending order. In this case, exploit ftp_rhosts(0,1) are little being prioritized over other two exploit as it’s value is little high compare to other two. So a good choice for an attacker to select is ftp_rhosts(0,1) exploit.
Table IX. Similarity index for each exploit
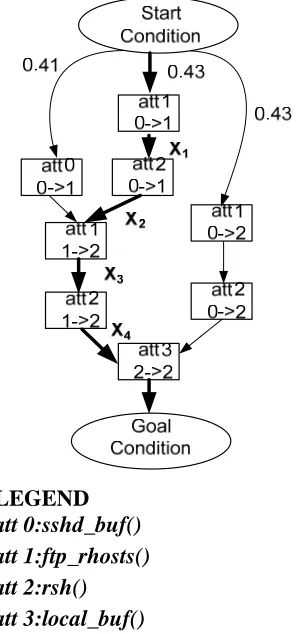
Based on these similarity index, the attacker have chosen exploit ftp_rhosts (0, 1) to be launched as shown in figure 3 with black bold line. In the next iteration, the possible alternatives or exploits for the attacker is, ftp_rhosts(0,2),
sshd_buf(0,1), rsh(0,1). This iteration will be stopped once the attacker reaches the goal. For example, a possible successful exploit execution trace for the attacker is shown in figure 3 using the black bold line. The bold lines in figure 3 also contain a label alongside to represent the probability of an exploit be selected by the attacker as X1%, X2% etc. The attack trace shown in figure 3, contains an attack path as att1(0,1)→att2(0,1)→att1(1,2)
→att2(1,2)→att3(2,2) or {ftp_rhosts(0,1)}→{rsh(0,1)}→
ftp_rhosts(1,2)}→{rsh(1,2)}→{local_buf(2,2)}. Hence by rule of conditional probability, the probability of following that path by an experienced attacker can be calculated as {0.43*X1*X2 * X3* X4}.
EXPLOIT sshd_buf (0,1)
ftp_rhosts(0, 1)
ftp_rhosts( 0,2)
* j
IV. CONCLUSION
To deal with the risk mitigation procedure for large organizational network, the paper proposes a decision making model based on threat identification approach. Like previous approaches, the approach has not tried to identify all possible attack paths to the critical resource rather prioritize and quantify them based on certain criteria from an attacker’s perspective. This prioritization of attack paths help the security administrators in risk mitigation procedure by identifying the most critical and probable path in the network. The model can also be further extended to identify critical attack paths for the same network under different attacker’s profile.
REFERENCES
[1] R. Dantu, K. Loper, and P. Kolan, “Risk Management using Behavior based Attack Graphs”, In Proceeding of the Information Technology: Coding and Computing (ITCC ‘04), IEEE Computer Society, Las Vegas, Nevada, USA, April 5-7, 2004, 445-449. [2] R. Dantu, P. Kolan, R. Akl, and K. Loper, “Classification of
Attributes and Behavior in Risk Management Using Bayesian Networks”, In Proceeding of the IEEE International Conference on Intelligence and Security Informatics (ISI ‘07), IEEE Computer Society, New Brunswick, NJ, USA, May 23-24, 2007, 71-74. [3] I. Kotenko, M. Stepashkin, “Analyzing Network Security using
Malefactor Action Graphs”, International Journal of Computer Science and Network Security, Vol. 6, No. 6, June 2006, 226-235. [4] I. V. Kotenko, M. Stepashkin, “Network Security Evaluation Based
on Simulation of Malfactor's Behavior”, In Proceeding of the International Conference on Security and Cryptography (SECRYPT), Porto, Portugal, July 26-29, 2006, 339-344.
[5] I. V. Kotenko, M. Stepashkin, “Attack Graph Based Evaluation of Network Security”, In Proceeding of the Communications and
Multimedia Security, Heraklion, Crete, October 19-21, 2006, 216-227.
[6] M. Dacier, Y. Deswarte, and M. Kaâniche, “Quantitative Assessment of Operational Security:Models and Tools”, Technical Report, LAAS Report 96493, May 1996. Available: http://citeseer.ist.psu.edu/366225.html.
[7] R. Ortalo, “Quantitative Evaluation of Information Systems Security”, doctoral thesis (in French), Institut National Polytechnique de Toulouse, no. 1418, LAAS Report 98164, May 1998.
[8] R. Ortalo, Y. Deswarte, and M. Kaâniche, “Experimenting with Quantitative Evaluation Tools for Monitoring Operational Security,” Proc. Dependable Computing for Critical Applications 6 (DCCA'6), M. Dal Cin, C. Meadows, and W.H. Sanders, eds., Grainau, Germany, Mar. 1997.
[9] J. Undercoffer, J. Pinkston, “Modeling Computer Attacks: A Target-Centric Ontology for Intrusion Detection”, In Proceeding of the 18th
International Joint Conference on Artificial Intelligence, July 31, 2003.
[10] P. Ammann, D. Wijesekera, and S. Kaushik, “Scalable, graph-based network vulnerability analysis”, In Proceeding of the 9th ACM Conference on Computer and Communications Security (CCS) (Washington, USA, November 18-22, 2002). ACM Press, New York, NY, 2002, 217-224.
[11] Felix Naumann, “4 Quality Ranking Methods” In Quality-Driven Query Answering for Integrated Information Systems, vol. 2261/2002, Ed. Berlin / Heidelberg: Springer, 2004, pp. 261-267. [12] O. Sheyner, J. Haines, S. Jha, R. Lippmann, and J. M. Wing,
“Automated generation and analysis of attack graphs”, In Proceeding of the IEEE Symposium on Security and Privacy, IEEE Computer Society, Washington, DC, USA, May 12-15, 2002, 273–284.
[13] S. Jha, O. Sheyner, and J. Wing, “Two Formal Analyses of Attack Graphs”, In Proceeding of the 15th
IEEE Computer Security Foundations Workshop (CSFW ’02), IEEE Computer Society, Nova Scotia, Canada, June 24-26, 2002, 49-63.
[14] K. Clark, C. Lee, S. Tyree, and J. Hale, “Guiding Threat Analysis with Threat Source Models”, In Proceeding of the 8th
Annual IEEE SMC Information Assurance Workshop (IAW 2007), United States Military Academy, West Point, New York, June 20-22, 2007, 262-269.
[15] V. Mehta, C. Bartzis, H. Zhu, E. M. Clarke and J. Wing, “Ranking Attack Graphs”, In Proceeding of the 9th
International Symposium On Recent Advances In Intrusion Detection, Hamburg, Germany, September 2006, 127-144.
[16] L. Wang, A. Singhal, S. Jajodia, "Measuring the overall security of network configurations using attack graphs", In Proceeding of the 21st
Annual IFIP WG 11.3 Working Conference on Data and Applications Security, Springer Lecture Notes in Computer Science, Vol. 4602, Steve Barker and Gail-Joon Ahn, eds., Redondo Beach, CA, July 8-11, 2007, 98-112.
[17] J. Pamula, P. Ammann, S. Jajodia, Vipin Swarup, "A weakest-adversary security metric for network configuration security analysis," In Proceeding of the 2nd
ACM Workshop on Quality of Protection, Alexandria, VA, October 30, 2006, 31-37. [18] L. Wang, A. Singhal, S. Jajodia, “Toward Measuring Network
Security Using Attack Graphs”, In Proceeding of the ACM workshop on Quality of protection (Computer and Communication Security), Alexandria, Virginia, USA, October 29, 2007, 49-54. [19] D. Heinbuch, E. Kyle, and J. Piorkowski, “Risk-based systems
security engineering: stopping attacks with intention”, Security & Privacy Magazine, IEEE, Nov.-Dec. 2004, Volume: 2, Issue: 6, 59- 62.
[20] G. Stoneburner, A. Goguen, A. Feringa, “Risk Management Guide for Information Technology Systems”, Technical Report, SP 800-30, July 2002. Available: http://csrc.nist.gov/publications/nistpubs/800-30/sp800-30.pdf.