Distributional vectors encode referential attributes
Abhijeet Gupta∗ Gemma Boleda† Marco Baroni† Sebastian Pad´o∗ ∗Institut f¨ur Maschinelle Sprachverarbeitung
Universit¨at Stuttgart †Center for Mind/Brain Sciences
University of Trento
Abstract
Distributional methods have proven to ex-cel at capturing fuzzy, graded aspects of meaning (Italy is more similar to Spain
than toGermany). In contrast, it is diffi-cult to extract the values of more specific attributes of word referents from distribu-tional representations, attributes of the kind typically found in structured knowledge bases (Italyhas60 millioninhabitants). In this paper, we pursue the hypothesis that distributional vectors also implicitly en-code referential attributes.
We show that a standard supervised regres-sion model is in fact sufficient to retrieve such attributes to a reasonable degree of ac-curacy: When evaluated on the prediction of both categorical and numeric attributes of countries and cities, the model consis-tently reduces baseline error by 30%, and is not far from the upper bound. Further anal-ysis suggests that our model is able to “ob-jectify” distributional representations for entities, anchoring them more firmly in the external world in measurable ways.
1 Introduction
Distributional models induce vector-based seman-tic representations of words from their contextual distributions in corpora, exploiting the observation that words with related meanings tend to occur in similar linguistic contexts (Turney and Pantel, 2010; Erk, 2012). Since the approach only requires raw text as input, it can be used to harvest word representations on a very large scale. By encoding the rich knowledge that is present in text, these representations are able to capture many aspects of word meaning. Moreover, approximating se-mantic similarity by graded geometric distance in a vector space is an effective strategy to address the
many linguistic phenomena that are better charac-terized in gradient rather than discrete terms, such as synonymy, selectional preferences, and semantic priming (Baroni and Lenci, 2010; Erk et al., 2010; Pad´o and Lapata, 2007, among others).
However, not all aspects of human semantic knowledge are satisfactorily captured in terms of fuzzy relations and graded similarity. In particular, our knowledge of the meaning of words denoting specific entities involves a number of “hard facts” about the referents they denote that are best for-malized as attribute-value pairs, of the sort that are stored in manually-curated knowledge bases, such as FreeBase or Wikidata.1 While distributional vec-tors can capture the useful fact that, say,Italyis in many ways more similar toSpainthan toGermany, as humans we also know (or we can easily look up) a set of objective facts about Italy, such as what is its capital, its area, its official language and GDP, that are difficult to express in the language of vector algebra and geometry.
In this paper, we explore the hypothesis that dis-tributional vectors implicitly encode such attributes of referential entities, which we will callreferential attributes. We show that a simple supervised algo-rithm applied to vectors can retrieve them so that they can be expressed in the explicit language of structured knowledge bases. Concretely, we train a logistic regression model to predict the values of both numeric and categorical FreeBase attributes of countries and cities from their distributional vec-tors. This model makes predictions that are signifi-cantly better than an informed baseline, in-between the latter and an upper-bound method. Qualitative analysis of the results points both to the inherent difficulty of correctly retrieving certain classes of attributes, and to some intriguing properties of the conceptual nature of the knowledge encoded in dis-tributional data, that bias their predictions about certain objective attributes of geographic entities.
1www.freebase.com,www.wikidata.org.
We see our experiment as a first step towards integrating conceptual and referential aspects of meaning in distributional semantics, as we further discuss in the conclusion.
2 Method
2.1 Distributional Representations
Mikolov et al.’s (2013) skip-gram model is a state-of-the-art “predictive” distributional seman-tic model which represents each word in a space of latent dimensions optimized to predict the con-texts of the word’s occurrences. For our study, we adopt the pre-trained 1,000-dimensional skip-gram model for Named Entities that is available at https://code.google.com/p/word2vec/
and was produced from a 100-billion token news corpus. We refer to this model as WORD2VEC. 2.2 Referential Representations
As our source of referential attributes, we use Free-Base (see footnote 1), a knowledge base of struc-tured information on a wide range of entities of different semantic types (people, geographical enti-ties, etc.). The information in FreeBase comes from various sources, including Wikipedia and domain-specific databases, plus user content generation and correction. FreeBase currently records at least 2 attributes for over 47 million entities, and it has been used fairly extensively in NLP before (Mintz et al., 2009; Socher et al., 2013a, among others).
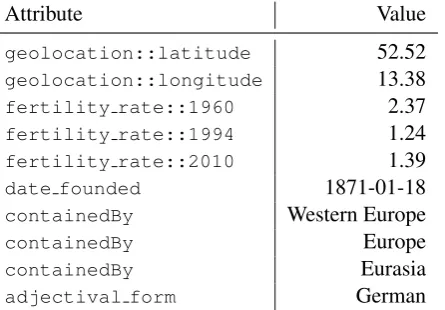
For eachentity, FreeBase contains a list of at-tribute-valuetuples (where values can in turn be entities, allowing a graph view of the data that we do not exploit here). Table 1 shows a sample of the attributes that FreeBase records for coun-tries. Note that some attributes are simple (e.g.,
date founded), while other can be called com-plex, in the sense that they are attributes of at-tributes (e.g., geolocation::latitude). We use a double-colon notation to refer to complex attributes. The values of all attributes can be either numeric or categorical. The numeric attributes in particular are often strongly correlated, both within attributes types across years (e.g., fertility rate in different years) and across attributes within years (e.g., absolute GDP and GDP per capita in a given year).
We built two datasets for our experiments, one for countries and one for cities, with data automati-cally extracted from FreeBase.2 We consider two
2Both datasets are publicly available at http:
Attribute Value
geolocation::latitude 52.52
geolocation::longitude 13.38
fertility rate::1960 2.37
fertility rate::1994 1.24
fertility rate::2010 1.39
date founded 1871-01-18
containedBy Western Europe
containedBy Europe
containedBy Eurasia
[image:2.595.311.534.62.217.2]adjectival form German
Table 1: Sample of numeric and binary FreeBase attributes forGermany.
datasets in order to check that the mapping we seek can be established not just for one, possible hand-picked, type of entities; we leave it to future work to study very different kinds of entities, such as people or institutions.
The Countries dataset consists of the 260 countries for which we have a distributional vector. Some countries do not exist anymore, like Yugoslavia, but, since this does not impact our method, we keep them in the dataset. The dataset records all simple attributes as well as complex attributes of at most two hops in the FreeBase graph, without manual inspection. We linearly rescale all numeric attributes to [0..1] and translate all categorical attributes into a binary representation by suffixing the original value to the original attribute name. For example, the attribute member-of::organization with the value world bank results in a binary attribute
member-of::organization::world bank
having value 1 for all and only those countries that are members of the World Bank, 0 for the others.3 Attributes that occur less than 15 times are discarded, since they are either not consistently recorded or rare. This results in a total of 707 numeric and 247 binary attributes. Finally, we partition the data into training, validation, and test set, using a 60-20-20 percent split.
We apply the same process to theCitiesdataset, which consists of 1645 cities from the intersection of the distributional and FreeBase city lists. In
//www.ims.uni-stuttgart.de/forschung/
ressourcen/korpora/CityCountry.html.
this case, we have 211 numeric and 106 binary attributes – the numbers are smaller because coun-tries have a richer representation in FreeBase than cities.
2.3 Attribute Prediction
We do zero-shot learning of full FreeBase attribute-based country/city representations, attribute-based on distri-butional (WORD2VEC) representations. It is
zero-shot learning in the sense of Palatucci et al. (2009): We split the datasets at the entity, rather than at-tribute level, such that at test time our system must predict the full attribute set of countries and cities that were not seen during training at all.
We use logistic regression. In effect, we predict each output variable (FreeBase attribute) with an in-dependent logistic regression model based on a con-stant set of input features (WORD2VEC
distribu-tional dimensions). We call this model DIST2REF.
DIST2REF doesnot take advantage of the
corre-lations between the output attributes mentioned in Section 2.2.
The dependent variables are binary as well as nu-meric FreeBase attributes, and our model does not distinguish between them. For binary attributes, we interpret the value returned by the model as the probability of “success” of a binary Bernoulli trial. In the numeric case, we view the probabil-ity returned by the model as directly representing normalized attribute values.
2.4 Experimental Setup
We design the model using the Countries dataset, and apply it to Cities without further tuning to test its robustness. We optimize the parameters with gradient descent, using the Cross Entropy error function. We considered L2 regularization to ad-dress possible overfitting, but experiments on val-idation set showed that the model performs best without any regularization.
As for baselines, for binary features we predict the majority class (0 or 1), and for numeric features we predict the mean value of the feature in the training set. These are of course strong baselines to beat.
As an upper bound, we train a model that uses the same architecture as described above but uses as input not distributional vectors but the FreeBase attributes themselves. In other words, this model has to learn “only” an identity mapping. This is not trivial, though, for example due to the presence of strong correlations among attributes, in particular
the time series attributes (cf. Section 2.2). We call this model REF2REF.
2.5 Evaluation
Since there is no appropriate unified evaluation measure that covers both numeric and binary at-tributes, we evaluate them separately. For binary attributes, we report the attributes’ mean accuracy. For numeric attributes, we consider attribute prediction a ranking task. As an example, take thepopulation::2011::numberattribute, and imagine that we only have three countries (Ger-many: 80M; Spain: 36M; and Netherlands: 17M). If we predict 56M for Spain’s population, it is still (correctly) predicted as the second most populous country (rank difference of 0); a prediction of 16M, however, would push Spain to third place (rank difference of 1).
This suggests the use of rank correlation coef-ficients like Spearman’sρ. However, we want to measure not only how well the model can rank the countries in the test set, but also whether these pre-dictions are consistent with the training set (which makes evaluation both more challenging and more realistic). One way of achieving this goal would be to useρon the union of training and test instances, but this could lead to misleadingly high correlation coefficients since this method would include the labels of the training instances in the evaluation.
Consequently, we define our own evaluation measure, following a rationale similar to Frome et al.’s (2013) evaluation of a zero-shot learning sce-nario. What we evaluate, for each attribute, is the rank of the test countries in the whole country list. Note that this makes our task harder, as there are more confounders: If we only evaluated on the test set, there would be shorter lists and therefore less chances of getting bad rankings. So, concretely, we first define the prediction quality of each attribute,
Q(a), as the median of the rank difference between the prediction and the gold standard in a list that includes both training and test countries (we use the median to give less weight to outlier countries). We also normalize the rank difference to obtain a number between zero and one. In a second step, we define the quality of the complete model, the
normalized rank score (NRS), as the mean of all attribute quality scores, in parallel to our evaluation on binary attributes.
Attribute Type Model Countries Cities
Binary (Acc) Most Frequent Class BaselineDIST2REF 0.860.90 0.970.99
REF2REF(upper bound) 0.96 1.00
Numeric (NRS) Mean Value BaselineDIST2REF 0.350.22 0.350.25
[image:4.595.144.457.61.169.2]REF2REF(upper bound) 0.14 0.21
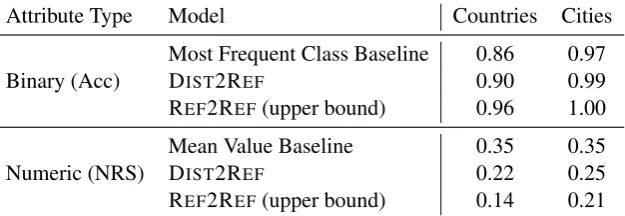
Table 2: Results for predicting FreeBase attributes from distributional vectors on the test sets. Both evaluation measures range between 0 and 1. For accuracy, 1 is best. For normalized rank score (NRS), 0 is best. All pairwise differences between models are significant (p<0.001, bootstrap resampling).
denote an attribute. We write pa(i) for the
pre-dicted value of attributeafor instanceiandga(i)
for the gold standard value. Finally, letr(v, S) de-note the rank of valuevin the list resulting when ordering the setS. Now we can define:
Q(a) = 1
||I||med{|r(pa(i), I) − (1)
r(ga(i), I)| −1|i∈T s} NRS= ||A1||X
a∈A
Q(a) (2)
This measure can be interpreted similarly to Mean Reciprocal Rank (Manning et al., 2008): It has range [0..1], with smaller numbers indicating better ranking: 0.1, for example, means that, on average, the prediction is 10% of the ranks off (e.g., by four countries in a forty-country list).4
Note that, when evaluating each instancei, we use gold-standard values for all other instances, so that there the baseline is not hampered by ties.
3 Results
Table 2 shows the results of our experiments on the two test sets. For accuracy 1 is best, but for NRS 0 is best. Recall from Section 2.2 that we perform model selection on the Countries dataset only.
The baseline is relatively high, in particular for the binary attributes, many of which are positive for a small subset of entities only. The amount of skew differs considerably between the two datasets, though. For Countries, the baseline yields an ac-curacy of 0.86, but it achieves 0.97 on Cities. The increase stems from very sparse categorical City features such ascontainedBy, which includes all
4Subtracting 1 in Equation (1) ensures that, when the pre-dicted and gold value of an attribute are adjacent in the rank-ing, their rank difference is 0, capturing the intuition of rank difference as counting the number of falsely intervening items.
levels of administrative divisions – that is, for the US, all counties appear as values and are trans-formed into sparse binary features (cf. Section 2.2). Of course, the predictions of the baseline are use-less, since it always predicts the absence of any features. On numeric features, where the baseline predicts the mean, its performance is 0.35 NRS on both datasets. In other words, its average prediction is off by about one third the length of the ranked list for each attribute.
Recall that the upper bound model, REF2REF,
uses FreeBase attributes to predict FreeBase at-tributes. All it has to learn is that there is one feature in the input that corresponds ideally to the output. This works almost perfectly for binary at-tributes, with accuracy values of 0.96 (Countries) and 1.00 (Cities). However, its performance on numeric features (with NRS at 0.14 and 0.21, re-spectively) is not quite perfect. We attribute this to the presence of correlations (cf. Section 2.2).
The model whose performance we are actually interested in, DIST2REF, in which we map from
distributional information to FreeBase features, per-forms with remarkable consistency between these two extremes. In fact, we see a consistent error reduction of around 30% over the baseline, with a similar distance to the upper bound. A signifi-cance test with bootstrap resampling (Efron and Tibshirani, 1994) showed that all pairwise com-parisons (Baseline vs. DIST2REF, DIST2REFvs.
REF2REF) are statistically significant at p<0.001.
To rule out that we misinterpret our accuracy-based evaluation for the binary features in the face of a highly skewed class distribution, we also computed precision, recall, and F-Score values. The relative patterns match those of the accuracy-based evaluation well (Countries: baseline F=0.13, DIST2REFF=0.51, REF2REFF=0.77) and indicate
We think that these are overall promising results, given that the FreeBase attributes we predict are fairly fine-grained, and we only use generic distri-butional information as input.
4 Analysis
We take the overall results just presented to suggest that we are able to learn referential attributes from distributional information to a large extent. In this section we take a closer look at what kind of in-formation we are able to learn, what is beyond the scope of our model, and what are the differences between the entity representations in WORD2VEC
and the ones our model produces. All the data concerns the test sets only.
4.1 Attribute Groups
We start with a qualitative analysis of the Countries dataset. Due to the large number of attributes, we sort all individual attributes intoattribute groups
by their base name (i.e. the leftmost component of their name, cf. Section 2.2), which offers an accessible level of granularity for inspection. We obtain 34 numeric and 40 binary attribute groups with median sizes of 8.5 and 2 attributes per group, respectively.
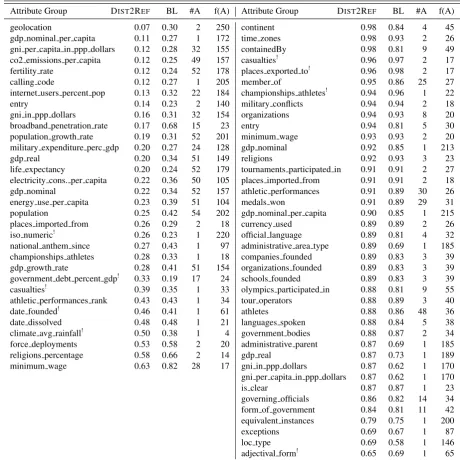
Table 3 shows the attribute groups for both types sorted by quality. For each group, we report av-erage normalized rank score (NRS) and accuracy, respectively, for both DIST2REFand the baseline.
The analysis suggests that there are two main factors that account for the results: (1) The degree to which an attribute iscontextually supported, that is, to what extent its values can be identified on the basis of the contextual information that is captured in a distributional model, and (2) general proper-ties of the data that affect Machine Learning, most notably data sparseness, possibly also feature value distributions.
Attributes that are contextually supported in-clude for instance those related to socioeconomic development (see below for details); people talk (and so write) about countries being more or less developed, rich, having one or another kind of laws, and this is captured in the abstractions over textual context that distributional models perform. As an extreme example of an attribute that isnot contex-tually supported, consider the numeric ISO code of a country (iso numeric), whose values are ar-bitrary: They do not correspond to facts about the world that are reflected in the way people use
lan-guage, and so can’t be picked up by the distribu-tional model. For this reason, DIST2REF does
worse than the baseline.
Note that, in a sufficiently large corpus, we might indeed encounter statements likeThe numeric ISO code for Spain is 724. However, since distributional models represent words asaggregateddistributions of their contexts, and compute semantic similarity from these context distributions, the contexts that they use need to be generic enough to yield mean-ingful overlap between concepts (e.g., words). As a result, distributional models cannot easily represent knowledge of the form “the value for property Y of word/concept X is Z”.
Fortunately, we find that many FreeBase at-tributes are contextually supported to a substantial degree, even some seemingly arbitrary ones. An ex-ample is calling codes, which we predict very well. They turn out to be correlated with geolocations: 2X calling codes are located in Africa, 3X call-ing codes in Southern and Eastern Europe and 4X calling codes in Western and Northern Europe (for comparison, ISO codes are assigned in a roughly alphabetical order).
Numeric Attributes. Our best numeric at-tributes belong to thegeolocation group (lati-tude and longi(lati-tude). We provide a more detailed analysis of these attributes below (Section 4.2). As mentioned above, we also excel at many attributes related to a country’s economic and social devel-opment (broadly construed), such as GNI, GDP, CO2 emissions, internet usage (each per capita), or fertility rate. These attributes can be expected to be contextually grounded – e.g., Luxembourg will occur with contexts like “broadband” or “rich” more than India.
Note, however, that the information contained in the vectors is surprisingly subtle: For instance, the fertility rate is a function of both general develop-ment status (lower rates in more developed coun-tries) and of specific social factors (higher rates in countries with more support for families, such as France and Finland compared countries with less support, such as Germany or Italy).
Numeric Attributes (Normalized Rank Score: lower is better) Attribute Group DIST2REF BL #A f(A)
geolocation! 0.07 0.30 2 250
gdp nominal per capita! 0.11 0.27 1 172
gni per capita in ppp dollars! 0.12 0.28 32 155
co2 emissions per capita! 0.12 0.25 49 157
fertility rate! 0.12 0.24 52 178
calling code! 0.12 0.27 1 205
internet users percent pop! 0.13 0.32 22 184
entry! 0.14 0.23 2 140
gni in ppp dollars! 0.16 0.31 32 154
broadband penetration rate! 0.17 0.68 15 23
population growth rate! 0.19 0.31 52 201
military expenditure perc gdp! 0.20 0.27 24 128
gdp real! 0.20 0.34 51 149
life expectancy! 0.20 0.24 52 179
electricity cons. per capita! 0.22 0.36 50 105
gdp nominal! 0.22 0.34 52 157
energy use per capita! 0.23 0.39 51 104
population! 0.25 0.42 54 202
places imported from! 0.26 0.29 2 18
iso numeric!! 0.26 0.23 1 220
national anthem since! 0.27 0.43 1 97
championships athletes! 0.28 0.33 1 18
gdp growth rate! 0.28 0.41 51 154
government debt percent gdp!! 0.33 0.19 17 24
casualties!! 0.39 0.35 1 33
athletic performances rank! 0.43 0.43 1 34
date founded!! 0.46 0.41 1 61
date dissolved! 0.48 0.48 1 21
climate avg rainfall!! 0.50 0.38 1 4
force deployments! 0.53 0.58 2 20
religions percentage! 0.58 0.66 2 14
minimum wage! 0.63 0.82 28 17
Binary Attributes (Accuracy: higher is better) Attribute Group DIST2REF BL #A f(A)
continent! 0.98 0.84 4 45
time zones! 0.98 0.93 2 26
containedBy! 0.98 0.81 9 49
casualties!! 0.96 0.97 2 17
places exported to!! 0.96 0.98 2 17
member of! 0.95 0.86 25 27
championships athletes!! 0.94 0.96 1 22
military conflicts! 0.94 0.94 2 18
organizations! 0.94 0.93 8 20
entry! 0.94 0.81 5 30
minimum wage! 0.93 0.93 2 20
gdp nominal! 0.92 0.85 1 213
religions! 0.92 0.93 3 23
tournaments participated in! 0.91 0.91 2 27
places imported from! 0.91 0.91 2 18
athletic performances! 0.91 0.89 30 26
medals won! 0.91 0.89 29 31
gdp nominal per capita! 0.90 0.85 1 215
currency used! 0.89 0.89 2 26
official language! 0.89 0.81 4 32
administrative area type! 0.89 0.69 1 185
companies founded! 0.89 0.83 3 39
organizations founded! 0.89 0.83 3 39
schools founded! 0.89 0.83 3 39
olympics participated in! 0.88 0.81 9 55
tour operators! 0.88 0.89 3 40
athletes! 0.88 0.86 48 36
languages spoken! 0.88 0.84 5 38
government bodies! 0.88 0.87 2 34
administrative parent! 0.87 0.69 1 185
gdp real! 0.87 0.73 1 189
gni in ppp dollars! 0.87 0.62 1 170
gni per capita in ppp dollars! 0.87 0.62 1 170
is clear! 0.87 0.87 1 23
governing officials! 0.86 0.82 14 34
form of government! 0.84 0.81 11 42
equivalent instances! 0.79 0.75 1 200
exceptions! 0.69 0.67 1 87
loc type! 0.69 0.58 1 146
[image:6.595.68.529.74.535.2]adjectival form!! 0.65 0.69 1 65
Table 3: Results for all attribute groups on the Countries test set, in descending order of performance. DIST2REF, BL: models;#A: number of attributes in group;f(A): median number of countries instantiating
each attribute in the dataset (260 countries);!: attribute group where model performs worse than baseline.
large countries, and for instance Luxembourg has a much smaller one, these numbers are not indica-tive of the actual conditions in these countries, and therefore also not so clearly correlated with what people write about them. This provides another interesting angle on the difference between distri-butional and formal knowledge representation. In a formal system, absolute GDP, relative GDP, and population stand in a fixed linear relationship and knowing any two of the three uniquely determines the third – thus, all three attributes have equal status. In our distributional space, their status is clearly
different, determined by the conceptual relevance of the different attributes.
Towards the end of the table, we find more attributes related to socioeconomic develop-ment, such as government percent debt and
total number of military casualties incurred in his-tory),date foundedanddate dissolved,5 or
climate avg rainfall.
Binary Attributes. The binary attributes show a similar picture, albeit somewhat less sharp. We again find contextually unsupported groups, many of them arising from our fully automatic attribute mining from FreeBase (cf. Section 2.2). There are many categorical attributes that store meta-data about numeric attributes (such as the cur-rency in the gdp and gni groups) as well as meta-information of FreeBase: exceptions is a specific marker of potentially inconsistent en-tries about Ghana, andequivalent instances
is a flag concerning links between FreeBase and OpenCyc. Fortunately, almost all contextually un-supported groups are small, with only one or two attributes, and do not have a large impact on the overall performance. We decided not to exclude them from evaluation for robustness’ sake, since there is no automatic way to identify contextually unsupported attributes in a new dataset.
We obtain good results on meaningful attributes that are arguably strongly contextually grounded, such as geographical and geopolitical attributes (member of: membership in international organi-zations; location on acontinent, etc.). However, we fare relatively badly on government-related attributes (form of government, governing offi-cials). While this seems surprising at first glance, the form of government attribute in FreeBase makes very fine-grained distinctions: Its values include “unitary state”, “presidential system”, “par-liamentary system” and “republic”, which are not mutually exclusive, and misses obvious alternatives like “authoritarian system”. It is not surprising that distributional models cannot make such sub-tle distinction between presidential and parliamen-tary systems. The attributegoverning official
presents a similar case. Other bad attributes are very domain-specific, includingathletes, encod-ing the athletic disciplines that countries participate in (such as swimming, judo, running, etc.), and the data sparsity issue is certainly worse for the binary attributes.
5Note that date-based attributes can be contextually sup-ported: We do better on national anthem since, for which we have more datapoints, 97.
Model Countries Cities WORD2VEC -0.36 -0.45
[image:7.595.335.499.62.107.2]DIST2REF 0.49 0.88
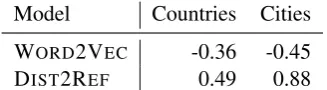
Table 4: Pearson correlation coefficients of model-predicted vs. ground truth distances between coun-tries and cities in the test sets. WORD2VEC
corre-lations are negative because we use cosines.
4.2 Geolocation
To analyze the difference between the distributional representations and the output of our model, we focus on geolocation, our best attribute group.
It has already been shown that geometric dis-tance in distributional space captures, to a cer-tain extent, physical distance between locations in the real world (Louwerse and Zwaan, 2009). Ta-ble 4 shows that DIST2REFextracts even more
pre-cise distance information from distributional vec-tors. The table reports the correlation between real and model-predicted distances for countries and cities. Ground-truthgreat circle distances(Kern and Bland, 1948) between items are computed us-ing the FreeBase longitude and latitude values; for DIST2REFwe use its predicted latitude and
longi-tude values; for WORD2VEC, the cosines between
the corresponding distributional vectors.
We obtain highly significant correlations in all cases (p<10−14), but much higher for DIST2REF. For countries, as shown in Table 4, the correlation is -0.36 for WORD2VEC(negative, because cosine
is asimilaritymeasure), 0.49 for DIST2REF. For
cities, WORD2VECreaches -0.45 correlation, and
DIST2REFdistances are at 0.88, showing that the
method can estimate city positions to a perhaps unexpectedly high degree of accuracy.6
This result suggests that we manage to objec-tify the information in the distributional model, anchoring the entities more firmly in the external world. Indeed, distributional models are known to be subject to conceptual or cultural effects in their distance estimations. For instance, in WORD2VEC
German and Spanish cities are much farther away than in the physical world, while cities within Spain and within Germany are predicted to be a bit closer than they actually are. Note that these effects have
an actual cognitive basis: Human intuitions about objective physical distance between countries and cities are biased by cognitive, cultural and socio-economic factors, as explored for example in Fried-man et al. (2002), who report that Texans locate Canadian cities closer to the US border relative to Mexican cities, despite their proximity to the latter, and that they place Southern US cities further south than they really are.
Interestingly, DIST2REF does also show some
cultural effects in its geolocation errors: For exam-ple, some Pacific island states with lesser-known identities (e.g., Nauru and French Polynesia) are placed in the Indian Ocean, where we find the per-haps prototypes of beautiful islands, like Seychelles and Mauritius; also, Central American countries (such as Panama, El Salvador, and Nicaragua) move towards their “cultural center of gravity”, South America.
However, this kind of cultural bias is much more prominent in the original WORD2VEC
distribu-tional representation. The Spain/Germany effect discussed above is not found in the DIST2REF
model at all. And while both DIST2REF and
WORD2VECplace Mexican and Spanish cities in
our test set closer to each other than they actually are, WORD2VECdoes so to a much larger extent.
In line with our goal to extract referential attributes, thus, we are satisfied to see that DIST2REF
man-ages to minimize this bias and distill the referential part from the distributional representations.
5 Related Work
There is a large literature on exploiting corpus ev-idence, sometimes through distributional seman-tic methods, in order to construct and populate structured knowledge bases (KBs) (e.g., Buitelaar and Cimiano (2008) and references therein). This line of work, however, does not attempt to con-nectentity representations extracted from corpora and from KBs, as we do. Moreover, it focuses on harvesting relations between entities or between entities and a limited number of discrete attributes, rather than predicting full-fledged KB representa-tions of specific entities, like we do. Freitas and Curry (2014) and Freitas et al. (2014) embed rela-tional graphs from KBs in a distriburela-tional semantic space to support various forms of search and rea-soning about the KB. The focus is again on rela-tions between discrete entities, and on exploiting distributional semantics to navigate among them.
Socher et al. (2013a) represent WordNet and FreeBase entities with corpus-based distributional vectors. They train a tensor for each relation of interest to return high scores when combined with the vectors of two entities that hold the intended relation. At test time, the system is used to classify relational tuples as true or false, as well as to predict new entities that hold a certain relationship with a target entity. This is quite close in spirit to what we do, except that, given anentity1-relation-entity2
tuple, we treatrelation-entity2as a binary attribute ofentity1, and we try to induce such attributes on a larger scale (Socher et al. consider seven relations in total). Moreover, we rely on the same architec-ture to learn discrete feaarchitec-tures denoting relations with entities and numerical features, to induce full attribute-based descriptions of entities.
Our proposal is only distantly related to methods to embed words tokens and KB entities and rela-tionships in a vector space, e.g., for better relation extraction (see Weston et al. (2013) and references therein). This line of work does not use distribu-tional semantics to induce word vectors, and ig-nores numerical attributes.
The broader goal of getting at referential infor-mation with distributional semantics is shared with Herbelot (2015). However, the specific approach is different, as she constructs vectors for individ-ual entities (literary characters) by contextindivid-ualizing generic noun vectors with distributional properties of those entities. Finally, we share our methodol-ogy with work on mapping between corpus-based word representations and other representational spaces, such as subject-generated concept prop-erties (Johns and Jones, 2012; Hill et al., 2014; F˘ag˘ar˘as¸an et al., 2015), visual features (Frome et al., 2013; Socher et al., 2013b; Lazaridou et al., 2014) or brain signals (Mitchell et al., 2008; Mur-phy et al., 2012). In all these settings, the focus is entirely on predicting numerical attributes, whereas we treat both numerical and binary attributes. Ru-binstein et al. (2015) use distributional vectors to predict binary conceptual attributes of common nouns, as well as a continuous score measuring saliency of such attributes. Our target features are conceptually very different from those of all these studies.
6 Discussion and Conclusion
ref-erential attributes of an entity that are typically seen in a knowledge base from the corresponding corpus-based distributional representation. The re-sults suggest that, while distributional semantic vectors can be used “as-is” to capture generic word similarity, with some supervision it is also pos-sible to extract other kinds of information from them, including structured factual statements of the sort encoded in manually-curated knowledge bases. This makes distributional vectors very attractive as general-purpose word meaning representations.
We have also shown that some of the errors in the predictions can be explained on cultural grounds, but that these effects are more pronounced in the input of our model, a standard distributional se-mantic model, than in its output. In this sense, our model manages to objectify the information that it is provided with. Our analyses also suggest that the main limiting factor in learning referential at-tributes, apart from good old data sparseness, is the degree to which they arecontextually supported, that is, to what extent they are expressed with con-sistent and specific linguistic means in the context of their target words. This determines whether they are actually represented in the distributional model in the first place.
More generally, we see our work as a small step towards the more general goal of bridging the concept-referent gap in distributional semantics. A common noun such asdogdenotes aconcept, based on a prototype with fuzzy boundaries, sus-ceptible of metaphorical extensions, and bearing all the other hallmarks of generic conceptual knowl-edge (Carlson, 2009; Murphy, 2002). These might be adequately captured by the properties of thedog
vector in distributional semantic space. However, when used in a specific discourse, words and more complex linguistic expressions often denote spe-cificreferentswith fixed, “hard” properties, such asthis dog, orAmur, when used for my neighbor’s dog at 3.31pm on May 29th 2015 in Novosibirsk, a 61cm-tall black-and-tan foxhound. Amur is more easily characterized by a set of precise attribute-value pairs than by a vector in a generic concep-tual space. Our experiment suggests that distri-butional vectors encode both generic conceptual knowledge and more precise attributes of specific referents. Of course, while we can use FreeBase and other knowledge bases to gather training data about public-domain entities, such as countries or cities, it is still not clear where we could gather
appropriate training data to learn about the specific properties of “private-discourse” referents such as Amur. Moreover, it remains to be seen whether the properties of common named entities, such as countries and cities, that are in a sense “hybrid” be-tween the conceptual and referential domains, also transfer to entities of a more specific and private kind. Finally, it is still not clear how to extend the current approach beyond words and phrases directly denoting an entity (Amur) to other kinds of definite descriptions (this dog).
Acknowledgments: This project has received funding from the European Union’s Horizon 2020 research and innovation programme under the Marie Sklodowska-Curie grant agreement No 655577 (LOVe); ERC 2011 Starting Independent Research Grant n. 283554 (COMPOSES); DFG (SFB 732, Project D10); and Spanish MINECO (grant FFI2013-41301-P). This paper reflects the authors’ view only, and the EU is not responsible for any use that may be made of the information it contains. Special thanks to Christian Scheible for help with the Machine Learning part, to the anonymous reviewers for insightful and construc-tive feedback, and to the FLOSS reading group for helping us shape our ideas on the topic of this paper.
References
Marco Baroni and Alessandro Lenci. 2010. Dis-tributional Memory: A general framework for corpus-based semantics. Computational Linguistics, 36(4):673–721.
Paul Buitelaar and Philipp Cimiano. 2008. Bridging the Gap between Text and Knowledge. IOS, Amster-dam.
Greg Carlson. 2009. Generics and concepts. In Jefrey Pelletier, editor,Kinds, Things and Stuff, pages 16– 35. Oxford University Press, Oxford, UK.
Bradley Efron and Robert Tibshirani. 1994. An Intro-duction to the Bootstrap. Chapman and Hall, Boca Raton, FL.
Katrin Erk, Sebastian Pad´o, and Ulrike Pad´o. 2010. A flexible, corpus-driven model of regular and inverse selectional preferences. Computational Linguistics, 36(4):723–763.
Luana F˘ag˘ar˘as¸an, Eva Maria Vecchi, and Stephen Clark. 2015. From distributional semantics to fea-ture norms: grounding semantic models in human perceptual data. InProceedings of IWCS, pages 52– 57, London, UK.
Andr´e Freitas and Edward Curry. 2014. Natural language queries over heterogeneous linked data graphs: A distributional-compositional semantics approach. In Proceedings of IUI, pages 279–288, Haifa, Israel.
Andr´e Freitas, Jo˜ao Carlos Pereira da Silva, Edward Curry, and Paul Buitelaar. 2014. A distributional semantics approach for selective reasoning on com-monsense graph knowledge bases. InProceedings of NLDB, pages 21–32, Montpellier, France.
Alinda Friedman, Dennis Kerkman, and Norman Brown. 2002. Spatial location judgments: A cross-national comparison of estimation bias in subjective North American geography. Psychonomic Bulletin & Review, 9(3):615–623.
Andrea Frome, Greg Corrado, Jon Shlens, Samy Ben-gio, Jeff Dean, Marc’Aurelio Ranzato, and Tomas Mikolov. 2013. DeViSE: A deep visual-semantic embedding model. In Proceedings of NIPS, pages 2121–2129, Lake Tahoe, NV.
Aur´elie Herbelot. 2015. Mr Darcy and Mr Toad, gen-tlemen: distributional names and their kinds. In Pro-ceedings of IWCS, pages 151–161, London, UK. Felix Hill, Roi Reichart, and Anna Korhonen. 2014.
Multi-modal models for concrete and abstract con-cept meaning. Transactions of the Association for Computational Linguistics, 2:285–296.
Brendan Johns and Michael Jones. 2012. Perceptual inference through global lexical similarity. Topics in Cognitive Science, 4(1):103–120.
Willis F. Kern and James R. Bland. 1948. Solid Men-suration with Proofs. Wiley, New York, 2nd edition. Angeliki Lazaridou, Elia Bruni, and Marco Baroni. 2014. Is this a wampimuk? Cross-modal map-ping between distributional semantics and the visual world. In Proceedings of ACL, pages 1403–1414, Baltimore, MD.
Max Louwerse and Rolf Zwaan. 2009. Language en-codes geographical information. Cognitive Science, 33:51–73.
Chris Manning, Prabhakar Raghavan, and Hinrich Sch¨utze. 2008. Introduction to Information Re-trieval. Cambridge University Press, Cambridge, UK.
Tomas Mikolov, Wen-tau Yih, and Geoffrey Zweig. 2013. Linguistic regularities in continuous space word representations. In Proceedings of NAACL, pages 746–751, Atlanta, Georgia.
Mike Mintz, Steven Bills, Rion Snow, and Dan Juraf-sky. 2009. Distant supervision for relation extrac-tion without labeled data. In Proceedings of ACL, pages 1003–1011, Singapore.
Tom Mitchell, Svetlana Shinkareva, Andrew Carlson, Kai-Min Chang, Vincente Malave, Robert Mason, and Marcel Just. 2008. Predicting human brain ac-tivity associated with the meanings of nouns. Sci-ence, 320:1191–1195.
Brian Murphy, Partha Talukdar, and Tom Mitchell. 2012. Selecting corpus-semantic models for neu-rolinguistic decoding. In Proceedings of *SEM, pages 114–123, Montreal, Canada.
Gregory Murphy. 2002. The Big Book of Concepts. MIT Press, Cambridge, MA.
Sebastian Pad´o and Mirella Lapata. 2007. Dependency-based construction of semantic space models. Computational Linguistics, 33(2):161–199. Mark Palatucci, Dean Pomerleau, Geoffrey Hinton, and Tom Mitchell. 2009. Zero-shot learning with se-mantic output codes. InProceedings of NIPS, pages 1410–1418, Vancouver, Canada.
Dana Rubinstein, Effi Levi, Roy Schwartz, and Ari Rappoport. 2015. How well do distributional mod-els capture different types of semantic knowledge? In Proceedings of ACL (Volume 2: Short Papers), pages 726–730, Beijing, China.
Richard Socher, Danqi Chen, Christopher Manning, and Andrew Ng. 2013a. Reasoning with neural tensor networks for knowledge base completion. In
Proceedings of NIPS, pages 926–934, Lake Tahoe, NV.
Richard Socher, Milind Ganjoo, Christopher Manning, and Andrew Ng. 2013b. Zero-shot learning through cross-modal transfer. InProceedings of NIPS, pages 935–943, Lake Tahoe, NV.
Peter Turney and Patrick Pantel. 2010. From fre-quency to meaning: Vector space models of se-mantics. Journal of Artificial Intelligence Research, 37:141–188.