© 2019, IRJET | Impact Factor value: 7.211 | ISO 9001:2008 Certified Journal | Page 3541
An Integrated Recommendation System Using Graph Database and
QGIS
Miss. Dipali R.Dubey
1, Prof. Sowmiya Raksha R. Naik
21
M.Tech Student, Dept of Computer Engineering and IT, VJTI College, Mumbai, Maharashtra, India
2
Assistant Professor, Dept of Computer Engineering and IT, VJTI College, Mumbai, Maharashtra, India
---***---Abstract -
Graph database is an alternative to traditionalrelational database since graph is self-explanatory and flexible which can cope up with any complex structure. Recently, graph database is extensively used to represent multi linked data on web, publication links, social network, network structure and many more. This research suggests a recommendation system for shopping, where based on shopping behavior of people the shortest path is suggested to user. Due to busy schedule there is limited time that one can invest in shopping so based on online reviews of product, the shortest distance to nearest mall is calculated using Qgis. The review of products of various categories is done using Neo4j, which is a graph database. An overview field of recommender system and various methods of recommendation are also presented in this paper. Recommendation system or recommender system (RSs) are subset of information filtering system and are software tools and techniques providing suggestions to the user according to their needs. Many popular E-commerce sites use RSs to recommend music, movies, books, articles. The main intention of this research is to provide shortest path to user to any nearest mall. This research provides guidelines to anyone who wants to implement graph database for recommendation system and also suggests advantages and disadvantages of various recommendation algorithms.
Key Words: Recommendation System, Neo4j, QGIS, Shortest path.
1. INTRODUCTION
Recommendation system (RS) is very useful tool which guaranties the right information are serve to user at right time[11]. RSs are useful in many domains, such as web personalization, information filtering and e-commerce. Recommendation systems are of various types i.e. personalized system and non-personalized system, content based filtering, collaborative, hybrid. Personalized recommendation is based on suggestions by group of users. Non- personalized is based on same suggestions from all users. Different E-commerce website follows these technique or combination of technique for recommendation.
A graph database uses graph structures to represent and store data which is basically collection of nodes, edges, and properties. A graph is flexible structure, which naturally allows integration of multiple entities all together. That facilitates merging of various RS techniques like utility based
recommendation; knowledge based recommendation as well as content based recommendation [11].
In previous work done, the Huff model is calibrated for the city of Shenzhen, China, by fusing two data sources: taxi trajectory data, and social media shopping reviews. Results demonstrated that social media reviews give greater predictive power when the Huff model is calibrated globally, while taxi journeys give greater predictive power when the Huff model is calibrated locally [3]. Since social media review data is freely available and continuously growing, we suggest that social media reviews offer a powerful new opportunity for predicting retail behaviors. Fusing data sources for automatic prediction of shopping behaviors has the potential for significant impact on urban, transport, and retail planning.
This paper focuses on finding the shortest path for a mall from the current location so that the time spend for shopping is minimized and the product to be purchased is achieved by viewing the online reviews of that product in graphical format. The methodology used ensures that with the help of online reviews of products and by finding the shortest path between two malls will help one save their time and predict the shopping behavior according to pattern.
The major objectives of the system are:
Analyze the review of the products
Find the shortest path
Compare previously proposed model with new hybrid approach to minimize the time required to shop any product in a particular mall.
2. Literature Survey
Various recommendation techniques are available in literature. The selection of technique is associated with datasets or the mechanisms and depends upon the recommendation you are building. Finding the shortest path is the key mechanism since time is the crucial part in this busy world and it contributes to the success or failure of the process.
© 2019, IRJET | Impact Factor value: 7.211 | ISO 9001:2008 Certified Journal | Page 3542
considered as research topic. Knowledge-based recommendation system suggests recommendations based on some knowledge and opinions accumulated from experts.
There could be three types of knowledge involved into such a system: catalog knowledge, function knowledge and user knowledge [11]. Recently, personalized RS proposed that analysed content and the interconnections between the content itself and external knowledge sources referred as a knowledge graph [14]. It has been observed that, there have not been many efforts in directions that using external knowledge for improving performance of content- based recommendations and it is the motto of our work.
Recommender systems typically generate a list of recommendations based on user histories without taking any input relate to preference from users. In this way, users can only passively receive recommended results without any chance to alter or adjust the results [7]. However, in practice, users usually have multiple intentions and may like to actively input their interests to obtain different recommendations. Say for example, one user was purchasing books for him yesterday but, today he is interested to buy books for his kids. To cope up with this issue, utility based recommendation techniques have been evolved which suggests few products based on usefulness of the each product for particular need of the active user [9].
Although many methods have been proposed in the past [8, 10, 13] in this direction each one has different methodology. Recently, query-based recommendation [5] proposes that allow a user to specify his/him search intention using a novel approach called “heterogeneous preference embedding". The proposed method constructs a user-item preference network from user access logs, in which the vertices represent users and various items and the edges are the relationships between the users and the items. After the construction, an edge-sampling technique is applied to embed the large information network into low-dimensional vector spaces, in which the proximity information of each vertex is encoded into its learned vector representation. Afterwards, that uses the learned representations of vertices with some simple search methods or similarity calculations to conduct the task of query-based recommendation.
The feature-based RS [12] is also purposed that works on the principal of “The people who bought / like a product with X features also like other products with features X”. This technique has been proven effective for frequently changing product catalogues, product catalogue with custom products. In this work, the product similarity has been done based on features of the products.
A graph-based RS has been also proposed that uses using weighted undirected graph to generate recommendations based on similarity between elements [3]. The two layer graph model has used to perform hybrid model which incorporate content based and collaborative-filtering
approach for digital library [1]. For graph based RS random walk based scoring algorithm is proposed [4] to rank products/items for every active user according to its expectations.
3. RECOMMENDATION TECHNIQUES
A) Collaborative filtering
Discovered by Goldberg et.al in 1992, collaborative filtering is based on the idea that people who agree with the evaluation of items in the past are likely to agree in future. It is of two types i.e. neighborhood based collaborative filtering and model based filtering.
Neighborhood filtering is also known as memory based/ heuristic based filtering. It is based on the idea that user ratings stored in the memory are used directly to predict the classification of new item to user. Training model use the train dataset and then based on these training dataset it predicts the rating of new items to the user. Example of this type of filtering is SVM, Bayesian, and Latent Semantic Analysis.
B) Content based Filtering
Content based filtering is also known as cognitive filtering. In this type of filtering, recommendation is based on the comparison between content of the items and user profile data.
C) Hybrid approach recommendation
Collaborative and content based filtering approaches are extensively used in information filtering application. Various approaches for recommendation are as follows:
Weighted- Score/weight of recommendation of item is calculated from results of all available recommendation techniques. Components with different scores are combined together and additive aggregations are implemented to get normalized scores.
Switching- Out of available recommendation components at disposal, the one which best suits the purpose is picked up. The system can switch between recommendation techniques.
Mixed- Merging and presenting multiple rated lists into single rated list. It avoids ‘new-item’ startup problem.
© 2019, IRJET | Impact Factor value: 7.211 | ISO 9001:2008 Certified Journal | Page 3543
Feature augmentations- It is similar to previous recommender but the only difference is that the contributor gives interesting characteristic. It is more elastic than previous one.
Fig 1: RSs in machine learning[15]
The above figure clearly shows that recommender system comes under the Unsupervised Learning of the Machine Learning paradigm [15]. In unsupervised learning the data available to us is not labelled so the hidden associations and cluster formation is revealed by performing unsupervised learning using algorithms that comes under that paradigm. Different approaches to recommendations are nothing but algorithms that comes under sub category Association rule mining.
4. EXISTING SYSTEM
The Huff Model is a spatial interaction model that calculates gravity-based probabilities of consumers at each origin location patronizing each store in the store dataset. From these probabilities, sales potential can be calculated for each origin location based on disposable income, population, or other variables. The probability values at each origin location can optionally be used to generate probability surfaces and market areas for each store in the study area.
As a gravity model, the Huff Model depends heavily on the calculation of distance. This tool can use two conceptualizations of distance - traditional Euclidean (straight-line) distance as well as travel time along a street network. To account for differences in the attractiveness of a store relative to other stores, a measure of store utility such as sales volume, number of products in inventory, square footage of sales floor, store parcel size, or gross leasable area is used in conjunction with the distance measure. Potential store locations can also be input into the model to determine new sales potential as well as the probabilities of consumers patronizing the new store instead of other stores.
The Huff Model can be used:
-To delineate probability-based markets for store locations in the study area
-To model the economic impact of adding new competitive store locations
-To forecast areas of high and low sales potential, which can guide new store location placement or refined marketing or advertising initiatives.
It is calculated as:
Hij = AjαDij-β / ∑j=1AjαDij-β
H_ij is the probability that a person at location i will visit a place at location j
A_j is the attractiveness of location j
D_ij is the distance the person at location i is from location j
\alpha is the attractiveness enhancement parameter \beta is the distance decay parameter
5. PROPOSED SYSTEM
The tool that is been used to represent the review of products in graphical format is Neo4j. The dataset collected is imported into neo4j folder once the tool is installed. After importing of data, cypher query is been written for the creation of nodes, labels and relationship between them. The resulted graph is displayed.
Neo4j is the world's leading open source Graph Database which is developed using Java technology. It is highly scalable and schemas free (NoSQL).
[image:3.595.39.289.159.337.2] [image:3.595.314.551.486.705.2]© 2019, IRJET | Impact Factor value: 7.211 | ISO 9001:2008 Certified Journal | Page 3544
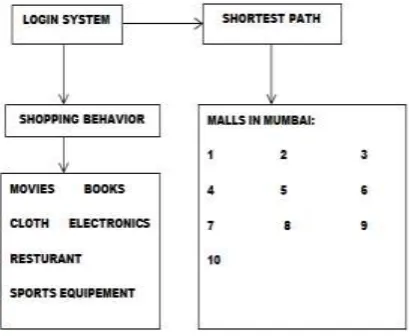
Fig 3: System diagram of graph based analyticFig 4: Flow behavior of system
Dataset Overview:
We use dataset consisting reviews from amazon. The time span of data collection is 18 years which includes 142.8 million reviews of various products. Amazon product dataset was compiled by Julian McAuley at UCSD.1. The data was collected by crawling the Amazon website and extracting the reviews that would be beneficial for the customers. This dataset includes reviews (ratings, text, helpfulness votes), product metadata (descriptions, category information, price, brand, and image features).
Fig 5: Sample Review
Where;
reviewerID - ID of the reviewer, e.g. A2SUAM1J3GNN3B
asin - ID of the product, e.g. 0000013714
reviewerName - name of the reviewer
helpful - helpfulness rating of the review, e.g. 2/3
reviewText - text of the review
overall - rating of the product
summary - summary of the review
unixReviewTime - time of the review (unix time)
reviewTime - time of the review (raw)
The shortest path calculation between two malls (nodes) is done by extracting Mumbai city map from Qgis tool, using open layer and osm plugins. Once the map is extracted and downloaded, the .shp file is imported by using vector layer and shortest path is found by specifying the latitude and longitude of the two nodes. The resulted path with the time required and distance is displayed.
6. RESULTS
MATCH (tom {name: "Tom Hanks"}) RETURN tom
LOAD CSV WITH HEADERS FROM "file:///mallcustomer.csv" AS line
WITH line RETURN line
CREATE (n:Gender) MATCH (n) RETURN n;
CREATE (n:Male{id:1,age:19,salary:15,spendingscore:39}) MATCH (n) WHERE n:Male RETURN n;
[image:4.595.52.552.46.791.2] [image:4.595.57.272.100.240.2] [image:4.595.63.268.280.448.2]© 2019, IRJET | Impact Factor value: 7.211 | ISO 9001:2008 Certified Journal | Page 3545
Shortest Path between two nodes:
7. CONCLUSION
The existing system used for prediction i.e. Huff Model is not appropriate for country like India so the alternative for the same is proposed in this paper. Neo4j helps to understand the view more graphically which is better than reading the reviews. And by finding the shortest path between two nodes helps in saving the time of buyers. Today people are very busy in their daily schedule that they have less time to invest in shopping. They need faster results in a little span of time and so by finding the shortest path helps them to gain their goals.
REFERENCES
[1] Y. Yue, H.-d. Wang, B. Hu, Q.-q. Li, Y.-g. Li, and A. G. Yeh, “Exploratory calibration of a spatial interaction model using taxi gps trajectories,” Computers, Environment and Urban Systems, vol. 36, no. 2, pp. 140–153, 2012.
[2] S. Gong, J. Cartlidge, Y. Yue, G. Qiu, Q. Li, and J. Xin, “Geographical Huff model calibration using taxi trajectory data,” in Proceedings of 10th ACM SIGSPATIAL International Workshop on Computational Transportation Science, Redondo Beach, CA, USA,
November 7–10, 2017.
https://doi.org/10.1145/3151547.3151553
[3] Y. Wang, W. Jiang, S. Liu, X. Ye, and T. Wang, “Evaluating trade areas using social media data with a calibrated huff model,” ISPRS International Journal of Geo-Information, vol. 5, no. 7, p. 112, 2016.
[4] D. L. Huff, “A probabilistic analysis of shopping center trade areas,” Land economics, vol. 39, no. 1, pp. 81–90, 1963.
[5] M. E. O’Kelly, “Trade-area models and choice-based samples: methods,” Environment and Planning A, vol. 31, no. 4, pp. 613–627, 1999.
[6] J. Cartlidge, S. Gong, R. Bai, Y. Yue, Q. Li, and G. Qiu, “Spatiotemporal prediction of shopping behaviors using taxi trajectory data,” in Proceedings of IEEE 3rd International Conference on Big Data Analysis (ICBDA’18), Shanghai, China, March 9–12, 2018.
[7] M. Birkin and A. Heppenstall, “Extending spatial interaction models with agents for understanding relationships in a dynamic retail market,” Urban studies research, Article ID 403969, 2011.
https://doi.org/10.1155/2011/403969
[8] A. Finn and J. J. Louviere, “Shopping center image, consideration, and choice: anchor store contribution,”
Journal of business research, vol. 35, no. 3, pp. 241–251, 1996.
MATCH (people:Person) RETURN people.name LIMIT 10
MATCH (tom:Person {name: "Tom Hanks"})-[:ACTED_IN]->(tomHanksMovies)
RETURN tom,tomHanksMovies
© 2019, IRJET | Impact Factor value: 7.211 | ISO 9001:2008 Certified Journal | Page 3546
[9] Yu Zheng, Yanchi Liu, Jing Yuan, Xing Xie, “Urban Computing Using Taxicabs,” Microsoft Research Asia, Beijing, China.
[10] M. Kanevski, A. Pozdnukhov, V. Timonin, “Machine Learning Algorithms for GeoSpatial Data: Applications and Software Tools,” 4th International Conference on Environmental Modelling and Software, Spain- July2008.
[11] Angira Amit Patel, Dr. Jyotindra N. Dharwa, “An Integrated Hybrid Recommendation model Using Graph Database”.
[12] GUO Yan-Yan, LIU Qi-cheng, “E-Commerce Personalized Recommendation System Based on Multi Agent”, 2010 Seventh International Conference on Fuzzy Systems and Knowledge Discovery (FSKD 2010).
[13] Ms. Shakila Shaikh, Dr. Sheetal Rathi,Asst Prof. Prachi Janrao, “Recommendation System in E-Commerce websites: A Graph Based Approach”, 2017 IEEE 7th International Advance Computing Conference.
[14] Antonii Rzheuskyi, Antonii Rzheuskyi, Mykola Stakhiv “Recommendation System Virtual Reference”.
[15] Kunal Shah, Akshaykumar Salunke, Saurabh Dongare, Kisandas Antala, “Recommender Systems: An overview to different approaches to recommendation”, 2017 International Conference on Innovations in information Embedded and Communication Systems (ICIIECS).
[16] Jianying Mai, Yongjian Fan ,Yanguang Shen, “A Neural Networks-based Clustering Collaborative Filtering Algorithm in E-commerce Recommendation System”, 2009 International Conference on Web Information Systems and Mining.
[17] https://neo4j.com/developer/get-started/
[18] https://www.tutorialspoint.com/neo4j/neo4j_graph_th eory_basics.htm
![Fig 1: RSs in machine learning[15]](https://thumb-us.123doks.com/thumbv2/123dok_us/9326016.434546/3.595.314.551.486.705/fig-rss-in-machine-learning.webp)